This is a program that presents a gdbserver interface to a debugger and pretends to be a RISC-V core that is running an ELF, while in reality it is just executing it from a trace file that you provide.
It supports standard RISC-V and also CHERIoT (with some limitations).
It contains a model of the registers and memory of the hart, but instead of actually executing instructions from memory, it simply applies the register and memory writes found in the trace file.
The end result is that you can take an instruction execution trace (currently only the ad-hoc Ibex and Cheriot-Ibex formats are supported), and the corresponding ELF, and then debug the trace in a real debugger (e.g. VSCode/CodeLLDB) with full access to the entire machine state, debug info, source code, locals/globals, stack frames, breakpoints, watchpoints, etc. Even reverse debugging works so you can step backwards!
If you have waves available in VCD or FST format and you have Surfer installed then it can set the cursor in the waves to the current execution time.
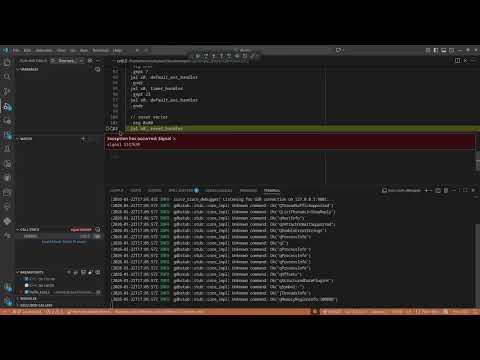
YouTube demo:
Download a pre-compiled release or build from source with
cargo install --git https://github.com/CHERIoT-Platform/riscv_trace_debugger.git
First run something like this:
riscv_trace_debugger --elf hello_world.elf --ibex-trace trace.log
Then configure your debugger to connect to 127.0.0.1:9001. In VSCode's launch.json with the CodeLLDB extension you want something like this:
    {
        "type": "lldb",
        "request": "attach",
        "name": "Remote attach",
        "targetCreateCommands": ["target create ${workspaceFolder}/hello_world.elf"],
        "processCreateCommands": ["gdb-remote 127.0.0.1:9001"],
        "reverseDebugging": true,
    },
Debuggers other than CodeLLDB are currently untested.
When you start that debugging session it should connect to riscv_trace_debugger and then you can set breakpoints, step through code, examine variables and so on.
There are some known bugs/issues:
- CHERI mostly ignores tags and metadata. In future I am hoping to be able to display these somehow.
- LLDB doesn't support reverse debugging properly so if you use it it switches to disassembly view.
- No support for float or vector registers.
- CHERI often displays
variable not availablewhen trying to view variables.
Set up Rust in the usual way, then I recommend building a fully static binary with Musl:
rustup target add x86_64-unknown-linux-musl
cargo build --release --target=x86_64-unknown-linux-musl