ERDDAP can generate a transparent PNG output that can be easily added as a layer over CDE to present the extent of a trajectory dataset or grid dataset
The following notebook present the following two examples:
https://colab.research.google.com/drive/1n8KIHJm12a4SAu99gHoI1UomjUrfMtk-?usp=sharing
This method relies extensively on the server-side transformation which reduces the data transferred and speeds up the whole process.
Grid Datasets
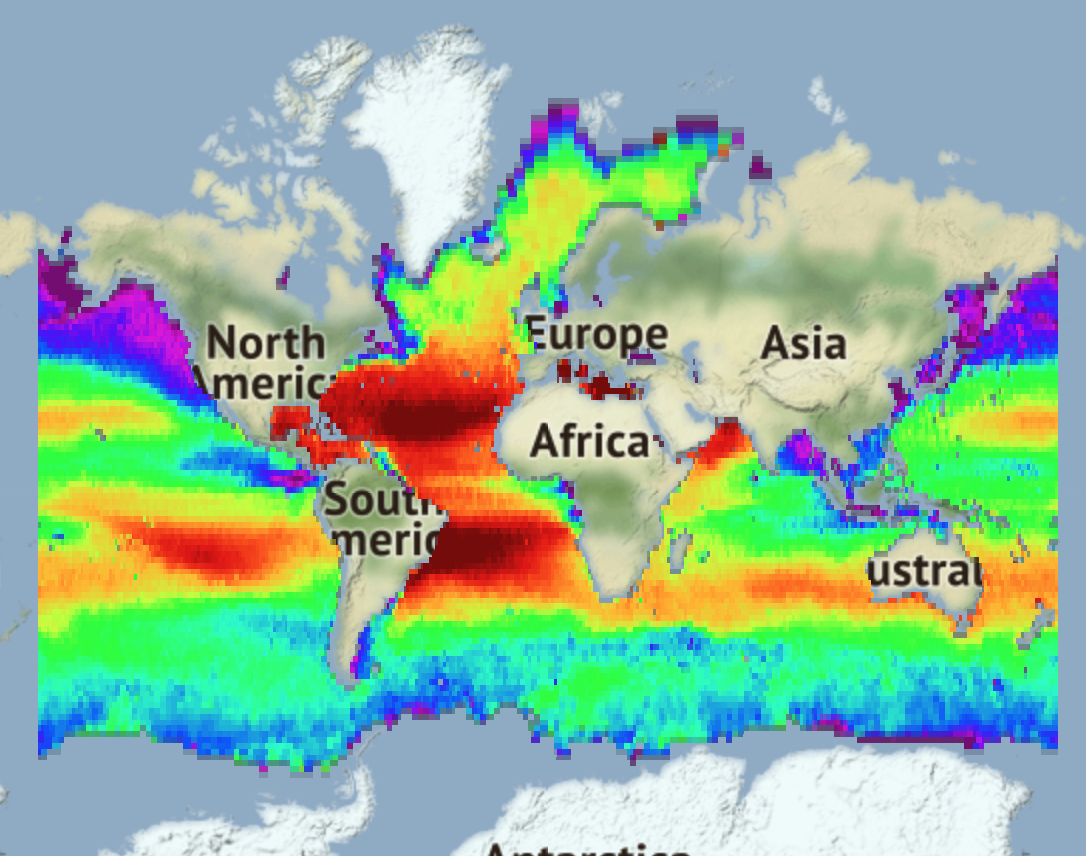
The following notebook presents an example to retrieve a grid data figure from an ERDDAP Dataset and plot it on the map by relying on the kml output form erddap
Trajectory datasets
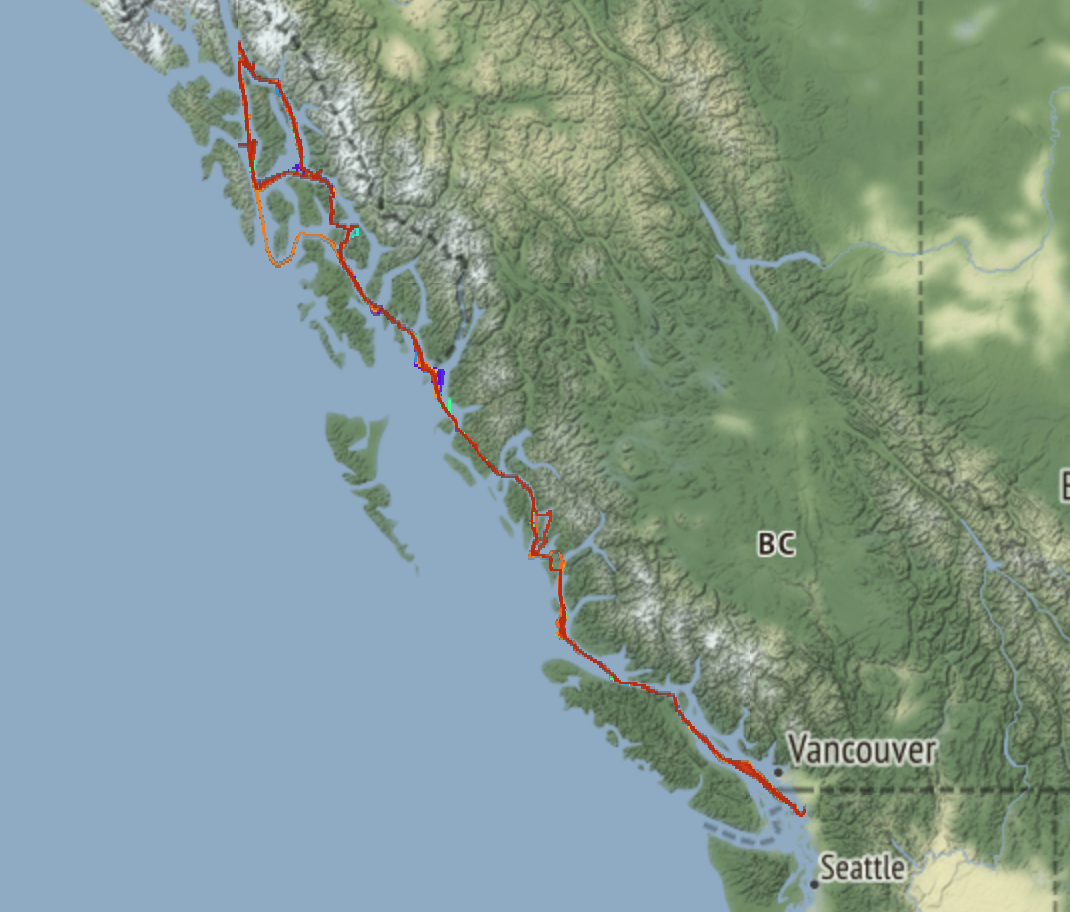
And a similar method is used to download a specific trajectory ID for a specific lat/long range and plot it on a map.
Issues
The present code which is relying on Folium to generate the figures cannot handle data exceeding the +/-85 deg latitude.
ERDDAP can generate a transparent PNG output that can be easily added as a layer over CDE to present the extent of a trajectory dataset or grid dataset
The following notebook present the following two examples:
https://colab.research.google.com/drive/1n8KIHJm12a4SAu99gHoI1UomjUrfMtk-?usp=sharing
This method relies extensively on the server-side transformation which reduces the data transferred and speeds up the whole process.
Grid Datasets
The following notebook presents an example to retrieve a grid data figure from an ERDDAP Dataset and plot it on the map by relying on the kml output form erddap

Trajectory datasets
And a similar method is used to download a specific trajectory ID for a specific lat/long range and plot it on a map.
Issues
The present code which is relying on Folium to generate the figures cannot handle data exceeding the +/-85 deg latitude.