At yesterdays LMFDB friday we discussed adding pictures to the homepages of Dirichlet characters in the same way as elliptic curve and cmf plots.
As dirichlet characters can be specified completely by just a few roots of unity (values of the generators) we could just plot those, but thats a little boring, and doesn't let you "see" any properties of the character.
We discussed a few ideas but one we quite liked was based on the idea of plotting partial sums of exponential sums, Gauss sums in this case (I think I was sortof inspired by https://www.johndcook.com/expsum/).
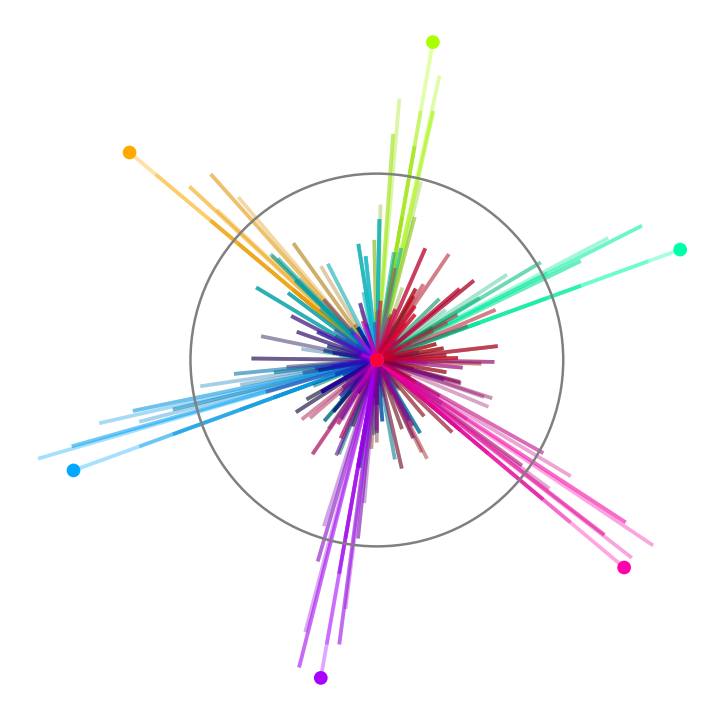
The different partial gauss sums for different values of the parameter $a$ are plotted in different colours, getting brighter as more terms are included. We also put a dot of the same colour for the final value.
One mathematically significant fact about Gauss sums is that for a primitive character all of the complete gauss sums have absolute value $\sqrt{modulus}$ so we additionally plot a circle of that radius, allowing us to "see" the primitivity of the character.
One can also see the order of the character in many cases as the order of rotational symmetry of the picture.
One can instantly recognise trivial characters by the presence of red horizontal spike for instance.
Probably there is more we can see from them (real character iff symmetry in the real axis?)
I've but together a demo of some of these at
https://alexjbest.github.io/dirich/
you should be able to zoom in/out to see more at once and click the label for the lmfdb page.
Let me know what you think, the goal is to be mathematically correct and somewhat meaningful but also visually pleasing, so feedback on both aspects is appreciated.
The sage code I've been using to make these is at https://alexjbest.github.io/dirich/code.sage if you want to play with more
At yesterdays LMFDB friday we discussed adding pictures to the homepages of Dirichlet characters in the same way as elliptic curve and cmf plots.
As dirichlet characters can be specified completely by just a few roots of unity (values of the generators) we could just plot those, but thats a little boring, and doesn't let you "see" any properties of the character.
We discussed a few ideas but one we quite liked was based on the idea of plotting partial sums of exponential sums, Gauss sums in this case (I think I was sortof inspired by https://www.johndcook.com/expsum/).
The different partial gauss sums for different values of the parameter$a$ are plotted in different colours, getting brighter as more terms are included. We also put a dot of the same colour for the final value.
One mathematically significant fact about Gauss sums is that for a primitive character all of the complete gauss sums have absolute value$\sqrt{modulus}$ so we additionally plot a circle of that radius, allowing us to "see" the primitivity of the character.
One can also see the order of the character in many cases as the order of rotational symmetry of the picture.
One can instantly recognise trivial characters by the presence of red horizontal spike for instance.
Probably there is more we can see from them (real character iff symmetry in the real axis?)
I've but together a demo of some of these at
https://alexjbest.github.io/dirich/
you should be able to zoom in/out to see more at once and click the label for the lmfdb page.
Let me know what you think, the goal is to be mathematically correct and somewhat meaningful but also visually pleasing, so feedback on both aspects is appreciated.
The sage code I've been using to make these is at https://alexjbest.github.io/dirich/code.sage if you want to play with more