ENH: Implement time-frequency analysis methods #308
Description
Is your feature request related to a problem? Please describe.
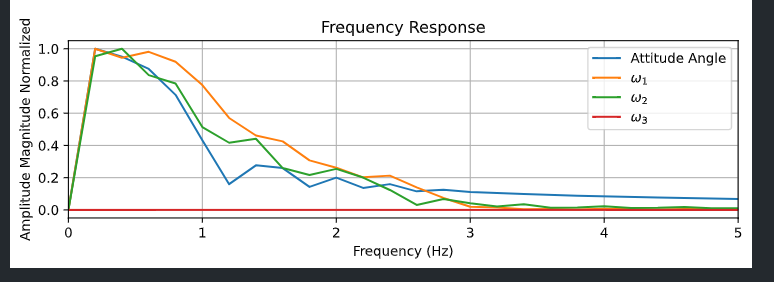
Currently, the flight simulation performs a frequency response analysis for the attitude angle, omega1, omega2 and omega3. This analysis is a simple application of FFT in the first five seconds of derailed flight.
The resulting plot shown in allInfo is:
Describe the solution you'd like
An interesting addition would be to implement time-frequency analysis methods, such as STFT (short-time Fourier transform), wavelets decomposition, least square spectral analysis or Prony's method.
Each of these methods could add interesting and useful information to RocketPy's simulation and would be very interesting when adding/studying control methods.
New plots would be needed to show the results of these different methods, such as spectrograms.
Additional context
This issue comes from PR #292 where def toFrequencyDomain method of the Function class was added