This Python package 🐍 allows you to perform financial analysis with just a few lines of code 🧑💻. It not only focuses on mathematical analysis, also on visual analysis through graphics. Finally, you can generate a dashboard with the most important statistical elements to make decisions. 📈
This package is focused on those who want to be agile in financial analysis using Google Colab as their main tool.

- The first thing you do is open Google Colaboratory in Google Search or Google Drive. That's easy! 😀
- Attached to the link of Google Colaboratory: Link.
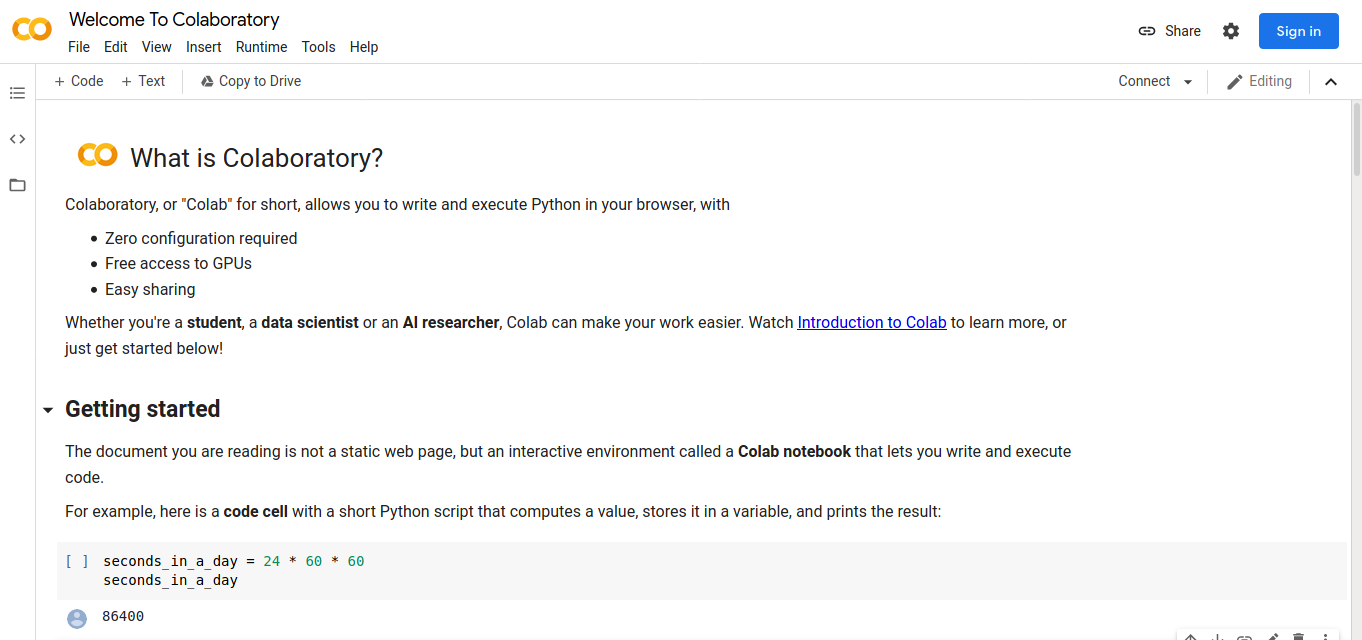
- Then, to click the link, you need to create your work environment. So, the first image you will to see is the following:
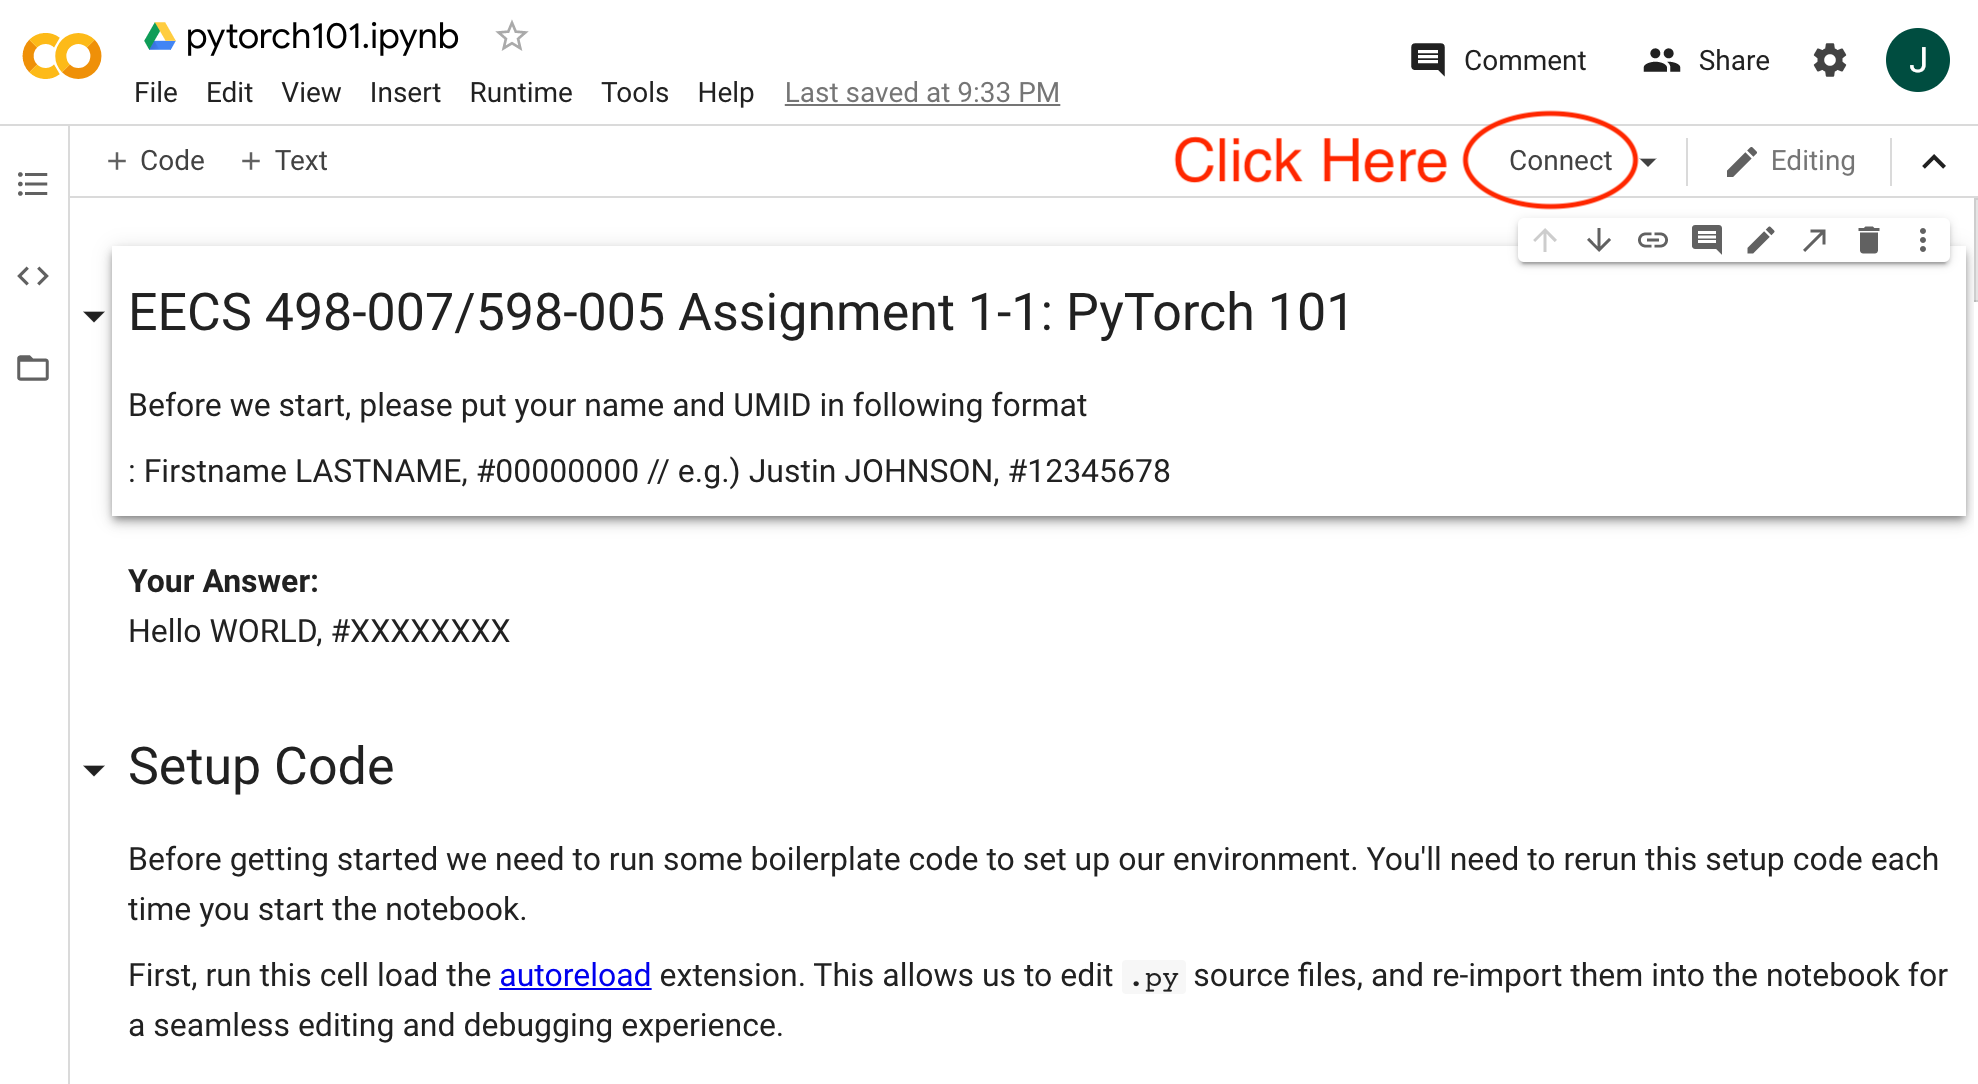
- How do you start your work environment? Well, it's important for you to understand that your work environment is the space where you write your code and Google Colaboratory shows your results. So, Google Colaboratory needs to connect to Python. Easy-going! Just click on the "Connect" option. That option is located at the top right of your screen.
Before enjoying the features of package, you must install it.
!pip install pyFinancialAnalysis
from pyFinancialAnalysis.informations import get_basic_information_company
from pyFinancialAnalysis.informations import get_specific_information
from pyFinancialAnalysis.informations import get_company_stock_information
from pyFinancialAnalysis.informations import find_index_date

# Module Analysis
from pyFinancialAnalysis.analysis import stock_growth
from pyFinancialAnalysis.analysis import stock_base_growth
from pyFinancialAnalysis.analysis import average_stock_growth
from pyFinancialAnalysis.analysis import average_stock_growth_base
from pyFinancialAnalysis.analysis import stock_standard_deviation
from pyFinancialAnalysis.analysis import stock_standard_deviation_base
from pyFinancialAnalysis.analysis import stock_variance
from pyFinancialAnalysis.analysis import stock_variance_base

# Module Graphics
from pyFinancialAnalysis.graphics import stock_price_graph_linear
from pyFinancialAnalysis.graphics import stock_price_growth_graph
from pyFinancialAnalysis.graphics import stock_price_growth_base_graph
from pyFinancialAnalysis.graphics import stock_chart_candlestick
from pyFinancialAnalysis.graphics import stock_average_growth_graph_bar
from pyFinancialAnalysis.graphics import stock_average_growth_base_graph_bar
from pyFinancialAnalysis.graphics import stock_standard_deviation_graph_bar
from pyFinancialAnalysis.graphics import stock_standard_deviation_base_graph_bar
from pyFinancialAnalysis.graphics import stock_histogram
from pyFinancialAnalysis.graphics import stock_histplot

# Module Dashboard
from pyFinancialAnalysis.dashboard import financial_dashboard- You need to obtain information about the closing price of Apple and Amazon stocks from 2022-01-01 to 2022-10-30.
# Call the required module from the package
from pyFinancialAnalysis.informations import get_company_stock_information

# Insert the required information in the function
stock_dataframe = get_company_stock_information(["AAPL", "AMZN"], "2022-01-01", "2022-10-30", "Close")
stock_dataframe