plot regions from archive specs #9
Description
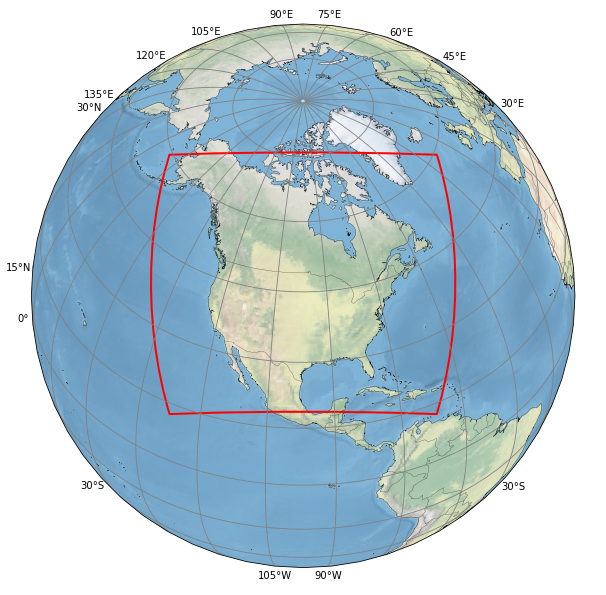
some prototype code:
import cartopy.feature as cf
import matplotlib.pyplot as plt
import numpy as np
import matplotlib.patheffects as path_effects

import cordex as cx

eur11 = cx.cordex_domain("NAM-11", dummy="topo")
eur11

pollat = eur11.rotated_latitude_longitude.grid_north_pole_latitude
pollon = eur11.rotated_latitude_longitude.grid_north_pole_longitude
transform = ccrs.RotatedPole(pollon, pollat)
cenlon = ((eur11.lon.max() + eur11.lon.min()) * 0.5).data
cenlat = ((eur11.lat.max() + eur11.lat.min()) * 0.5).data
projection = ccrs.Orthographic(central_longitude=cenlon, central_latitude=cenlat, globe=None)
#https://stackoverflow.com/questions/59020032/how-to-plot-a-filled-polygon-on-a-map-in-cartopy
projection._threshold /= 100.
#projection = ccrs.Orthographic()
#projection = ccrs.PlateCarree()
#projection = transform
from shapely import geometry
ds = eur11
polygon = geometry.Polygon([[ds.rlon.min(), ds.rlat.min()], [ds.rlon.max(), ds.rlat.min()],
                            [ds.rlon.max(), ds.rlat.max()], [ds.rlon.min(), ds.rlat.max()]])
polygon

vmin=None
vmax=None
cmap=None
borders=True
xlocs=range(-180, 180, 2)
ylocs=range(-90, 90, 2)
extent=None
figsize=(15, 10)
title=None

plt.figure(figsize=figsize)
ax = plt.axes(projection=projection)
ax.stock_img()
#ax = plt.axes(projection=ccrs.PlateCarree())
ax.set_global()
#ax.set_extent([-46, 70, 20, 75], crs=projection)
#ax.add_feature(cf.OCEAN, color='white', zorder=0)
#ax.add_feature(cf.LAND, color='lightgray',zorder=0,
#               linewidth=0.5, edgecolor='black')
ax.gridlines(draw_labels=True, linewidth=0.8, color='gray', xlocs=range(-180,180,15), ylocs=range(-90,90,15))
ax.coastlines(resolution='50m', linewidth=0.3, color='black')
#if extent:
    # ax.set_extent([ds_sub.rlon.min(), ds_sub.rlon.max(), ds_sub.rlat.min(), ds_sub.rlat.max()], crs=transform)
#    ax.set_extent(extent, crs=projection)
#ax.gridlines(
#    draw_labels=True, linewidth=0.5, color="gray", xlocs=xlocs, ylocs=ylocs
#)
#eur11["topo"] = 1.
#eur11.topo.plot(ax=ax, transform=transform, lw=0.7, facecolor="blue")
#gdf.plot(ax=ax)
ax.add_geometries([polygon], crs=transform, facecolor="none", edgecolor='red', alpha=1.0, lw=2.)
#fig = da.plot(ax=ax, cmap=cmap, transform=transform, vmin=vmin, vmax=vmax)
#fig.set_path_effects([path_effects.SimpleLineShadow(), path_effects.Normal()])
#ax.coastlines(resolution="50m", color="black", linewidth=1)
if borders:
    ax.add_feature(cf.BORDERS, linewidth=0.2)
if title is not None:
    ax.set_title(title)