by Brendan Gregg, Netflix at JavaOne Oct 2015
Netflix
- 60mil subscribers
- FreeBSD based CDN
- 10s of 1000s of EC2 instances mostly running Oracle JVM
- via ssh and opensource tools
- using Netflix's Vector GUI (opensource, not covered here)
wanna notice all CPU cycles, Java Mixed-Mode Flame Graph via Linux-Perf Events
Don't overlook system code - kernel, libraies, etc. Everyone's code is bug ridden, even kernel code.
Improving perf
- identify tuning targets
- incident response
- non-regression testing
- software evaluations
- CPU workload characterization
Cost savings
- ASGs often scale on load avg CPUs
Auto-Scaling
  Group                     ,^,
                   _________| |_________
                  [   Scaling   Policy  ]
            ,---->[loadavg, latency, etc]
            |     ''''''''''| |''''''''''
            |               | |
        Cloudwatch,         '!'
          Servo-----------[ Instance ]
            |-------------[ Instance ]
            '-------------[ Instance ]
Profile Java as a user-level process. Miss-out on realities of GC, Kernel, libraries, JVM.
- Visibility
- Java method execution
- Object usage
- GC logs
- Custom Java context
- Typical problems
- Sampling often happens at safety/yield points (skew)
- Method tracing have massive observer effect
- Mis-identify RUNNING as on-CPU (e.g. epoll)
- Doesn't include or profile GC/JVM CPU time
- tree views not quick (proportional) to comprehend
- Inaccurate (skewed) and incomplete profiles
See everything but Java.
- Visibility
- JVM (C++)
- GC (C++)
- libraries
- kernel (C)
Typicla problems (x86)
- Stack missing for Java
- Symbols missing for Java method
Other arch (eg SPARC) have fared better.
- Can use both.
- Better but Java context is often crucial for interpreting system profiles.
Java Mixed-Mode Flame Graph
-
Filesystem profiling, only way to se it all
-
Visibility (everything)
- Java methods
- JVM (C++)
- GC (C++)
- libraries
- kernel (C)
Minor problems
- 0-3% CPU overhead to enable frame pointers (usually <1%)
- Symbol dumps can consume burst of CPU
Complete and accurate asynchronous profiling.
- Demo
- Flame graphs are available in browser as interactive, search-able content.
- Record stacks at a timed interval, simple and effective
- Pros: low deterministic overhead
- Cons: coarse accurace, but usually sufficient
stack          B    B
samples:  A    A    A                   A    A
          |    |    |    :    :    :    |    |
 ,--------"----"----"----"----"----"----"----"-----,
 |           B-------->syscall       ,>.           |
 |  A------->'         |             | '-------->  |
 | --------------------|-------------|---------->  |
 |         on-CPU      |   off-CPU   |      time   |
 '---------------------"-------------|-------------'
                      block ~.~.~.~.interrupt
- Stack traces, jstack
## code path snapshot
### top down for running codepath start; down parent; down g.parent;...
$ jstack 1819
- Linux
perf_events (aka
perf)
- BSD/Solaris
Dtrace
- OSX
Instruments
- Windows
XPerf
- standard linux profiler
provides
perfcommand multi-tool usually added bylinux-tools-common
- features
- time-based sampling
- hardware events
- tracepoints
- dynamic tracing
- can sample stack almost everything on CPU
can miss hard interrupts ISRs, should be near zero can be measured with other tools
- stack profiling on all CPUs at 99Hz then dump
perf record -F 99 -ag -- sleep 30
##

perf script
generates a call tree and combines samples
perf report -n stdio
git clone --depth=1 https://github.com/brendangregg/FlameGraph
cd FlameGraph
perf record -F 99 -a -g -- sleep 30
perf script | ./stackcollapse-perf.pl | ./flamegraph.pl > perf.svg
- Flame Graphs
- x-axis : alphabetical stack sort, to maximize merging
- y-axis : stack depth
- color : random (default), or a dimension
- Currently made from Perl + SVG + JS
multiple D3 versions being developed
- easy to Get Started
    list events     count events      capture stacks
      ,|,                ,|,                ,|,
   [perf list]       [perf stat]       [perf record]
                                            |
Typical-------------------------->  ,-------""------,
Workflow                            |   perf.data   |
                                    '---------------'
                            text UI .|,           .|, dump profile
                           [perf report]      [perf script]
                                                 .|,
                flame graph  ,-----------[ stackcollapse-perf.pl]
                  viz       -|
                             '-----------[   flamegraph.pl      ]
-
top-edges show whose running on-CPU and how much (width)
-
top-down show ancestory
-
widths are proportional to presence in samples
e.g. comparing b() to h() (incl. children)
          ,=========,         = -> top-edges
          [  g()    ]
          ,---------,
          [  g()    ]
   ,=====,,---------,
   [ e() ][  f()    ]
   ,----------------===,,========,
   [         d()       ][   i()  ]
   ,-------------------,,--------,
   [         c()       ][   h()  ]
   ,-----------------------------,
   [                a()          ]
   '-----------------------------'
for dimensions
- Mixed-Mode Flame Graphs, Hues
green == java red == system yellow == C++ intensity randomized to differentiate frames or hashed bsed of func names
- Differential Flame Graph
used for comparing two profiles red == more samples, more CPU time blue == less samples, less CPU time intensity shows degree of diff also used for showing other metircs, e.g. CPI (Cycles Per Insruction; red==instructon heavy, blue==cycle heavy)
- Flame Graphs Search
magenta == matched frames
-
are useful but are not Flame Graphs
-
X-axis
Flame Chart - time Flame Graph - population (maximize merging)
using
perfstacks are 1 or 2 levels deep, have junk values
as a flame graph, broken java stack (missing frame pointer)
-
on x86 (x86_64) hotspot uses the Frame Pointer Register (RBP) as general purpose
-
"compiler optimization" breaks simple stack walking, wasn't before like this
-
gccprovides-fno-omit-frame-pointerto avoid, butjvmgot no such option
Possibilities
- A. Fix frame pointer-based stack walking (default)
pros: simple, supported widely cons: might cost little extra CPU
- B. Use a custom wlker (likely need kernel support)
pros: full-stack walking (incl. inlining and arguments) cons: custom kernel code, can cost way more CPU when in use
- C. Try
libunwindandDWARF
feasible with
JIT
Current preference is 'A'
- a PoC, hacked hotspot to support x86_64 frame pointer
// remove RBP from Register Pools
// ---/+++ openjdk8/hotspot/src/cpu/x86/vm/x86_64.ad

// Class for all pointer register ...
reg_class any_reg(.....
        ...
-       RBP, RBP_H
        ...
- use patched version for limited (and urgent) perf analysis
- patch is shared publicly, check for
A hotspot patch for stack profiling (frame pointer)on hotspot compiler dev mailing list
'JDK-8068945' for JDK-9, 'JDK-8072465' for JDK-8
-
Zoltan Majo from Oracle rewrote it and included in 'JDK 9' and 'JDK 8 update 60 build 19'
-
might cost 0-3% CPU, depending on workload
inlined frames are not present
-
about 60% frames may be missing (inlined)
-
disbale inlining
-XX:-inlinemany more java frames can be 80% slower
- may not be necessary
inlined flame-graphs often make enough sense Or tune
-XX:MaxInlineSizeand-XX:InlineSmallCodea little to reveal more frames, might improve perf
perf-map-agenthas experimental un-inline support
-
missing 'symbols' may show up as HEX in
perf -
for missing symboles, Linux perf already looks for an externally provided symbol file '/tmp/perf-PID.map', warns if it doesn't exist
-
can be created by Java agent
attaches and writes '/tmp' file on demand
- use of '/tmp' file
pros: simple, can be low overhead (snapshot on demand) cons: stale symbols
- using a symbol logger with 'perf' instead
Patch by 'Stephane Eranian' being discussed in 'lkml', see 'perf: add support for profiling jitted code'
need JDK8u60 or better for
-XX:+PreserveFramePointer
sudo bash

set -e

apt-get install -y cmake
[[ -z "$JAVA_HOME" ]] && exit 1
cd "${JAVA_HOME}/.."

git clone --depth=1 https://github.com/jrudolph/perf-map-agent
cd perf-map-agent && cmake . && make
need to be set on Java startup, check if enabled on linux
ps wwp `pgrep -n java` | grep PreserveFramePointer
## profile all process
perf record -F 99 -ag -- sleep 30

## profile just one pid
perf record -F 99 -p $PID -g -- sleep 30

## this creates perf data file
see doc of 'perf-map-agent', as same user as java
cd "$JAVA_HOME/../perf-map-agent/out"
java -cp attach-main.jar:$JAVA_HOME/lib/tools.jar net.virtualvoid.oerf.AttachOnce $PID
perf-map-agentcontain helper script, Brendan wrote on dump symbols quickly afterperf recordto minimize stsale symbols
perf record -F 99 -ag -- sleep 30 ; jmaps
- using FlameGraph
perf script > out.stacks01

git clone --depth=1 https://github.com/brendangregg/FlameGraph

cat out.stacks01 | ./FlameGraph/stackcollapse-perf.pl | \
  ./FlameGraph/flamegraph.pl --color=java --hash > flame01.svg
reads 'perf.data' with '/tmp/*.map' can try newer 'd3' FlameGraph implementation, much interactive and reviewable
opensource, on-demand instance analysis tool
real-time metrics ui tool, can view flame-graphs as well per instance (in development branch)
demo, ...
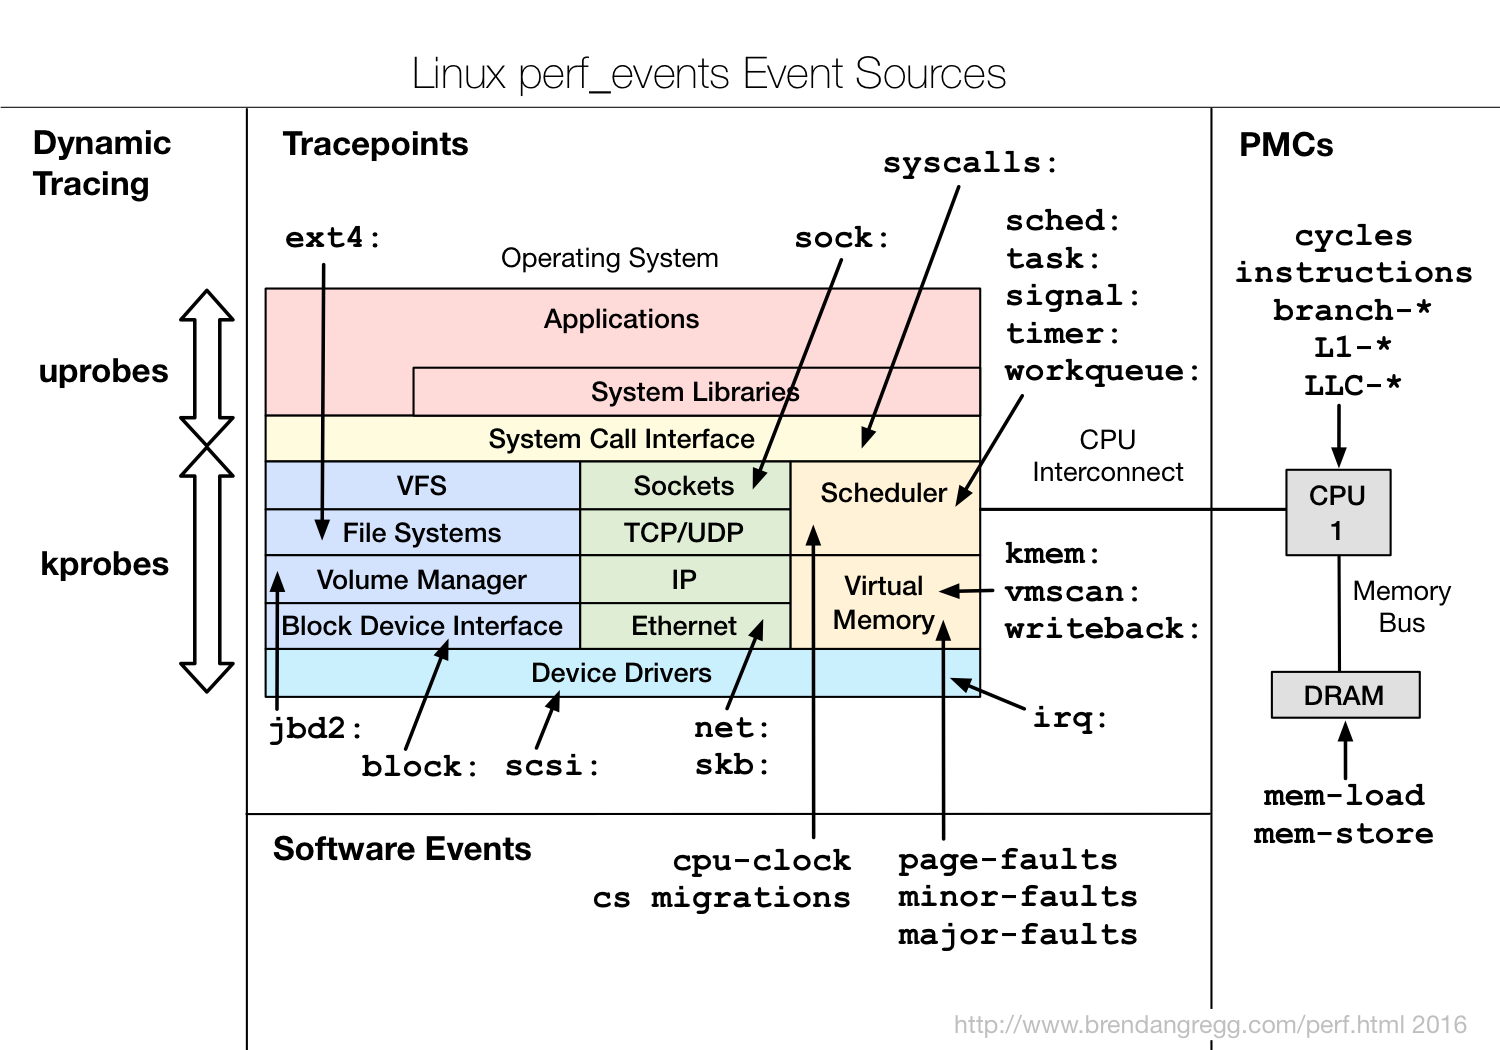
-
java thread still on-CPU, and event is directly triggered
-
examples
- disk i/o requests (direct reads, sync writes, page faults) issued directly by java -> yes
- disk i/o completion interrupts -> no(*)
- disk i/o requests triggered async, e.g. readahead -> no(*)
(* => can be mande yes by tracing and associating context)
- show what triggered main memory (resident) to grow
perf record -e page_faults -p $PID -g -- sleep 120
-
"fault" as main memory is allocated on demand, when a virtual page is first populated
-
low overhead tool to solve some types on memory leak
- show why java blocked and stopped running on-CPU
perf record -e context-switches -p $PID -g -- sleep 5
- identifies locks, I/O, sleeps
if code path shouldn't block and looks random, it's an involuntary ctx switch. could filter these, but should have solved beforehand
- shows who used disk i/o (sync reads and writes)
perf record -e block:block_rq_insert -a -g -- sleep 60
- tcp transmit using dynamic tracing
perf probe tcp_sendmsg

perf record -e context-switches -p $PID -g -- sleep 1 ; jmaps

perf script -f comm,pid,tid,cpu,time,event,ip,sym,dso,trace > out.stacks

perf probe --del tcp_sendmsg
-
can be high overhead for high packet rates using in current style
-
can also trace TCP connect and accept (lower overhead)
-
TCP receive is async (could trace via socket read)
- in e.g. sampling via
Last Level Cacheloads
## -c is count of samples
perf record -e LLC-loads -c 10000 -p $PID -g -- sleep 5 ; jmaps

perf script -f comm,pid,tid,cpu,time,event,ip,sym,dso > out.stacks
- use other CPU counters to sample hits/misses/calls