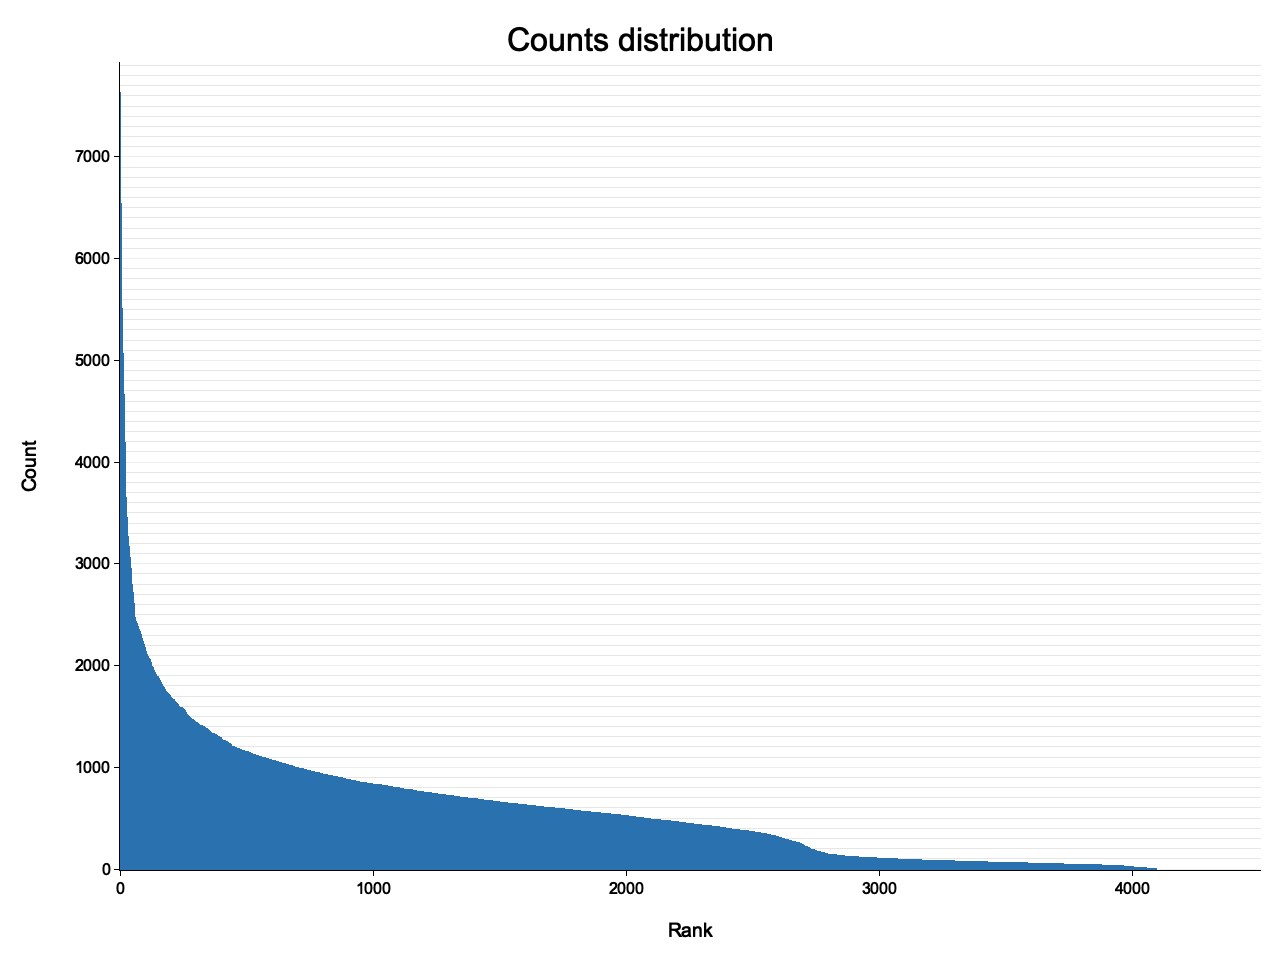
Commandline tool for aggregating (and plotting) frequency ranked histograms of TSV/CSV data.
While it started out as plotting tool, it is probably just better to use it for aggregating, that is generating the histogram data, and then use my (plotxy) or other plotting tools. See https://github.com/ahcm/plotxy
Plotting might be dropped in the future completely or feature gated. There is a PR for voicing your opinion. I default to dropping it.
You might need to first install libfontconfig-dev on your system (or some analog of your distro).
$ cargo install hist-cli
export PATH="$HOME/.cargo/bin:$PATH"
hist 0.5.0
Plots histogram of input

USAGE:
    hist [FLAGS] [OPTIONS] [input]

FLAGS:
    -H, --Header      input has header
    -h, --help        Prints help information
    -n, --nooutput    do not save a PNG plot to a file
    -t, --textplot    also plot a textplot to STDOUT
    -V, --version     Prints version information

OPTIONS:
    -a, --aggregate <aggregate>    aggregate function: count or sum [default: count]
    -T, --Title <Title>            optional title above the plot [default: Counts distribution]
    -d, --delimiter <delimiter>    column delimiter [default: \t]
    -g, --geometry <geometry>      the x and y size of the plot [default: 1280x960]
    -k, --key <key>                key (column) selector [default: 1]
    -o, --output <output>          file to save PNG plot to [default: histogram.png]
    -s, --save <save>              save counts data to file as TSV, use - for STDOUT
    -v, --value <value>            value (column) selector for sum aggregation (defaults to key column)
        --xdesc <xdesc>            x-axis label [default: Rank]
        --ydesc <ydesc>            y-axis label [default: Counts]

ARGS:
    <input>    optional file with on entry per line [default: STDIN]
Just piping from stdin:
$ cut -f 1 data.tsv | hist   # same as hist -k 1 data.tsv
$ open histogram.png # on MacOS, on Linux maybe xdg-open, display or eog
$ echo a3 b2 b2 a3 a3 c4 c4 c4 c4 | tr ' ' '\n' | hist -n -t

# not plot at all, just replace: sort | uniq -c | sort -n
$ echo a3 b2 b2 a3 a3 c4 c4 c4 c4 | tr ' ' '\n' | hist -n -s -
2       b2
3       a3
4       c4

# sum aggregation: sum values by key
$ echo -e "apple\t5\napple\t10\norange\t3" | hist -a sum -v 2 -n -s -
3       orange
15      apple