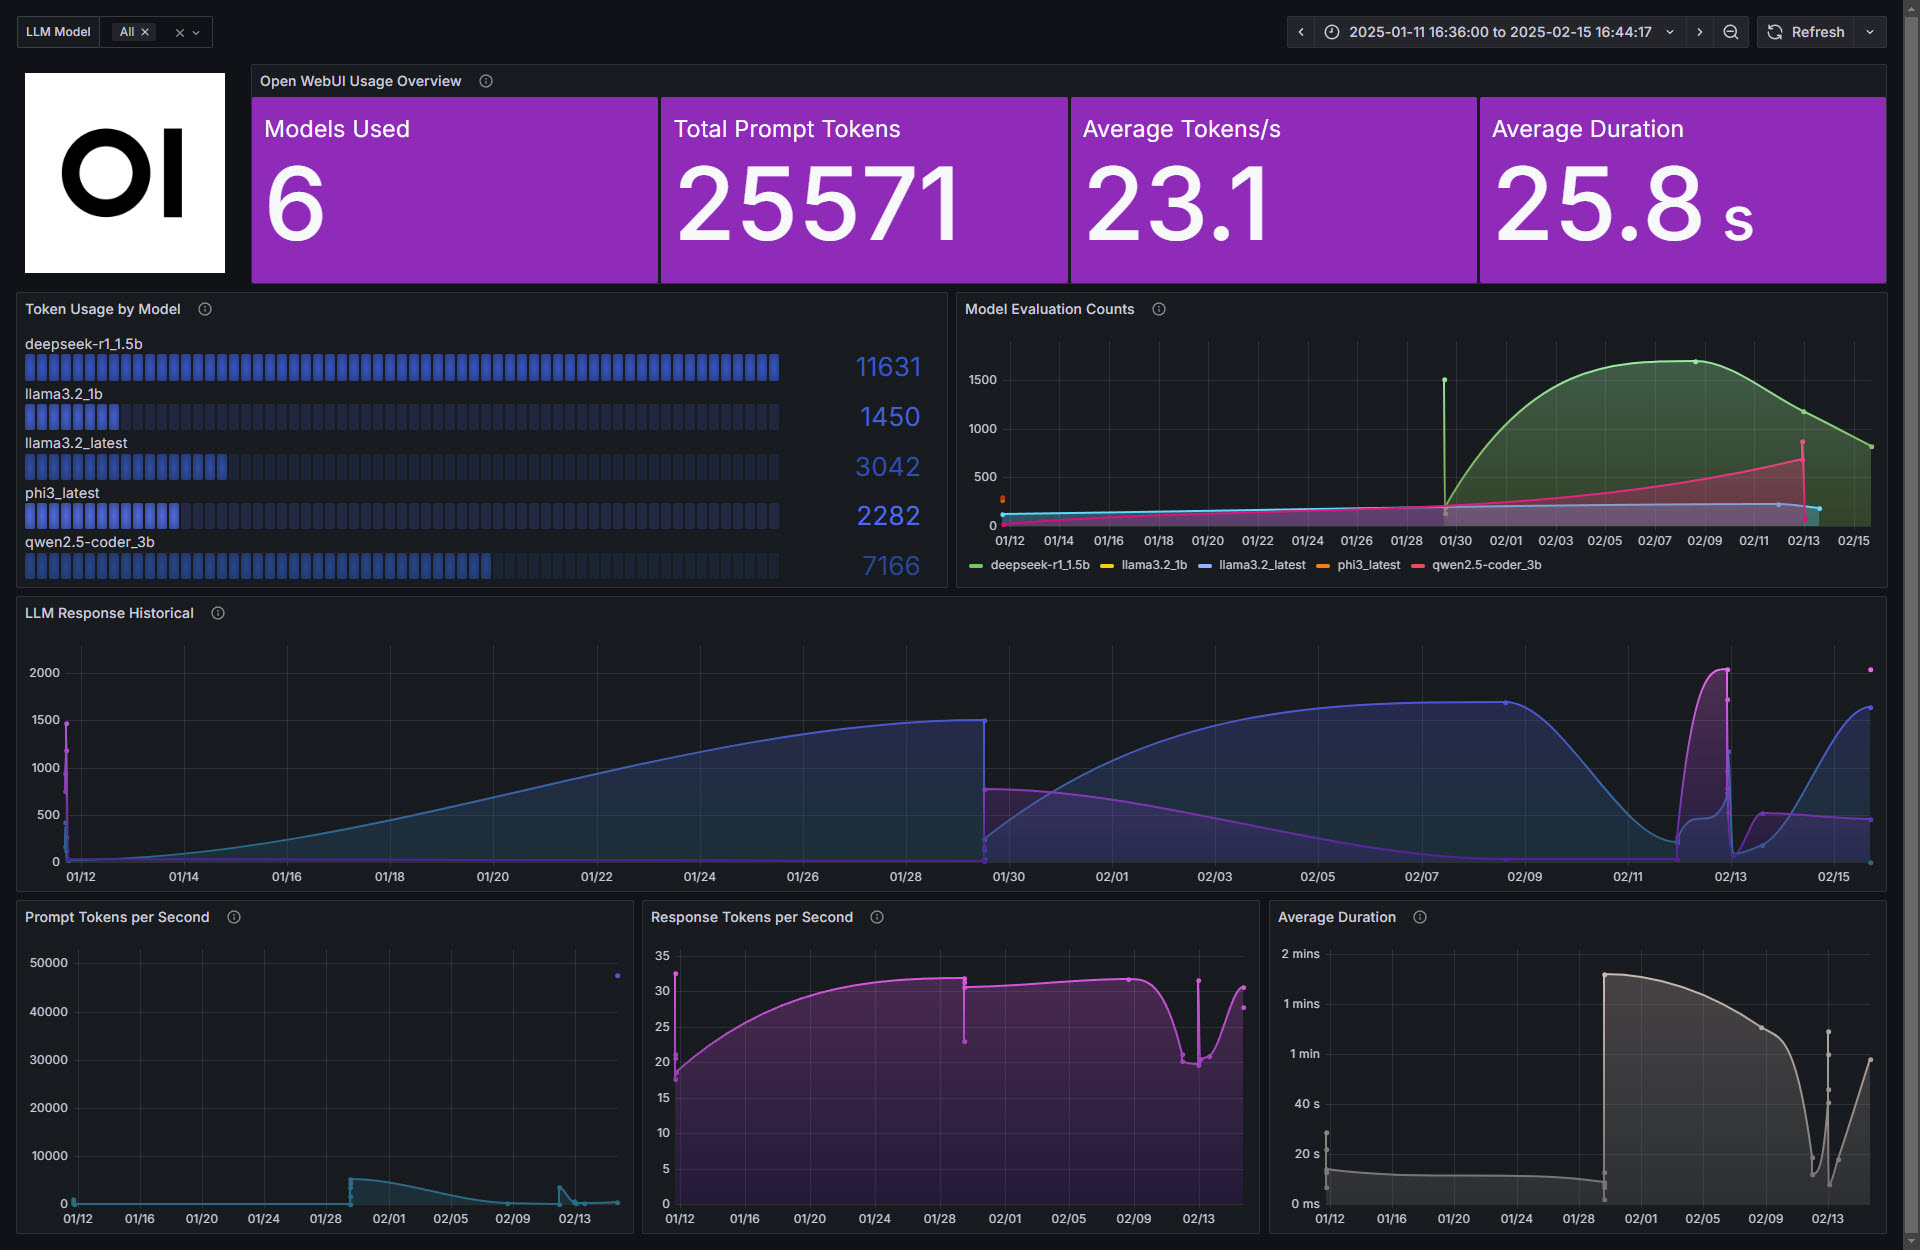
This project consists of a Bash Shell script to retrieve the Open WebUI information, directly from the RESTfulAPI, about chats, messages and their stats. The information is being saved to an InfluxDB database. Finally, a Grafana dashboard can be created to present all of the information.
We use Open WebUI RESTfulAPI to reduce the workload and increase the speed of script execution.

Copy the .env.example as .env
cp .env.example .envEdit the values in the .env file. Some configuration options to note are:
- SCRAPE_INTERVAL_SECONDS: To control the frequency to request new stats from the Open WebUI host.
- DRY_RUN: Set to true to run the scraper program without writing anything to the InfluxDB.
Run docker compose
docker compose up -dThe InfluxDB service should respond:
curl -i http://localhost:8086/healthYou should be able to login to InfluxDB: http://localhost:8086/
Run test to verify write access to the InfluxDB:
chmod +x tests/ci_influx_verify.shStart InfluxDB, load .env vars and run the test script:
docker compose up -d influxdb

set -a
source .env
set +a

export INFLUX_URL="http://localhost:8086"

bash tests/ci_influx_verify.sh
Shutdown:
docker compose down -vHere we use a docker compose deployment approach.
Check server compatibility:
docker --version
docker compose version
Create a dedicated directory:
sudo mkdir -p /opt/openwebui-scraper
sudo chown -R $USER:$USER /opt/openwebui-scraper
cd /opt/openwebui-scraper
git clone https://github.com/alfredeen/openwebui-grafana-bash.git .
Pull the code from the main branch:
git pull --ff-onlyCreate a .env file and edit as needed, at least the change-me values.
cp .env.example .env
chmod 600 .env
Build and start it:
docker compose up -d --build
docker compose ps |grep influx
docker compose ps |grep scraper
docker compose logs -f scraper
NB: Login to the InfluxDB and change the admin password via the InfluxDB UI. The INFLUXDB_INIT_PASSWORD is used only on first startup when the database is initialized. Changing INFLUXDB_INIT_PASSWORD later has no effect unless the InfluxDB volume is deleted.
Verify the deployment:
curl -fsS http://localhost:8086/health
docker compose logs --since=10m scraper
docker volume ls | grep scraper_statedocker compose stop scraper(Never stop it using -v)
Note that the scaper service logic relies on a timestamp read from and written to a lastrun.txt file. This is also created in dry_only=true mode. To reset the scraper service to read all history, then delete this file and restart the service:
docker exec -it openwebui-scraper rm -f /state/lastrun.txt
docker compose up -d --force-recreate scraper
If modifying the .env settings, redeploy the scraper service:
cd /opt/openwebui-scraper
docker compose up -d --force-recreate scraper
docker compose logs -f scraperIn Grafana, create a new dashboard from the JSON content in the file /grafana/grafana_dashboard_open_webui_2.json
This repository is originally based on https://github.com/jorgedlcruz/openwebui-grafana, now maintained independently.