[Boxplot] Add a vertical axis slider #18507
Replies: 3 comments
-
|
@ValentinC-BR thanks for the suggestion! looks like you have the feature working in your production already? we would love to hear how it benefit your org and discuss how to make it work in Superset :) |
Beta Was this translation helpful? Give feedback.
-
|
Hello, We're actually using the master branch (only the major releases, when they're stable) without any add-ons or modifications. |
Beta Was this translation helpful? Give feedback.
-
|
I just got a request for this from one of my users - they want to see outliers in the boxplot, but then be able to zoom in past them to investigate the majority of the data. |
Beta Was this translation helpful? Give feedback.
Uh oh!
There was an error while loading. Please reload this page.
-
Is your feature request related to a problem? Please describe.
The boxplot currently needs a user-defined axis range (see this feature request : #16745 )
However, this will only partially solve the problem. For better data exploration, providing the user with a slider to manually zoom in the y-axis would be a great enhancement.
Describe the solution you'd like

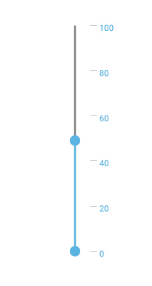
Add an option in the "Customize" panel :
When set to True, this display a vertical range slider (next to the y-axis) like this :
Describe alternatives you've considered
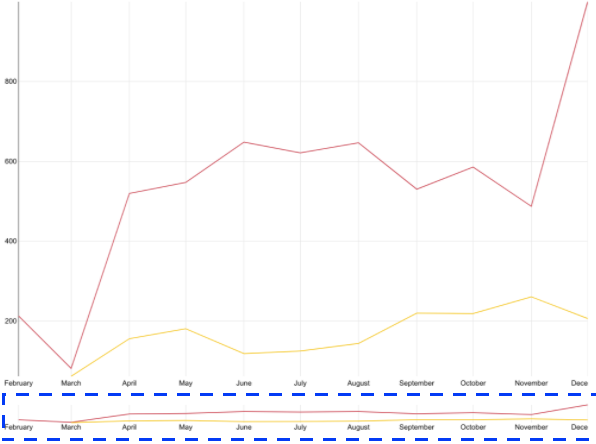
Range sliders like the x-axis zoom options in line charts can also be a solution, but would take too much space :
Additional context
/
Beta Was this translation helpful? Give feedback.
All reactions