Copied from Paper: https://paper.dropbox.com/doc/Lets-Play-A-Game-Whos-Calling-My-Service--AKxLd5h_8HQqEbarwO4tpgBXAg-XOybi5bYJqqOnlpFoiBjs
For some context, I’ve been working on getting the session service ready for prime time as we add more production traffic to the new Publish, Analyze and Account applications. Part of this process has been moving all of the pods to the core namespace from the buffer namespace. The first step (after cleaning up the code and monitoring) was to spin up the session-service in the core namespace:
buffer           session-service-v1-55559c8d4b-c2xxf                               1/1
buffer           session-service-v1-55559c8d4b-h2mh2                               1/1
buffer           session-service-v1-55559c8d4b-z85vq                               1/1
core             session-service-v1-master-57d7d67dd6-rtj8r                        2/2
core             session-service-v1-master-57d7d67dd6-t2vgr                        2/2
core             session-service-v1-master-57d7d67dd6-w6wmk                        2/2
We’ve got a package that manages all requests to the session service called the session-manager and it contains the routing logic for which version of the session service to make requests against. So I updated this package to switch the url from http://session-service.buffer to http://session-service.core which uses the session service from the core namespace. Then I updated the npm package version in Publish, Analyze, Account and Login applications and redeployed everything. At this point I thought that all of the services had been migrated over and we could spin down the session-service in the buffer namespace. Narrator: HE DIDN'T
There were still requests coming into the buffer namespace session-service. Now there are health checks being made by Kubernetes, however we were still getting lots of request after filtering those out:
cat <(kubectl logs -f --tail=20 session-service-v1-55559c8d4b-c2xxf & kubectl logs -f --tail=20 session-service-v1-55559c8d4b-h2mh2 & kubectl logs -f --tail=20 session-service-v1-55559c8d4b-z85vq) | grep POSTThis is where a tool like tracing comes in handy. But we don’t have tracing hooked up in our cluster yet. (Hint: we should do that) So what can we do? We’ve got logs! Logs that contain a nice piece of information about the remote IP address making the request:
{
  //... logz
  "_source": {
    "name": "SessionService",
    "hostname": "session-service-v1-55559c8d4b-h2mh2",
    "pid": 7,
    "level": 30,
    "timestamp": "2018-08-20T18:41:21.421Z",
    "request": {
      "url": "/",
      "method": "POST",
      "params": {},
      "connection": {
        "remoteAddress": "::ffff:100.96.14.170",
        "remotePort": 34196
      },
      "headers": {
        "accept": "application/json",
        "content-type": "application/json",
        "accept-encoding": "gzip,deflate",
        "user-agent": "node-fetch/1.0 (+https://github.com/bitinn/node-fetch)",
        "connection": "close",
        "content-length": "18",
        "host": "session-service-v1.buffer"
      }
    },
    "response": {
      "statusCode": 200,
      "responseTime": 0
    },
    "msg": "POST / 200 - 0ms",
    "time": "2018-08-20T18:41:21+00:00"
  }
}
So we’ve got a nice field here called _source.request.connection.remoteAddress that tells the IP address of the Pod that made the request. Using our elasticsearch logs in Kibana we can generate a list of IP addresses making the most requests to the buffer namespaced session service:

Note that the format is : format. We’re interested in the IPv4 format. Here’s the last piece of the puzzle: we need to lookup the pod name by the IPv4 address. Thankfully the Kubernetes API allows us to get all pod data (including the IP) and then we can filter using tools like jq to get the data we’re looking for. Here’s a bash command to look up a Pod by ip address:
kubectl get --all-namespaces  --output json  pods | jq '.items[] | select(.status.podIP=="100.96.31.125")' | jq .metadata.name

"buffer-login-task-acc-203-add-clientside-validation-s-buff95cnm"
After trying a few of the IP addresses, I found out that they’re all dev namespace deployments and nearly all the login service. It turns out the login service health check endpoint calls the session-service (which we knew and is on the list of stuff to fix this cycle). But what we didn’t know was the volume of requests being made, health checks alone on the dev namespace account for a little over 1RPS. While that doesn’t sound like a lot now, its going to be huge when we start scaling up our services to handle production traffic from our shiny new applications.

So now I’m off to fix the problem since I can see which services need to be updated/fixed/destroyed. But this does highlight that we’ve got a gap in our tooling, even though I can see who made the request to a given service there’s lots information I’m missing because it is too hard to find. Understanding how long requests take is hard to find. Getting a list of all services making a request to a given service is hard to find. Also you need to have kubectl access to the cluster, which is like sshing into a vm — too much potential for human error. Basically we want Jaeger or Zipkin, because this takes something that takes an afternoon and makes it take 1 minute:
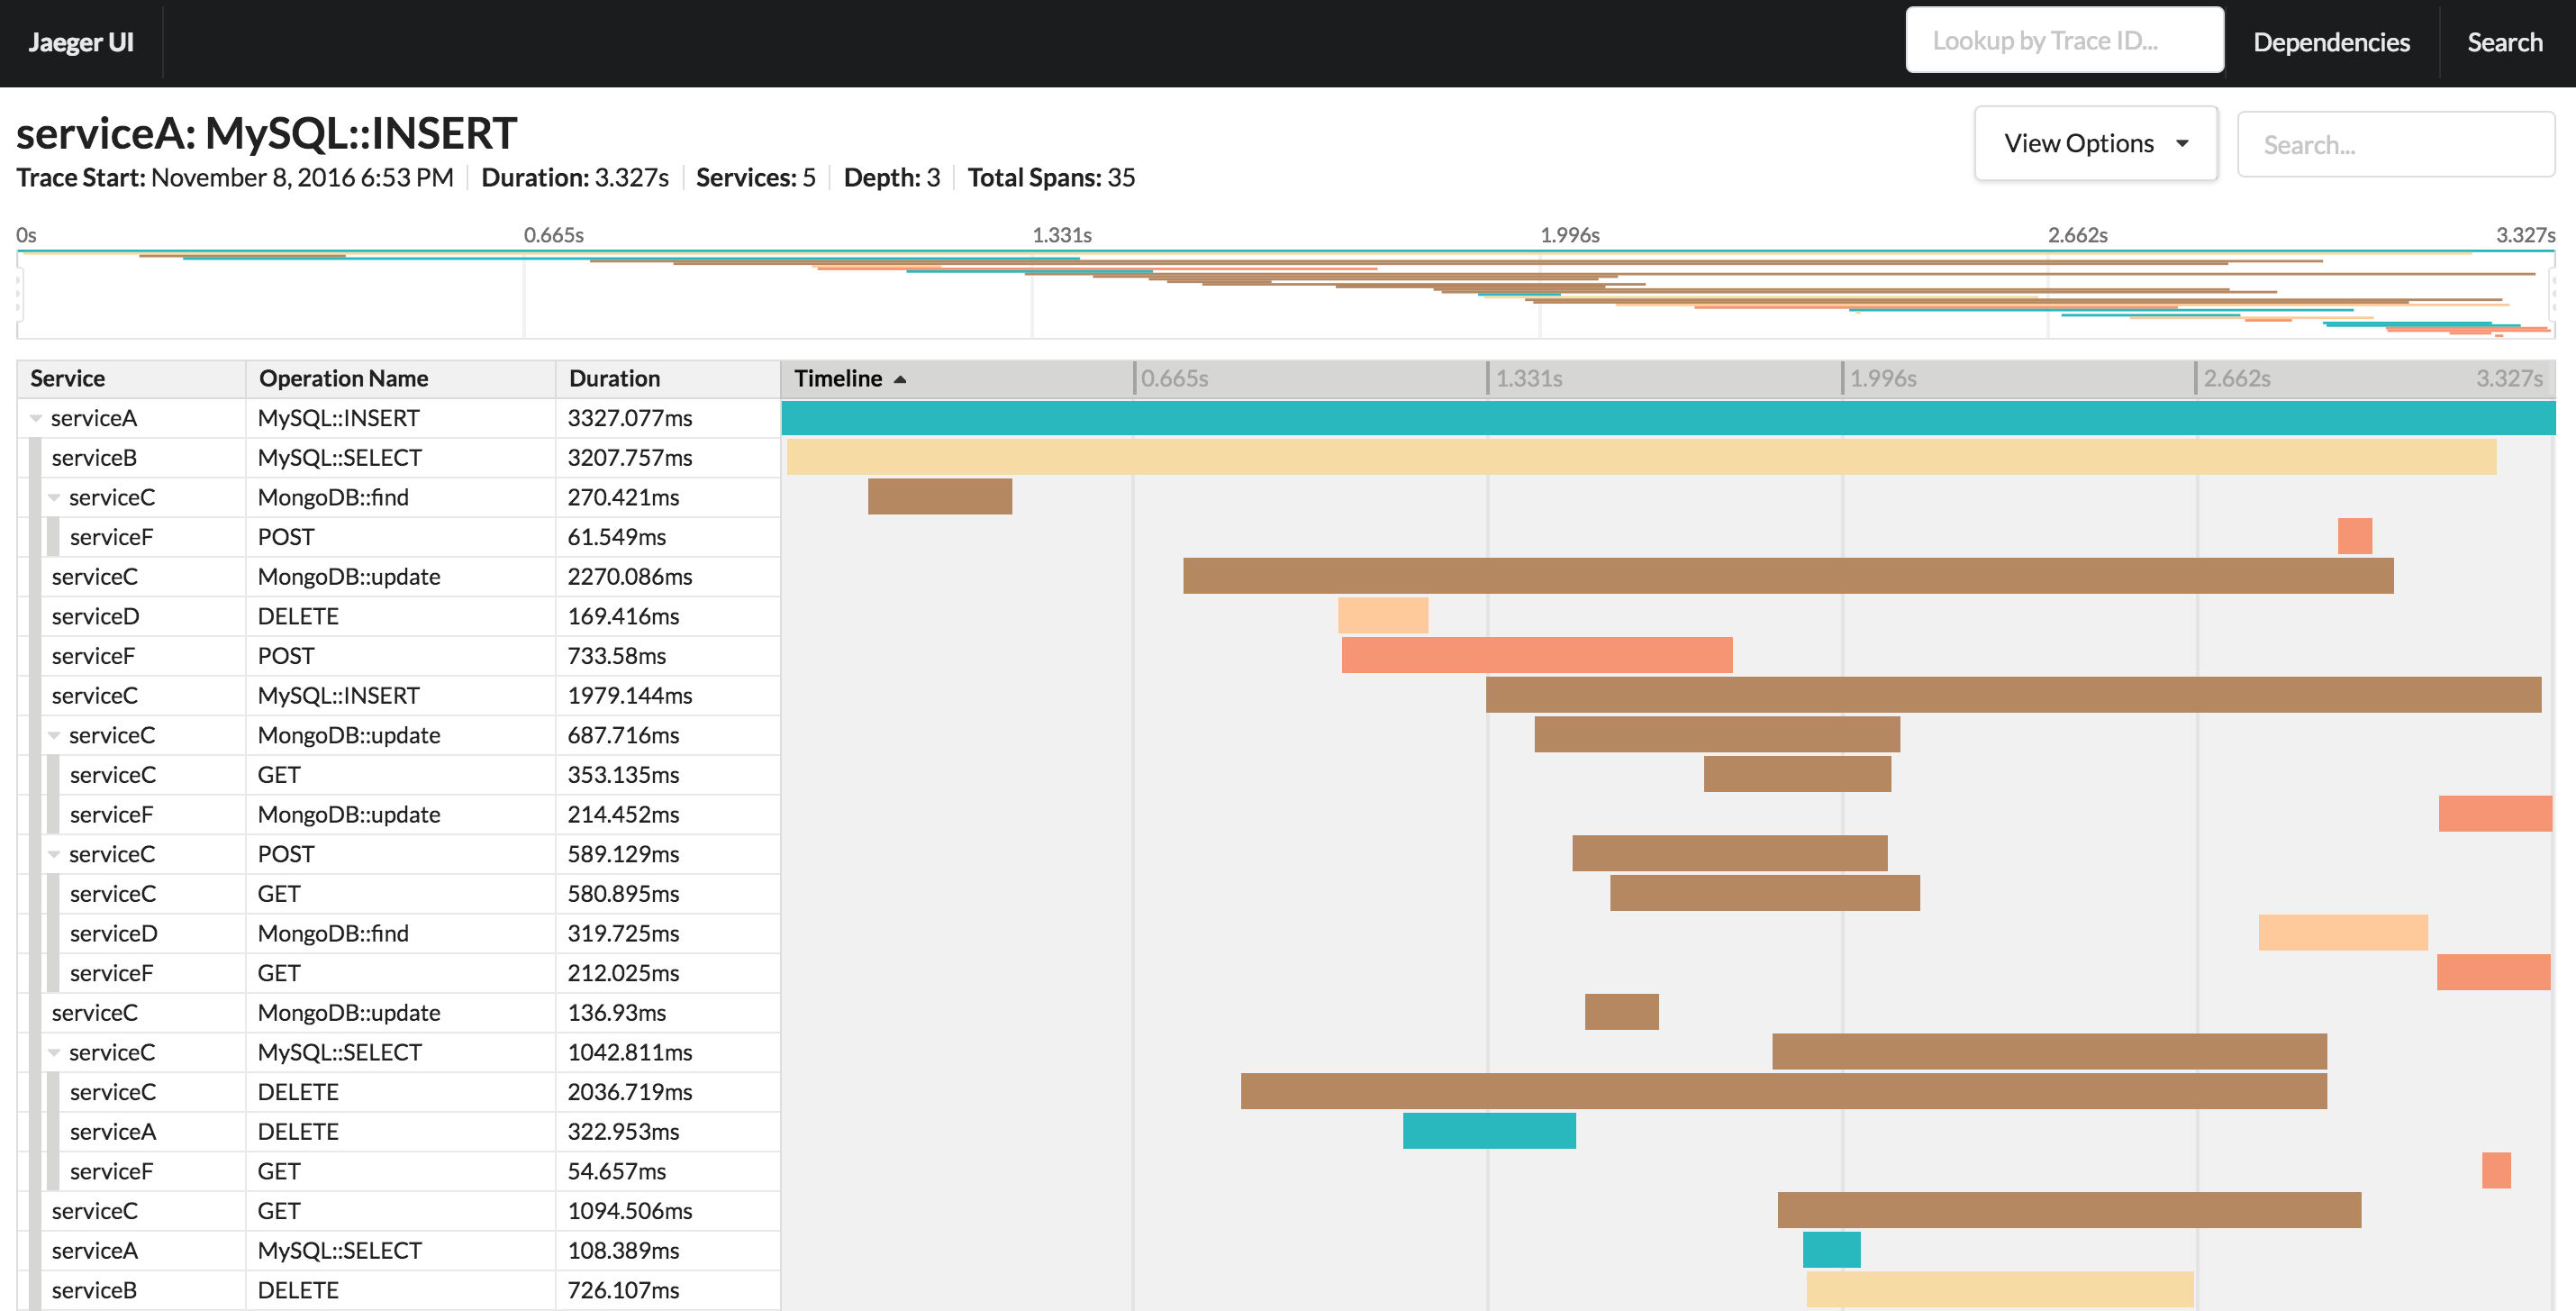
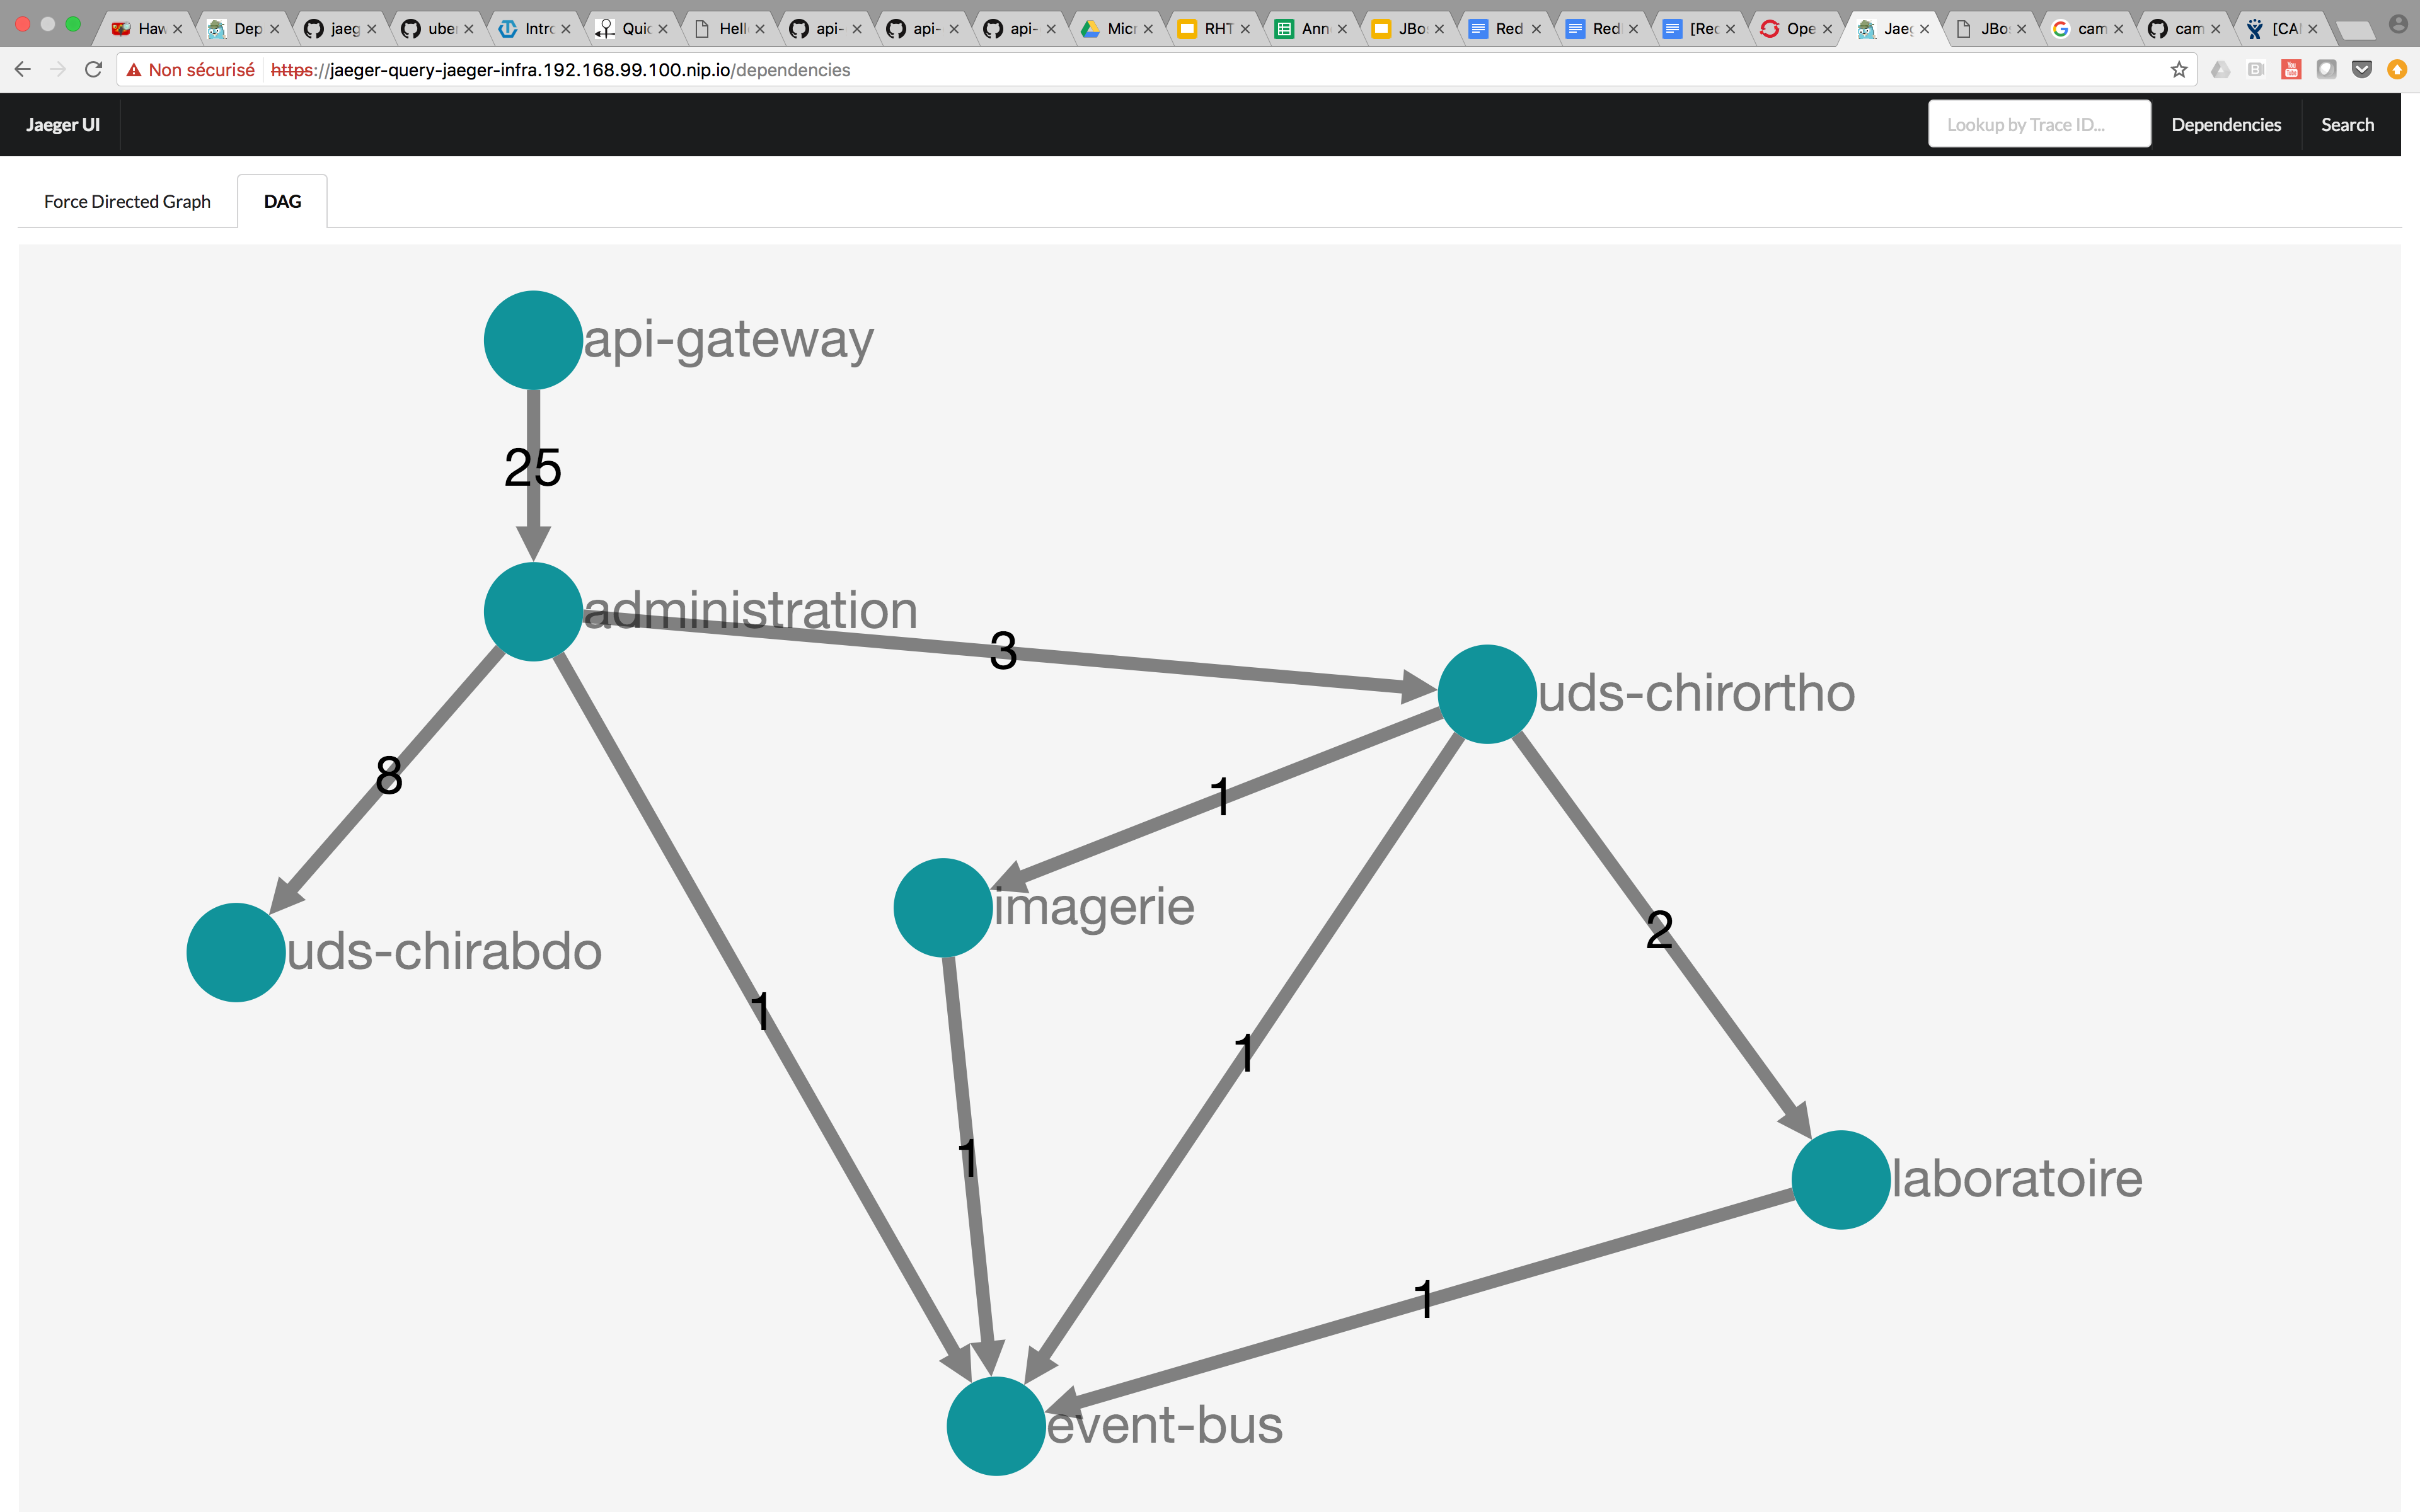
Anyways if you find yourself in this position, and need to get trace like data the checking logs <> querying Kubernetes is your best bet today. You can use these same techniques (with kubectl access) with a bit of practice, and I’m more than happy to help you get started. Happy tracing!
It’s all clean now :D
