- Intro to container orchestrators
- Docker Compose
- Docker Compose Use Case #1: Web server with Redis + Flask
- Docker compose Use Case #2: Monitoring system with Prometheus + NodeExporter
- Singularity Compose
- Kubernetes
Although you can certainly manage research workflows that use multiple containers manually, there are a number of container orchestration tools that you may find useful when managing workflows that use multiple containers. Also running containers in production is tough: what happens if the containers die? How do you scale across several machines? Container orchestration solves these problems.
The general idea behind containers orchestrators is that you have “managers” who receive expected state. This state might be “I want to run two instances of my web app and expose port 80.” The managers then look at all of the machines in the cluster and delegate work to “worker” nodes. The managers watch for changes (such as a container quitting) and then work to make actual state reflect the expected state.
In this lesson we briefly describe a few options and point to useful resources on using these tools to allow you to explore them yourself.
Docker Compose
Docker Compose provides a way of constructing a unified workflow (or service) made up of multiple individual Docker containers. In addition to the individual Dockerfiles for each container, you provide a higher-level configuration file which describes the different containers and how they link together along with shared storage definitions between the containers. Once this high-level configuration has been defined, you can use single commands to start and stop the orchestrated set of containers.
Kubernetes
Kubernetes is an open source framework that provides similar functionality to Docker Compose. Its particular strengths are that is platform independent and can be used with many different container technologies and that it is widely available on cloud platforms so once you have implemented your workflow in Kubernetes it can be deployed in different locations as required. It has become the de facto standard for container orchestration.
Singularity Compose
Singularity compose is intended to run a small number of container instances on your host. It is not a complicated orchestration tool like Kubernetes, but rather a controlled way to represent and manage a set of container instances, or services.
Docker Swarm
Docker Swarm provides a way to scale out to multiple copies of similar containers. This potentially allows you to parallelise and scale out your research workflow so that you can run multiple copies and increase throughput. This would allow you, for example, to take advantage of multiple cores on a local system or run your workflow in the cloud to access more resources. Docker Swarm uses the concept of a manager container and worker containers to implement this distribution.
Let's go into more detail for some of the most popular container orchestration tools.
Docker Compose is a Docker tool used to define and run multi-container applications. With Compose, you use a YAML file to configure your application’s services and create all the app’s services from that configuration.
Think of docker-compose as an automated multi-container workflow. Compose is an excellent tool for development, testing, CI workflows, and staging environments. According to the Docker documentation, the most popular features of Docker Compose are:
- Multiple isolated environments on a single host
- Preserve volume data when containers are created
- Only recreate containers that have changed
- Variables and moving a composition between environments
- Orchestrate multiple containers that work together
First, we need to understand how Compose files work. It’s actually simpler than it seems. In short, Docker Compose files work by applying mutiple commands that are declared within a single docker-compose.yml configuration file.
The basic structure of a Docker Compose YAML file looks like this:
version: 'X'

services:
  web:
    build: .
    ports:
     - "5000:5000"
    volumes:
     - .:/code
  redis:
    image: redis
Now, let’s look at real-world example of a Docker Compose file and break it down step-by-step to understand all of this better. Note that all the clauses and keywords in this example are commonly used keywords and industry standard.
With just these, you can start a development workflow. There are some more advanced keywords that you can use in production, but for now, let’s just get started with the necessary clauses.
version: '3'
services:
  web:
    # Path to dockerfile.
    # '.' represents the current directory in which
    # docker-compose.yml is present.
    build: .

    # Mapping of container port to host

    ports:
      - "5000:5000"
    # Mount volume
    volumes:
      - "/usercode/:/code"

    # Link database container to app container
    # for reachability.
    links:
      - "database:backenddb"

  database:

    # image to fetch from docker hub
    image: mysql/mysql-server:5.7

    # Environment variables for startup script
    # container will use these variables
    # to start the container with these define variables.
    environment:
      - "MYSQL_ROOT_PASSWORD=root"
      - "MYSQL_USER=testuser"
      - "MYSQL_PASSWORD=admin123"
      - "MYSQL_DATABASE=backend"
    # Mount init.sql file to automatically run
    # and create tables for us.
    # everything in docker-entrypoint-initdb.d folder
    # is executed as soon as container is up nd running.
    volumes:
      - "/usercode/db/init.sql:/docker-entrypoint-initdb.d/init.sql"
version ‘3’: This denotes that we are using version 3 of Docker Compose, and Docker will provide the appropriate features. At the time of writing this article, version 3.7 is latest version of Compose.services: This section defines all the different containers we will create. In our example, we have two services, web and database.web: This is the name of our Flask app service. Docker Compose will create containers with the name we provide.build: This specifies the location of our Dockerfile, and . represents the directory where the docker-compose.yml file is located.ports: This is used to map the container’s ports to the host machine.volumes: This is just like the -v option for mounting disks in Docker. In this example, we attach our code files directory to the containers’./codedirectory. This way, we won’t have to rebuild the images if changes are made.links: This will link one service to another. For the bridge network, we must specify which container should be accessible to which container using links.image: If we don’t have a Dockerfile and want to run a service using a pre-built image, we specify the image location using the image clause. Compose will fork a container from that image.environment: The clause allows us to set up an environment variable in the container. This is the same as the -e argument in Docker when running a container.
To deploy the services:
docker-compose up -d
To un-deploy the services:
docker-compose down
Docker Compose commands
Now that we know how to create a docker-compose file, let’s go over the most common Docker Compose commands that we can use with our files. Keep in mind that we will only be discussing the most frequently-used commands.
docker-compose: Every Compose command starts with this command. You can also use docker-compose --help to provide additional information about arguments and implementation details.
$ docker-compose --help
Define and run multi-container applications with Docker.
docker-compose build: This command builds images in the docker-compose.yml file. The job of the build command is to get the images ready to create containers, so if a service is using the prebuilt image, it will skip this service.
$ docker-compose build
database uses an image, skipping
Building web
Step 1/11 : FROM python:3.9-rc-buster
 ---> 2e0edf7d3a8a
Step 2/11 : RUN apt-get update && apt-get install -y docker.io
docker-compose images: This command will list the images you’ve built using the current docker-compose file.
$ docker-compose images
          Container                  Repository        Tag       Image Id       Size
--------------------------------------------------------------------------------------
7001788f31a9_docker_database_1   mysql/mysql-server   5.7      2a6c84ecfcb2   333.9 MB
docker_database_1                mysql/mysql-server   5.7      2a6c84ecfcb2   333.9 MB
docker_web_1                     <none>               <none>   d986d824dae4   953 MB
docker-compose stop: This command stops the running containers of specified services.
$ docker-compose stop
Stopping docker_web_1      ... done
Stopping docker_database_1 ... done
docker-compose run: This is similar to the docker run command. It will create containers from images built for the services mentioned in the compose file.
$ docker-compose run web
Starting 7001788f31a9_docker_database_1 ... done
 * Serving Flask app "app.py" (lazy loading)
 * Environment: development
 * Debug mode: on
 * Running on http://0.0.0.0:5000/ (Press CTRL+C to quit)
 * Restarting with stat
 * Debugger is active!
 * Debugger PIN: 116-917-688
docker-compose up: This command does the work of the docker-compose build and docker-compose run commands. It builds the images if they are not located locally and starts the containers. If images are already built, it will fork the container directly.
$ docker-compose up
Creating docker_database_1 ... done
Creating docker_web_1      ... done
Attaching to docker_database_1, docker_web_1
docker-compose ps: This command list all the containers in the current docker-compose file. They can then either be running or stopped.
$ docker-compose ps
      Name                 Command             State               Ports
---------------------------------------------------------------------------------
docker_database_1   /entrypoint.sh mysqld   Up (healthy)   3306/tcp, 33060/tcp
docker_web_1        flask run               Up             0.0.0.0:5000->5000/tcp

$ docker-compose ps
      Name                 Command          State    Ports
----------------------------------------------------------
docker_database_1   /entrypoint.sh mysqld   Exit 0
docker_web_1        flask run               Exit 0
docker-compose down: This command is similar to the docker system prune command. However, in Compose, it stops all the services and cleans up the containers, networks, and images.
$ docker-compose down
Removing docker_web_1      ... done
Removing docker_database_1 ... done
Removing network docker_default
(django-tuts) Venkateshs-MacBook-Air:Docker venkateshachintalwar$ docker-compose images
Container   Repository   Tag   Image Id   Size
----------------------------------------------
(django-tuts) Venkateshs-MacBook-Air:Docker venkateshachintalwar$ docker-compose ps
Name   Command   State   Ports
------------------------------
First, we are going to deploy a Web server with Flask and a Redis database:
Create a directory for the project:
mkdir composetest
cd composetest
Create a file called app.py in your project directory and paste this in:
    import time

    import redis
    from flask import Flask

    app = Flask(__name__)
    cache = redis.Redis(host='redis', port=6379)

    def get_hit_count():
        retries = 5
        while True:
            try:
                return cache.incr('hits')
            except redis.exceptions.ConnectionError as exc:
                if retries == 0:
                    raise exc
                retries -= 1
                time.sleep(0.5)

    @app.route('/')
    def hello():
        count = get_hit_count()
        return 'Hello World! I have been seen {} times.\n'.format(count)
In this example, redis is the hostname of the redis container on the application’s network. We use the default port for Redis, 6379.
Handling transient errors. Note the way the get_hit_count function is written. This basic retry loop lets us attempt our request multiple times if the redis service is not available. This is useful at startup while the application comes online, but also makes our application more resilient if the Redis service needs to be restarted anytime during the app’s lifetime. In a cluster, this also helps handling momentary connection drops between nodes.
Create another file called requirements.txt in your project directory and paste this in:
flask
redis
In this step, you write a Dockerfile that builds a Docker image. The image contains all the dependencies the Python application requires, including Python itself.
In your project directory, create a file named Dockerfile and paste the following:
# syntax=docker/dockerfile:1
FROM python:3.7-alpine
WORKDIR /code
ENV FLASK_APP=app.py
ENV FLASK_RUN_HOST=0.0.0.0
RUN apk add --no-cache gcc musl-dev linux-headers
COPY requirements.txt requirements.txt
RUN pip install -r requirements.txt
EXPOSE 5000
COPY . .
CMD ["flask", "run"]
This tells Docker to:
- Build an image starting with the Python 3.7 image.
- Set the working directory to /code.
- Set environment variables used by the flask command.
- Install gcc and other dependencies
- Copy requirements.txt and install the Python dependencies.
- Add metadata to the image to describe that the container is listening on port 5000
- Copy the current directory . in the project to the workdir . in the image.
- Set the default command for the container to flask run.
For more information on how to write Dockerfiles, see the Docker user guide and the Dockerfile reference.
Create a file called docker-compose.yml in your project directory and paste the following:
version: "3.9"
services:
  web:
    build: .
    ports:
      - "8000:5000"
  redis:
    image: "redis:alpine"
This Compose file defines two services: web and redis.
Web service
The web service uses an image that’s built from the Dockerfile in the current directory. It then binds the container and the host machine to the exposed port, 8000. This example service uses the default port for the Flask web server, 5000.
Redis service
The redis service uses a public Redis image pulled from the Docker Hub registry.
From your project directory, start up your application by running docker-compose up.
docker-compose up
Compose pulls a Redis image, builds an image for your code, and starts the services you defined. In this case, the code is statically copied into the image at build time.
Enter http://localhost:8000/ in a browser to see the application running.
If you’re using Docker natively on Linux, Docker Desktop for Mac, or Docker Desktop for Windows, then the web app should now be listening on port 8000 on your Docker daemon host. Point your web browser to http://localhost:8000 to find the Hello World message. If this doesn’t resolve, you can also try http://127.0.0.1:8000.
You should see a message in your browser saying:
Hello World! I have been seen 1 times.
Refresh the page.
The number should increment.
Hello World! I have been seen 2 times.
Switch to another terminal window, and type docker images to list local images.
Listing images at this point should include redis and composetest-web.
docker image ls
You can inspect images with docker inspect <tag or id>, check the logs with docker logs <tag or id> or even open a shell interactive session in both containers and check that they are listening to other IPs and bind to each other:
$ docker exec -it <id for the flask container> sh
/code # netstat -an
Active Internet connections (servers and established)
Proto Recv-Q Send-Q Local Address           Foreign Address         State
tcp        0      0 0.0.0.0:5000            0.0.0.0:*               LISTEN
tcp        0      0 127.0.0.11:40677        0.0.0.0:*               LISTEN
tcp        0      0 192.168.32.3:46608      192.168.32.2:6379       ESTABLISHED
udp        0      0 127.0.0.11:56331        0.0.0.0:*
Active UNIX domain sockets (servers and established)
Proto RefCnt Flags       Type       State         I-Node Path

$ docker exec -it <id for the redis container> sh
/data # netstat -an
Active Internet connections (servers and established)
Proto Recv-Q Send-Q Local Address           Foreign Address         State
tcp        0      0 0.0.0.0:6379            0.0.0.0:*               LISTEN
tcp        0      0 127.0.0.11:45659        0.0.0.0:*               LISTEN
tcp        0      0 192.168.32.2:6379       192.168.32.3:46608      ESTABLISHED
tcp        0      0 :::6379                 :::*                    LISTEN
udp        0      0 127.0.0.11:34763        0.0.0.0:*
Active UNIX domain sockets (servers and established)
Proto RefCnt Flags       Type       State         I-Node Path
Stop the application by hitting CTRL+C in the original terminal where you started the app and then remove the containers by running docker-compose down.
Edit docker-compose.yml in your project directory to add a bind mount for the web service:
version: "3.9"
services:
  web:
    build: .
    ports:
      - "8000:5000"
    volumes:
      - .:/code
    environment:
      FLASK_DEBUG: True
  redis:
    image: "redis:alpine"
The new volumes key mounts the project directory (current directory) on the host to /code inside the container, allowing you to modify the code on the fly, without having to rebuild the image. The environment key sets the FLASK_DEBUG environment variable, which tells flask to run in debug/development mode and reload the code on change. This mode should only be used in development.
From your project directory, type docker-compose up to build the app with the updated Compose file, and run it.
docker-compose up
Check the Hello World message in a web browser again, and refresh to see the count increment.
Shared folders, volumes, and bind mounts
If your project is outside of the Users directory (cd ~), then you need to share the drive or location of the Dockerfile and volume you are using. If you get runtime errors indicating an application file is not found, a volume mount is denied, or a service cannot start, try enabling file or drive sharing. Volume mounting requires shared drives for projects that live outside of C:\Users (Windows) or /Users (Mac), and is required for any project on Docker Desktop for Windows that uses Linux containers. For more information, see File sharing on Docker for Mac, and the general examples on how to Manage data in containers.
Because the application code is now mounted into the container using a volume, you can make changes to its code and see the changes instantly, without having to rebuild the image.
Change the greeting in app.py and save it. For example, change the Hello World! message to Hello from Docker!:
return 'Hello from Docker! I have been seen {} times.\n'.format(count)
Refresh the app in your browser. The greeting should be updated, and the counter should still be incrementing.
If you want to run your services in the background, you can pass the -d flag (for “detached” mode) to docker-compose up and use docker-compose ps to see what is currently running:
docker-compose up -d
docker-compose ps
The docker-compose run command allows you to run one-off commands for your services. For example, to see what environment variables are available to the web service:
docker-compose run web env
See docker-compose --help to see other available commands. You can also install command completion for the bash and zsh shell, which also shows you available commands.
If you started Compose with docker-compose up -d, stop your services once you’ve finished with them:
docker-compose stop
You can bring everything down, removing the containers entirely, with the down command. Pass --volumes to also remove the data volume used by the Redis container:
docker-compose down --volumes
We are going to deploy a Basic monitoring version that allows to serve Prometheus + NodeExporter.
Create a project/folder:
mkdir prometheus
cd prometheus
First, we are going to deploy a NodeExporter Service. NodeExporter exposes a wide variety of hardware- and kernel- related metrics of usage of our system.
Create a docker-compose.yml file
version: '3'

services:
  node-exporter:
    container_name: node1-exporter
    image: prom/node-exporter
    ports:
      - 9100:9100
Then, run:
docker-compose up -d
And open in your browser http://localhost:9100 to check that the service is running.
Once the Node Exporter is running, you can verify that metrics are being exported by going to http://localhost:9100/metrics or by cURLing the /metrics endpoint:
curl http://localhost:9100/metrics
You should see output like this:
# HELP go_gc_duration_seconds A summary of the GC invocation durations.
# TYPE go_gc_duration_seconds summary
go_gc_duration_seconds{quantile="0"} 3.8996e-05
go_gc_duration_seconds{quantile="0.25"} 4.5926e-05
go_gc_duration_seconds{quantile="0.5"} 5.846e-05
# etc.
Success! The Node Exporter is now exposing metrics that Prometheus can scrape, including a wide variety of system metrics further down in the output (prefixed with node_). To view those metrics (along with help and type information):
curl http://localhost:9100/metrics | grep "node_"
Then type:
docker-compose down
Second, to set up a Prometheus service, you need to create the following configuration .yml files in the same folder (prometheus).
Create a file prometheus.yml and include the following:
global:
  scrape_interval: 30s
  scrape_timeout: 10s

rule_files:
  - alert.yml

scrape_configs:
  - job_name: services
    metrics_path: /metrics
    static_configs:
      - targets:
          - 'prometheus:9090'
          - 'idonotexists:564'
Then create a alert.yml file
groups:
  - name: DemoAlerts
    rules:
      - alert: InstanceDown
        expr: up{job="services"} < 1
        for: 5m
Finally, add to the docker-compose.yml the following code for prometheus at the services level (prometheus service should be at the same level than node-exporter since they are both services and the last volumnes should be at the root level):
  prometheus:
    container_name: node-prom
    image: prom/prometheus:v2.30.3
    ports:
      - 9090:9090
    volumes:
      - .:/etc/prometheus
      - prometheus-data:/prometheus
    command: --web.enable-lifecycle  --config.file=/etc/prometheus/prometheus.yml

volumes:
  prometheus-data:
This is how the final docker-compose.yml file looks like:
version: '3'

services:

  node-exporter:
    container_name: node1-exporter
    image: prom/node-exporter
    ports:
      - 9100:9100

  prometheus:
    container_name: node-prom
    image: prom/prometheus:v2.30.3
    ports:
      - 9090:9090
    volumes:
      - .:/etc/prometheus
      - prometheus-data:/prometheus
    command: --web.enable-lifecycle  --config.file=/etc/prometheus/prometheus.yml

volumes:
  prometheus-data:
Then type the following:
docker-compose up -d
And open in your browser 2 tabs:
- http://localhost:9090 For Prometheus server
- http://localhost:9100 For Node Exporter
Check if all the services are running.
Now we are going to drop this service to add Grafana as a Prometheus stats visualizer.
docker-compose down
Add to the docker-compose.yml the following code for grafana at the services level:
  grafana:
    container_name: node-grafana
    image: grafana/grafana-oss
    ports:
      - 3000:3000
Then, run again:
docker-compose up -d
And open in your browser 3 tabs:
- http://localhost:9090 For Prometheus server
- http://localhost:9100 For Node Exporter
- http://localhost:3000 For Grafana
Check if all the services are running.
Grafana is an open-source platform for monitoring and observability that lets you visualize and explore the state of your systems. You can find Grafana Tutorials here. This tutorial will just cover the first steps to log into Grafana and create a query to plot some of the metrics forwared from Prometheus.
Browse to http://localhost:3000 and log in to Grafana (username: admin, password: admin). The first time you log in, you’re asked to change your password (you can skip this). Once into Grafana, the first thing you see is the Home dashboard, which helps you get started. To the far left you can see the sidebar, a set of quick access icons for navigating Grafana.
To be able to visualize the metrics from Prometheus, you first need to add it as a data source in Grafana. In the sidebar, hover your cursor over the Configuration (gear) icon, and then click Data sources. Click Add data source. In the list of data sources, click Prometheus.
In the URL box, enter http://prometheus:9090. Click Save & test.
Prometheus is now available as a data source in Grafana. Let's now add a query for a metric. In the sidebar, click the Explore (compass) icon. In the Query editor, click the Code tag to directly input the PromQL query. In the Enter a PromQL query field, enter go_memstats_alloc_bytes and then press Shift + Enter. A graph appears. We are ploting the Number of bytes allocated and still in use in our system.
In the top right corner, click the dropdown arrow on the Run Query button, and then select 5s. Grafana runs your query and updates the graph every 5 seconds.
You just made your first PromQL query! PromQL is a powerful query language that lets you select and aggregate time series data stored in Prometheus.
Singularity was conceived as a more secure option to run encapsulated environments. Unlike Docker, Singularity containers allows user to interact with processes in the foreground (e.g. running a script and exiting) and were not appropriate to run background services. This was a task for container instances (Singularity argot). A container instance equates to running a container in a detached or daemon mode. Instances allow for running persistent services in the background and then interaction with theses services from the host and other containers. To orchestrate and customize several of these Singularity instances, Singularity Compose came up (https://www.theoj.org/joss-papers/joss.01578/10.21105.joss.01578.pdf).
Singularity compose is intended to run a small number of container instances on your host. It is not a complicated orchestration tool like Kubernetes, but rather a controlled way to represent and manage a set of container instances, or services.
Dependencies
Singularity Compose must use a version of Singularity 3.2.1 or greater. It's recommended to use the latest (3.8.0 release at the time of this writing) otherwise there was a bug with some versions of 3.2.1. Singularity 2.x absolutely will not work. Python 3 is also required, as Python 2 is at end of life.
Install singularity-compose using pip3:
sudo apt-get install python3-pip
pip3 install singularity-compose
The obtained binaries for singularity-compose might be placed in a folder which is not in the $PATH, and you might get a warning message from the installation for this:
  WARNING: The script singularity-compose is installed in './home/vagrant/.local/bin/singularity-compose' which is not on PATH.
  Consider adding this directory to PATH or, if you prefer to suppress this warning, use --no-warn-script-location.
Either if you get the warning message or not, it is convenient to locate the binaries in your system and check that they are on $PATH or include them if not already in.
$ find . -name singularity-compose -print
/home/vagrant/.local/bin/singularity-compose
$ echo $PATH
/usr/local/sbin:/usr/local/bin:/usr/sbin:/usr/bin:/sbin:/bin:/usr/games:/usr/local/games:/snap/bin
$export PATH=$PATH:/home/vagrant/.local/bin
add the export command to your ~/.profile file to make this change in the $PATH persistent in the bash shell.
For a singularity-compose project, it's expected to have a singularity-compose.yml in the present working directory. You can look at a simple example here:
version: "1.0"
instances:
  app:
    build:
      context: ./app
    volumes:
      - ./nginx.conf:/etc/nginx/conf.d/default.conf
      - ./app:/code
      - ./static:/var/www/static
      - ./images:/var/www/images
    ports:
      - 80:80
If you are familiar with docker-compose the file should look very familiar. A key difference is that instead of "services" we have "instances." And you guessed correctly - each section there corresponds to a Singularity instance that will be created. In this guide, we will walk through each of the sections in detail. Instance folders
Generally, each section in the yaml file corresponds with a container instance to be run, and each container instance is matched to a folder in the present working directory. For example, if I give instruction to build an nginx instance from a nginx/Singularity.nginx file, I should have the following in my singularity-compose:
  nginx:
    build:
      context: ./nginx
      recipe: Singularity.nginx
The above says that I want to build a container and corresponding instance named nginx, and use the recipe Singularity.nginx in the context folder ./nginx in the present working directory. This gives me the following directory structure:
singularity-compose-example
├── nginx
...
│   ├── Singularity.nginx
│   └── uwsgi_params.par
└── singularity-compose.yml
Notice how I also have other dependency files for the nginx container in that folder. While the context for starting containers with Singularity compose is the directory location of the singularity-compose.yml, the build context for this container is inside the nginx folder. We will talk about the build command soon. First, as another option, you can just define a container to pull, and it will be pulled to the same folder that is created if it doesn't exist.
  nginx:
    image: docker://nginx
This will pull a container nginx.sif into a nginx context folder:
├── nginx                    (- created if it doesn't exist
│   └── nginx.sif            (- named according to the instance
└── singularity-compose.yml
It's less likely that you will be able to pull a container that is ready to go, as typically you will want to customize the startscript for the instance. Now that we understand the basic organization, let's bring up some instances.
Singularity compose uses Singularity on the backend, so anything that would require sudo (root) permissions for Singularity is also required for Singularity compose. This includes most networking commands (e.g., asking to allocate ports) and builds from recipe files. However, if you are using Singularity v3.3 or higher, you can take advantage of fakeroot to try and get around this. The snippet below shows how to add fakeroot as an option under a build section:
    build:
      context: ./nginx
      recipe: Singularity.nginx
      options:
       - fakeroot
For this quick start, we are going to use the singularity-compose-simple example. Singularity has a networking issue that currently doesn't allow communication between multiple containers (due to iptables and firewall issues) so for now the most we can do is show you one container. First, clone the repository:
$ git clone https://www.github.com/singularityhub/singularity-compose-simple
cd inside, and you'll see a singularity-compose.yml like we talked about.
$ cd singularity-compose-simple
$ ls
app  images  LICENSE  nginx.conf  README.md  singularity-compose.yml  static
Let's take a look at the singularity-compose.yml
version: "1.0"
instances:
  app:
    build:
      context: ./app
    volumes:
      - ./nginx.conf:/etc/nginx/conf.d/default.conf
      - ./app/nginx/uwsgi_params.par:/etc/nginx/uwsgi_params.par
      - ./app/nginx/cache:/var/cache/nginx
      - ./app/nginx/run:/var/run
      - ./app:/code
      - ./static:/var/www/static
      - ./images:/var/www/images
    ports:
      - 80:80
...
It defines a single service, app, which has both a Django application and a nginx server with the nginx-upload module enabled. It tells us right away that the folder app is the context folder, and inside we can see dependency files for nginx and django.
$ ls app/
manage.py  nginx  requirements.txt  run_uwsgi.sh  Singularity  upload...
What we don't see is a container. We need to build that from the Singularity recipe. Let's do that.
$ singularity-compose build
Will generate an app.sif in the folder:
$ ls app/

app.sif manage.py  nginx  requirements.txt  run_uwsgi.sh  Singularity  upload...
And now we can bring up our instance!
$ singularity-compose up
Verify it's running:
$ singularity-compose ps
INSTANCES  NAME PID     IMAGE
1           app    20023    app.sif
And then look at logs, shell inside, or execute a command.
$ singularity-compose logs app
$ singularity-compose logs app --tail 30
$ singularity-compose shell app
$ singularity-compose exec app uname -a
When you open your browser to http://127.0.0.1 you should see the upload interface.
img/upload.png
If you drop a file in the box (or click to select) we will use the nginx-upload module to send it directly to the server. Cool!
img/content.png
This is just a simple Django application, the database is sqlite3, and it's now appeared in the app folder:
$ ls app/
app.sif  db.sqlite3  manage.py  nginx  requirements.txt  run_uwsgi.sh  Singularity  upload  uwsgi.ini
The images that you upload are stored in images at the root:
$ ls images/
2018-02-20-172617.jpg  40-acos.png  _upload
And static files are in static.
$ ls static/
admin  css  js
Finally, the volumes that we specified in the singularity-compose.yml tell us exactly where nginx and the application need permission to write. The present working directory (where the database is written) is bound to the container at /code, and nginx dependencies are bound to locations in /etc/nginx. Notice how the local static and images folder are bound to locations in the container where we normally wouldn't have writen.
    volumes:
      - ./nginx.conf:/etc/nginx/conf.d/default.conf
      - ./app/nginx/uwsgi_params.par:/etc/nginx/uwsgi_params.par
      - ./app/nginx/cache:/var/cache/nginx
      - ./app/nginx/run:/var/run
      - ./app:/code
      - ./static:/var/www/static
      - ./images:/var/www/images
This is likely a prime different between Singularity and Docker compose - Docker doesn't need binds for write, but rather to reduce isolation. When you develop an application, a lot of your debug will come down to figuring out where the services need to access (to write logs and similar files), which you might not have been aware of when using Docker.
When you bring the container up, you'll see generation of an etc.hosts file, and if you guessed it, this is indeed bound to /etc/hosts in the container.
Let's take a look:
10.22.0.2    app
127.0.0.1    localhost

# The following lines are desirable for IPv6 capable hosts
::1     ip6-localhost ip6-loopback
fe00::0 ip6-localnet
ff00::0 ip6-mcastprefix
ff02::1 ip6-allnodes
ff02::2 ip6-allrouters
This file will give each container that you create (in our case, just one) a name on its local network. Singularity by default creates a bridge for instance containers, which you can conceptually think of as a router. This means that, if I were to reference the hostname "app" in a second container, it would resolve to 10.22.0.2. Singularity compose does this by generating these addresses before creating the instances, and then assigning them to it. If you would like to see the full commands that are generated, run the up with --debug (binds and full paths have been removed to make this easier to read).
$ singularity instance start \
    --bind /home/vanessa/Documents/Dropbox/Code/singularity/singularity-compose-simple/etc.hosts:/etc/hosts \
    --net --network-args "portmap=80:80/tcp" --network-args "IP=10.22.0.2" \
    --hostname app \
    --writable-tmpfs app.sif app
Control and customization of these instances is probably the coolest (and not widely used) feature of Singularity. You can create your own network configurations, and customie the arguments to the command. Read here for more examples of use of singularity-compose.
Kubernetes is an open source platform for managing containerized workloads and services. Originally developed at Google and open-sourced in 2014, Kubernetes has a large, rapidly growing ecosystem. Its main capabilities are listed here.
There is an EdX course on Kubernetes running right now. Check it out here: (https://learning.edx.org/course/course-v1:LinuxFoundationX+LFS158x+1T2022/home)
At a very high level, Kubernetes is a cluster of compute systems categorized by their distinct roles:
- One or more control plane nodes
- One or more worker nodes
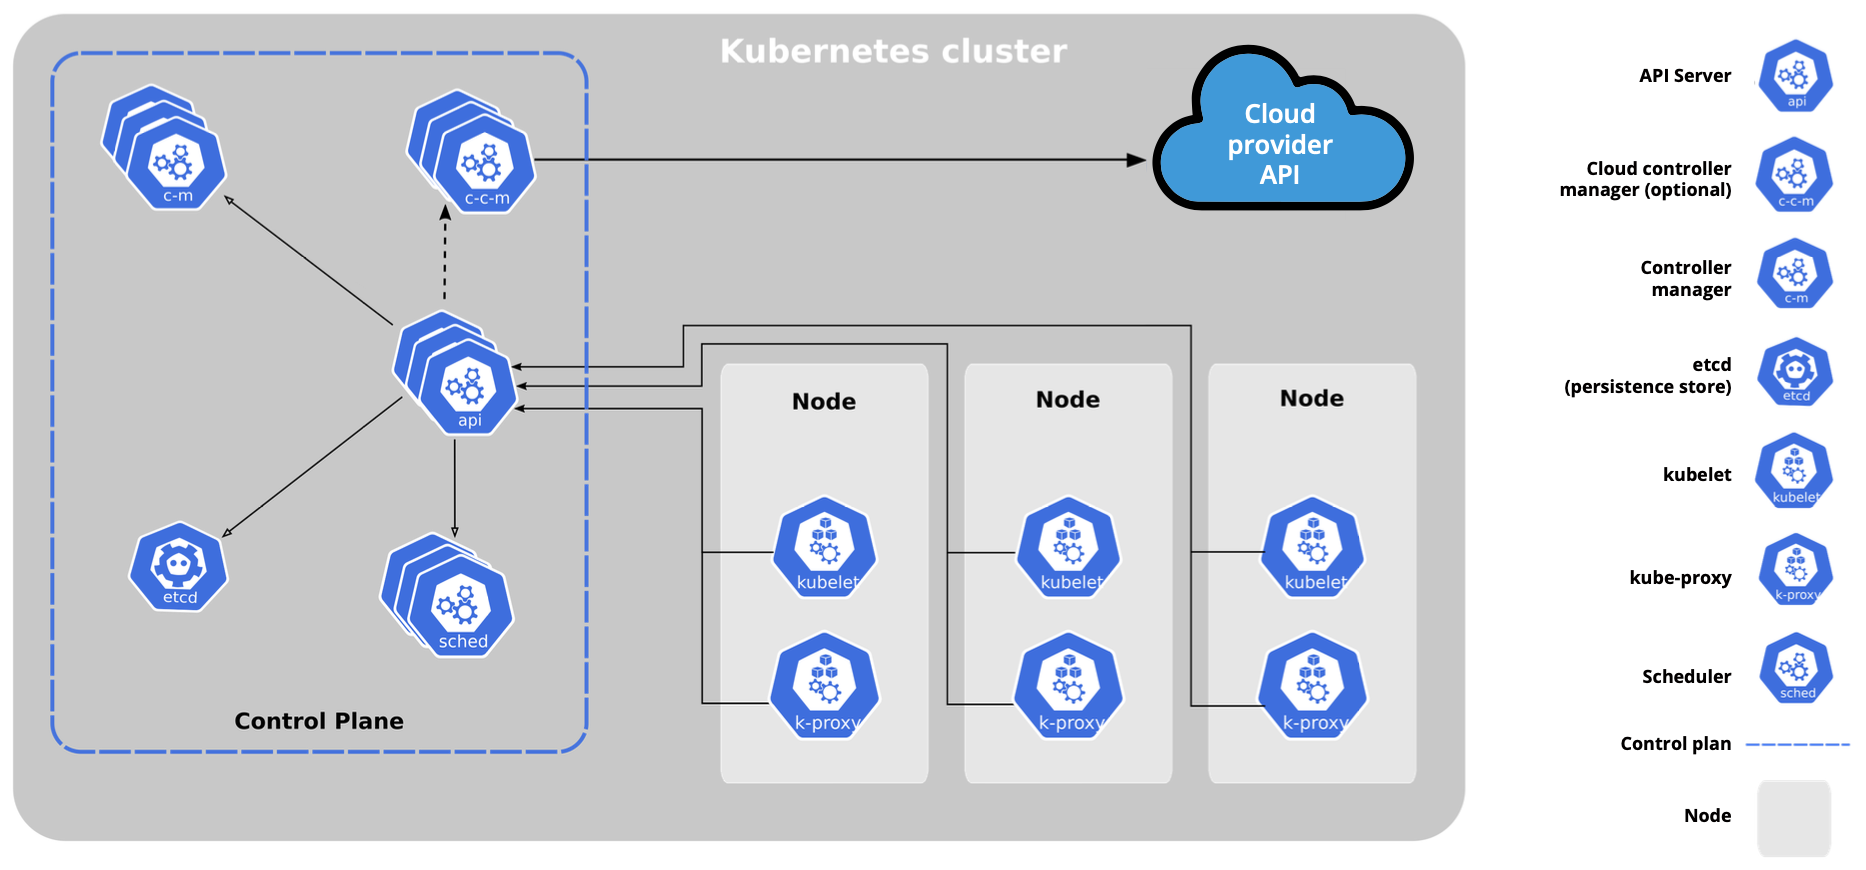
The control plane node provides a running environment for the control plane agents responsible for managing the state of a Kubernetes cluster, and it is the brain behind all operations inside the cluster. It is important to keep the control plane running at all costs. Losing the control plane may introduce downtime, causing service disruption to clients, with possible loss of business. To ensure the control plane's fault tolerance, control plane node replicas can be added to the cluster, configured in High-Availability (HA) mode.
-
To persist the Kubernetes cluster's state, all cluster configuration data is saved to a distributed key-value store which only holds cluster state related data, no client workload generated data. This key-value store is implemented with etcd (open-source). New data is written to the data store only by appending to it, data is never replaced in the data store. Obsolete data is compacted (or shredded) periodically to minimize the size of the data store. Out of all the control plane components, only the API Server is able to communicate with the etcd data store.
-
All the administrative tasks are coordinated by the kube-apiserver, a central control plane component running on the control plane node. The API Server intercepts RESTful calls from users, administrators, developers, operators and external agents, then validates and processes them. During processing the API Server reads the Kubernetes cluster's current state from the key-value store, and after a call's execution, the resulting state of the Kubernetes cluster is saved in the key-value store for persistence. The API Server is the only control plane component to talk to the key-value store, both to read from and to save Kubernetes cluster state information - acting as a middle interface for any other control plane agent inquiring about the cluster's state.
-
The role of the kube-scheduler is to assign new workload objects, such as pods encapsulating containers, to nodes - typically worker nodes. The scheduler obtains from the key-value store, via the API Server, resource usage data for each worker node in the cluster. The scheduler also receives from the API Server the new workload object's requirements which are part of its configuration data. Once all the cluster data is available, the scheduling algorithm filters the nodes with predicates to isolate the possible node candidates which then are scored with priorities in order to select the one node that satisfies all the requirements for hosting the new workload. The outcome of the decision process is communicated back to the API Server, which then delegates the workload deployment with other control plane agents.
-
The controller managers are components of the control plane node running controllers or operator processes to regulate the state of the Kubernetes cluster. Controllers are watch-loop processes continuously running and comparing the cluster's desired state (provided by objects' configuration data) with its current state (obtained from the key-value store via the API Server). In case of a mismatch, corrective action is taken in the cluster until its current state matches the desired state.
A worker node provides a running environment for client applications. These applications are microservices running as application containers. In Kubernetes the application containers are encapsulated in Pods, controlled by the cluster control plane agents running on the control plane node. Pods are scheduled on worker nodes, where they find required compute, memory and storage resources to run, and networking to talk to each other and the outside world. A Pod is the smallest scheduling work unit in Kubernetes. It is a logical collection of one or more containers scheduled together, and the collection can be started, stopped, or rescheduled as a single unit of work.
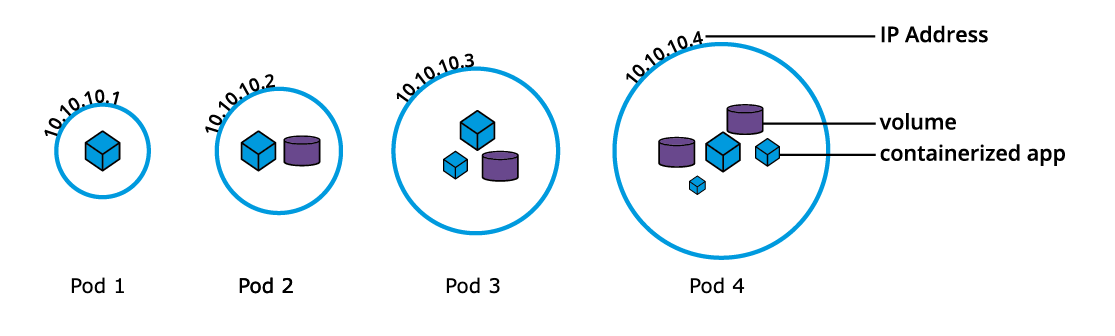
Although Kubernetes is described as a "container orchestration engine", it lacks the capability to directly handle and run containers. In order to manage a container's lifecycle, Kubernetes requires a container runtime on the node where a Pod and its containers are to be scheduled. Runtimes are required on all nodes of a Kubernetes cluster, both control plane and worker. Docker Engine can be used as container runtime.
Minikube is one of the easiest, most flexible and popular methods to run an all-in-one or a multi-node local Kubernetes cluster directly on our local workstations. It installs and runs on any native OS such as Linux, macOS, or Windows. However, in order to fully take advantage of all the features Minikube has to offer, a Type-2 Hypervisor or a Container Runtime (for example, Docker Engine) should be installed on the local workstation, to run in conjunction with Minikube.
For Minikube installation and getting started with this tool, we are going to follow the official Get Started with Minikube tutorial with more steps and info from the LinuxFoundationX LFS158x EdX Course on Introduction to Kubernetes
Choose your OS and Arquitecture and Install Minikube: (https://minikube.sigs.k8s.io/docs/start/)
Start your cluster minikube start
$ minikube start
😄  minikube v1.29.0 en Darwin 12.6
✨  Controlador docker seleccionado automáticamente. Otras opciones: virtualbox, ssh
📌  Using Docker Desktop driver with root privileges
👍  Starting control plane node minikube in cluster minikube
🚜  Pulling base image ...
💾  Descargando Kubernetes v1.26.1 ...
    > preloaded-images-k8s-v18-v1...:  397.05 MiB / 397.05 MiB  100.00% 24.35 M
    > gcr.io/k8s-minikube/kicbase...:  407.19 MiB / 407.19 MiB  100.00% 9.70 Mi
🔥  Creando docker container (CPUs=2, Memory=7810MB) ...
🐳  Preparando Kubernetes v1.26.1 en Docker 20.10.23...
    ▪ Generando certificados y llaves
    ▪ Iniciando plano de control
    ▪ Configurando reglas RBAC...
🔗  Configurando CNI bridge CNI ...
    ▪ Using image gcr.io/k8s-minikube/storage-provisioner:v5
🔎  Verifying Kubernetes components...
🌟  Complementos habilitados: default-storageclass, storage-provisioner
🏄  Done! kubectl is now configured to use "minikube" cluster and "default" namespace by default

$ minikube status
minikube
type: Control Plane
host: Running
kubelet: Running
apiserver: Running
kubeconfig: Configured
The minikube profile command allows us to view the status of all our clusters in a table formatted output. Assuming we have created only the default minikube cluster, we could list the properties that define the default profile with:
$ minikube profile list
|----------|-----------|---------|--------------|------|---------|---------|-------|--------|
| Profile  | VM Driver | Runtime |      IP      | Port | Version | Status  | Nodes | Active |
|----------|-----------|---------|--------------|------|---------|---------|-------|--------|
| minikube | docker    | docker  | 192.168.49.2 | 8443 | v1.26.1 | Running |     1 | *      |
|----------|-----------|---------|--------------|------|---------|---------|-------|--------|
This table presents the columns associated with the default properties such as the profile name: minikube, the isolation driver: docker, the container runtime: docker, the Kubernetes version: v1.26.1, the status of the cluster - running or stopped. The table also displays the number of nodes: 1 by default, the private IP address of the minikube cluster's control plane, and the secure port that exposes the API Server to cluster control plane components, agents and clients: 8443. If we had several different clusters, they would be listed here.
To stop the minikube cluster, run:
$ minikube stop
✋  Stopping node "minikube"  ...
🛑  Apagando "minikube" mediante SSH...
🛑  1 node stopped.
Any healthy running Kubernetes cluster can be accessed via any one of the following methods:
- Command Line Interface (CLI) tools and scripts with
kubectl-- this is the preferred method for our tutorials - Web-based User Interface (Web UI) from a web browser with Kubernetes Dashboard
- APIs from CLI or programmatically These methods are applicable to all Kubernetes clusters.
You can run a Pod in two ways:
- Creating a yaml file with the definition of the pod. This is a sample .yaml file named nginx.yaml to define an nginx service:
apiVersion: v1
kind: Pod
metadata:
  name: nginx
spec:
  containers:
  - name: nginx
    image: nginx:latest
    ports:
    - containerPort: 80
After editing this file, you can run the Pod with:
$ kubectl apply -f nginx.yaml
pod/nginx created
Check the list of created pods with:
$ kubectl get pods
NAME                              READY   STATUS    RESTARTS      AGE
nginx                             1/1     Running   0             15s
$ kubectl get pods -o wide
NAME                              READY   STATUS    RESTARTS      AGE     IP            NODE       NOMINATED NODE   READINESS GATES
nginx                             1/1     Running   0             20s     10.244.0.10   minikube   <none>           <none>
- Directly pulling the image from a repository and running it with
run. For example, this command will pull the latest nginx and run it as a service in a pod calledmyfirstpod:
$ kubectl run myfirstpod --image=nginx
pod/myfirstpod created
$ kubectl get pods -o wide
NAME                              READY   STATUS    RESTARTS      AGE     IP            NODE       NOMINATED NODE   READINESS GATES
myfirstpod                        1/1     Running   0             16s     10.244.0.11   minikube   <none>           <none>
nginx                             1/1     Running   0             3m50s   10.244.0.10   minikube   <none>           <none>
To deploy an application that runs a service with Pods we need to create a Deployment and a Service.
-
A Deployment provides declarative updates for Pods and ReplicaSets. You describe a desired state in a Deployment, and the Deployment Controller changes the actual state to the desired state at a controlled rate. You can define Deployments to create new ReplicaSets, or to remove existing Deployments and adopt all their resources with new Deployments. More information here: (https://kubernetes.io/docs/concepts/workloads/controllers/deployment/)
-
A Service is a method for exposing a network application that is running as one or more Pods in your cluster. A key aim of Services in Kubernetes is that you don't need to modify your existing application to make it available on the network -- you can run code in Pods, whether this is a code designed for a cloud-native world, or an older app you've containerized, and you use a Service to make that set of Pods available on the network so that clients can interact with it. If you use a Deployment to run your app, that Deployment can create and destroy Pods dynamically. From one moment to the next, you don't know how many of those Pods are working and healthy; you might not even know what those healthy Pods are named. Kubernetes Pods are created and destroyed to match the desired state of your cluster. Pods are emphemeral resources (you should not expect that an individual Pod is reliable and durable) and each Pod gets its own IP address (Kubernetes expects network plugins to ensure this). For a given Deployment in your cluster, the set of Pods running in one moment in time could be different from the set of Pods running that application a moment later. A Service is an abstraction to help you expose groups of Pods over a network. Each Service object defines a logical set of endpoints (usually these endpoints are Pods) along with a policy about how to make those pods accessible. (https://kubernetes.io/docs/concepts/services-networking/service/)
To create a deployment, we need to first define a Deployment controller in a .yaml definition manifest file. This is the .yaml file (named webserver.yaml) for a deployment controller for a simple web services in nginx with 3 replicas:
apiVersion: apps/v1
kind: Deployment
metadata:
  name: webserver
  labels:
    app: nginx
spec:
  replicas: 3
  selector:
    matchLabels:
      app: nginx
  template:
    metadata:
      labels:
        app: nginx
    spec:
      containers:
      - name: nginx
        image: nginx:alpine
        ports:
        - containerPort: 80
We can run this deployment with:
$ kubectl create -f webserver.yaml
deployment.apps/webserver created
And check the pods created and number of replicas:
$ kubectl get pods
NAME                              READY   STATUS    RESTARTS      AGE
webserver-774f96d4d9-k9k22        1/1     Running   0             23s
webserver-774f96d4d9-sblxp        1/1     Running   0             23s
webserver-774f96d4d9-vzgfd        1/1     Running   0             23s
$ kubectl get replicaset
NAME                        DESIRED   CURRENT   READY   AGE
webserver-774f96d4d9        3         3         3       81s
As an alternative to the .yaml definition file, we could also have created the webserver application by pulling the image direct with this command:
$ kubectl create deployment webserver --image=nginx:alpine --replicas=3 --port=80
Once the deployment is created, we need to create the Service. Create a webserver-svc.yamlfile with the following content:
apiVersion: v1
kind: Service
metadata:
  name: web-service
  labels:
    app: nginx
spec:
  type: NodePort
  ports:
  - port: 80
    protocol: TCP
  selector:
    app: nginx
Create the service with:
$ kubectl create -f webserver-svc.yaml

service/web-service created
Now list the services created:
$ kubectl get services

NAME          TYPE        CLUSTER-IP     EXTERNAL-IP   PORT(S)        AGE
kubernetes    ClusterIP   10.96.0.1      <none>        443/TCP        1d
web-service   NodePort    10.110.47.84   <none>        80:31074/TCP   22s
Our web-service is now created and its ClusterIP is 10.110.47.84. In the PORT(S)section, we see a mapping of 80:31074, which means that we have reserved a static port 31074 on the node. If we connect to the node on that port, our requests will be proxied to the ClusterIP on port 80.
To get more details about the Service, we can use the kubectl describe command, as in the following example:
$ kubectl describe service web-service
Name:                     web-service
Namespace:                default
Labels:                   app=nginx
Annotations:              <none>
Selector:                 app=nginx
Type:                     NodePort
IP:                       10.110.47.84
Port:                     <unset>  80/TCP
TargetPort:               80/TCP
NodePort:                 <unset>  31074/TCP
Endpoints:                172.17.0.4:80,172.17.0.5:80,172.17.0.6:80
Session Affinity:         None
External Traffic Policy:  Cluster
Events:                   <none>
Our application is running on the Minikube node. To access the application from our workstation, let's first get the IP address of the Minikube machine:
$ minikube ip

192.168.99.100
Now, open the browser and access the application on 192.168.99.100 at port 31074 to check the Welcome to nginx! message. If you see the message you have successfully completed the configuration of an nginx web service with 3 replicas.
After you have set up the webserver service, you will have 3 replicas of your nginx server running:
$ kubectl get pods
NAME                              READY   STATUS    RESTARTS       AGE
webserver-774f96d4d9-k9k22        1/1     Running   0              45m
webserver-774f96d4d9-sblxp        1/1     Running   0              46m
webserver-774f96d4d9-vzgfd        1/1     Running   0              46m
What if one of your replicas fails? Lets kill one of them with kubectl delete pod
$ kubectl delete pod webserver-774f96d4d9-k9k22
pod "webserver-774f96d4d9-k9k22" deleted
What now? Check the status again and... you guess!
$ kubectl get pods
NAME                              READY   STATUS    RESTARTS       AGE
webserver-774f96d4d9-dl2bm        1/1     Running   0              3s
webserver-774f96d4d9-sblxp        1/1     Running   0              46m
webserver-774f96d4d9-vzgfd        1/1     Running   0              46m
If you remember the description of the Kubernetes Arquitecture, the Controller Manager in the Control Plane is continuously monitoring the Kubernetes cluster and realized that the cluster's desired state (3 replicas of the nginx server) was not the same as the current state (2 replicas), requesting a corrective action to be taken by the API Server. The API Server then forwarded the corresponding request to the Scheduler for a new worker node to match the desired state again.
After completing this first tutorial, you can proceed with the minikube HandBook tutorials and the contributed end-to-end tutorials