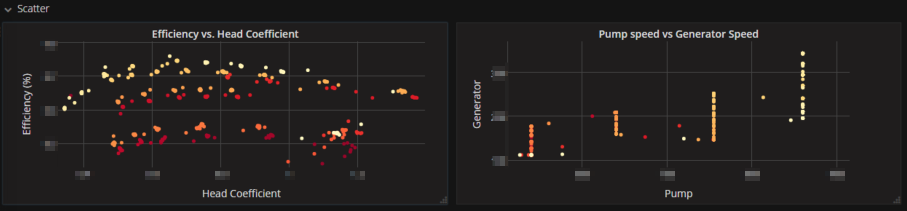
Render metrics using the plot.ly javascript framework
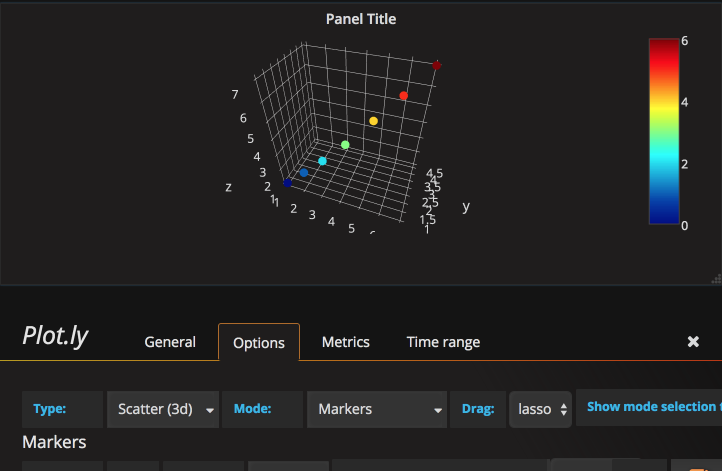
This is the first working version with some config but still needs a lot of work to to feel ready for prime time. In particular it currently assumes the first three values it gets are x, y, anx z. They must all be the same size and we assume they are on the same point.
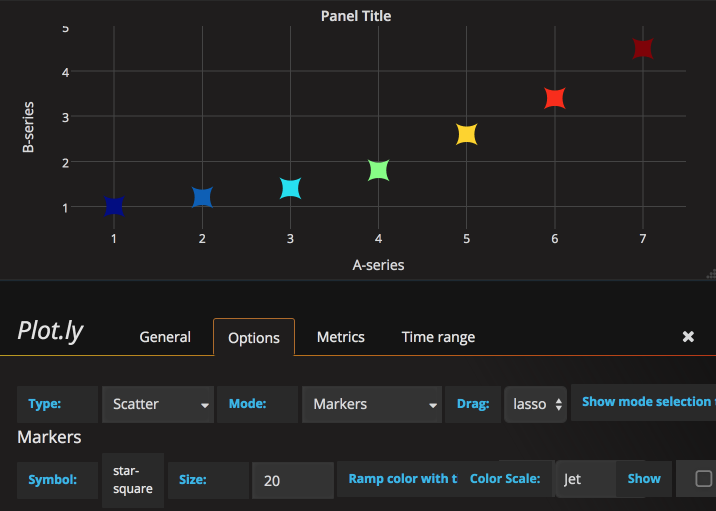
- Added ability to set color from a metric query. (#4, @lzgrablic01)
- Show 3D axis names properly
- First working version
Right now, the metric order maps directly to their usage. We should change things so that we explicily map the metric values to:
- x
- y
- z
- color ramp
- text
Other issues
- Better metric resolution
- Support plotly timeseries
- load plotly.js from CDN?