Using the Chart Group feature of Devtron, you can group and deploy one or more Helm charts in a single click.
-
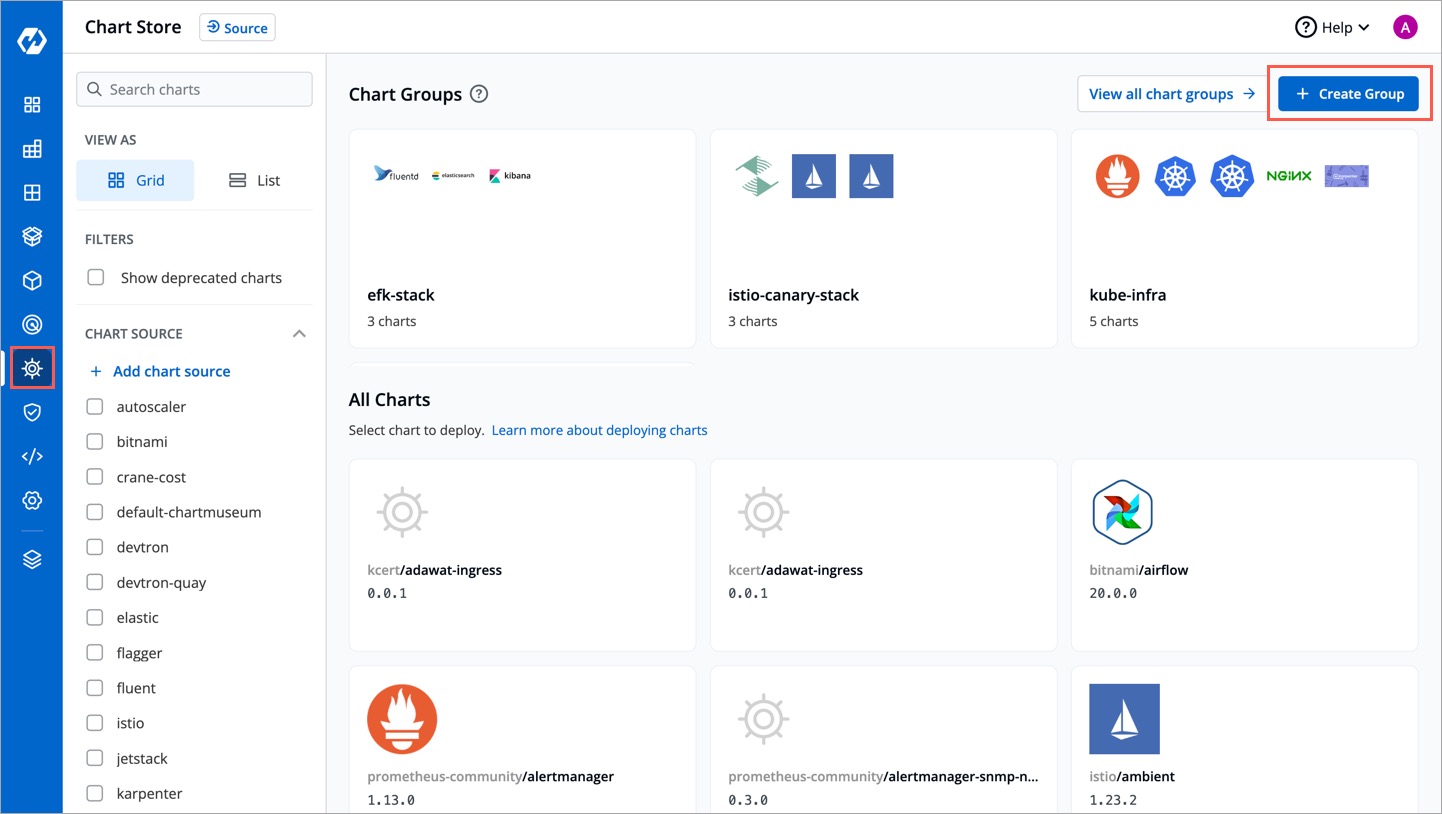
Go to the Chart Store page and click + Create Group.
-
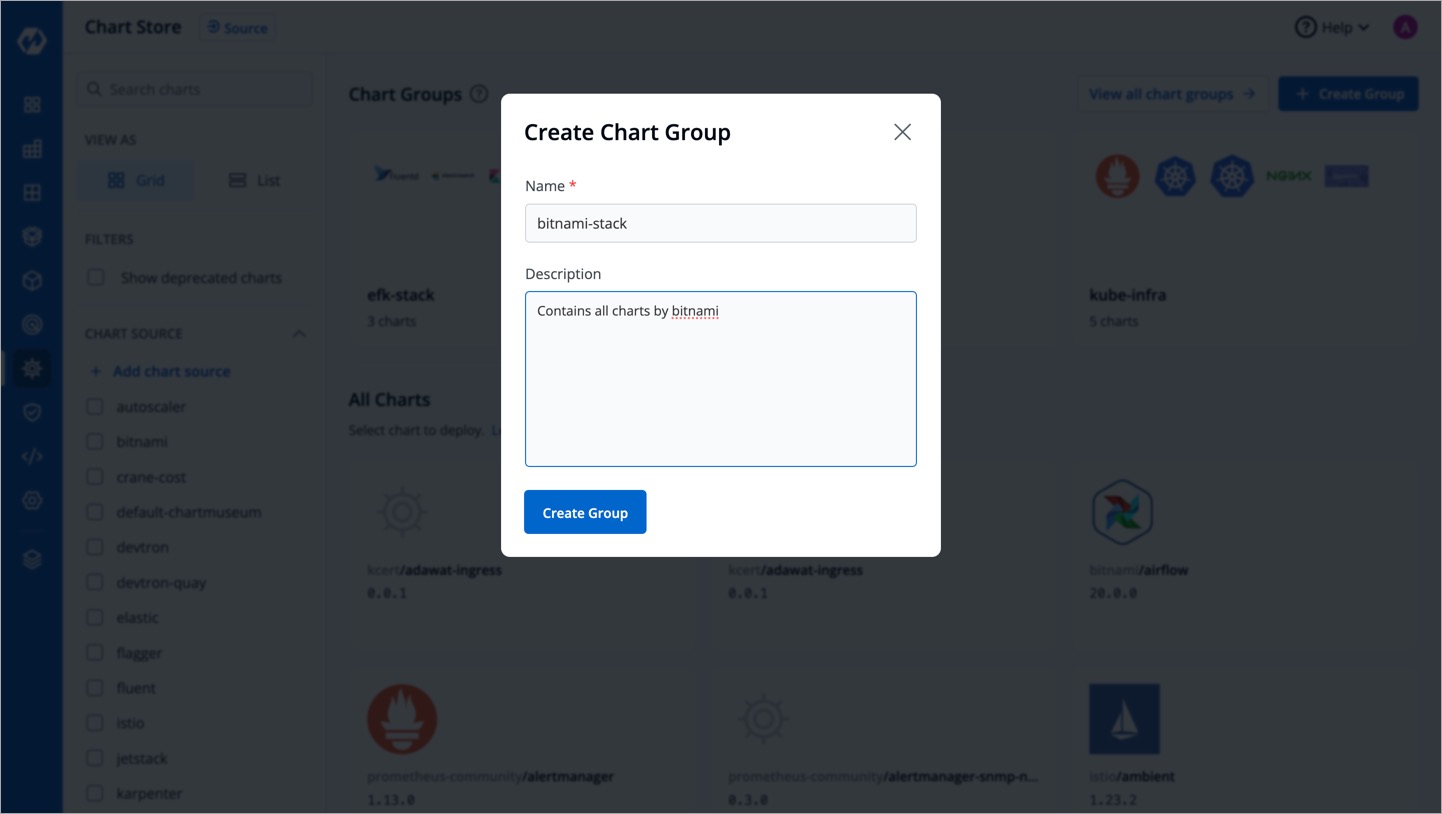
In the Create Chart Group window, give a name and description (optional) to your chart group, and then click Create Group.
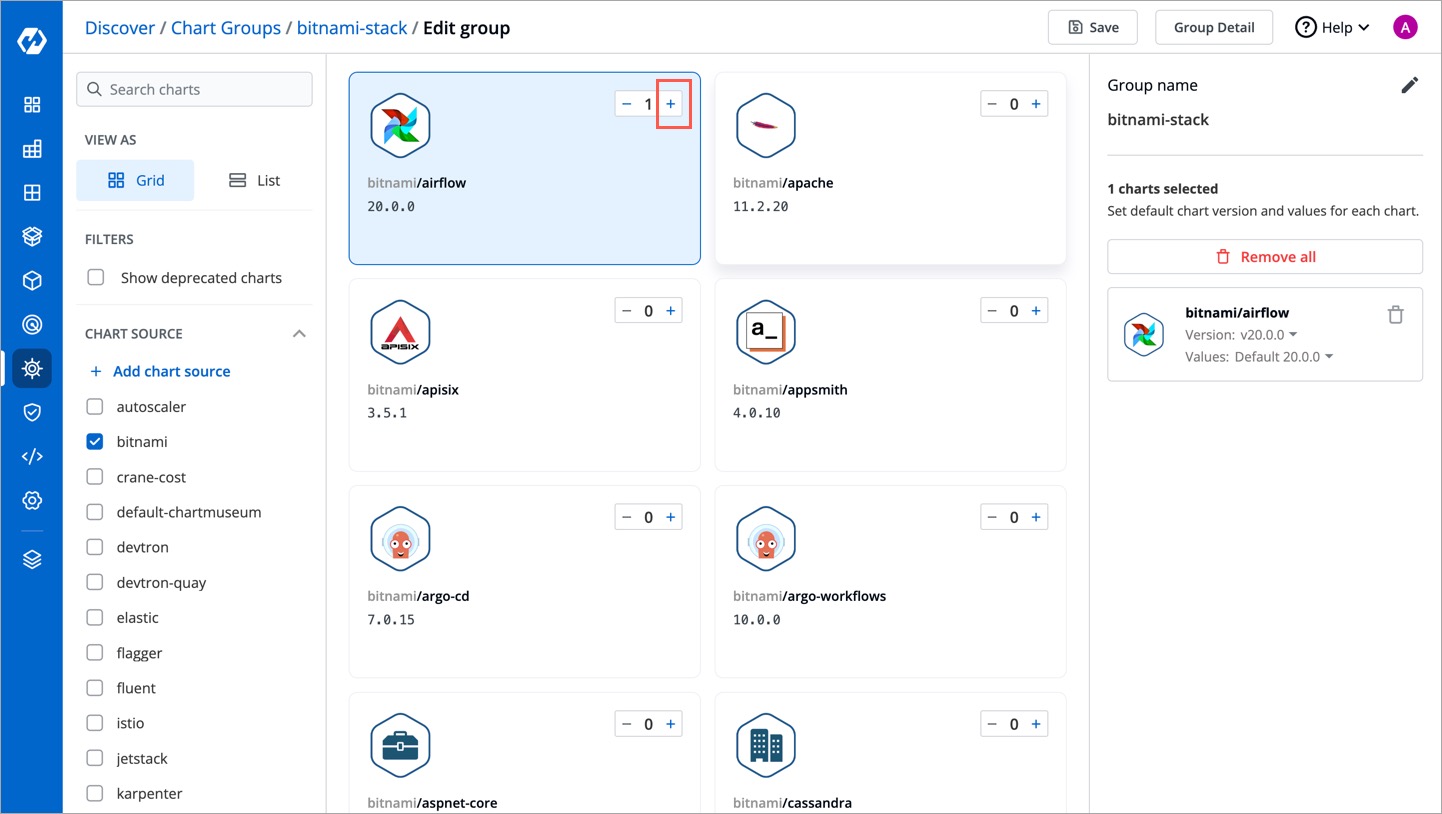
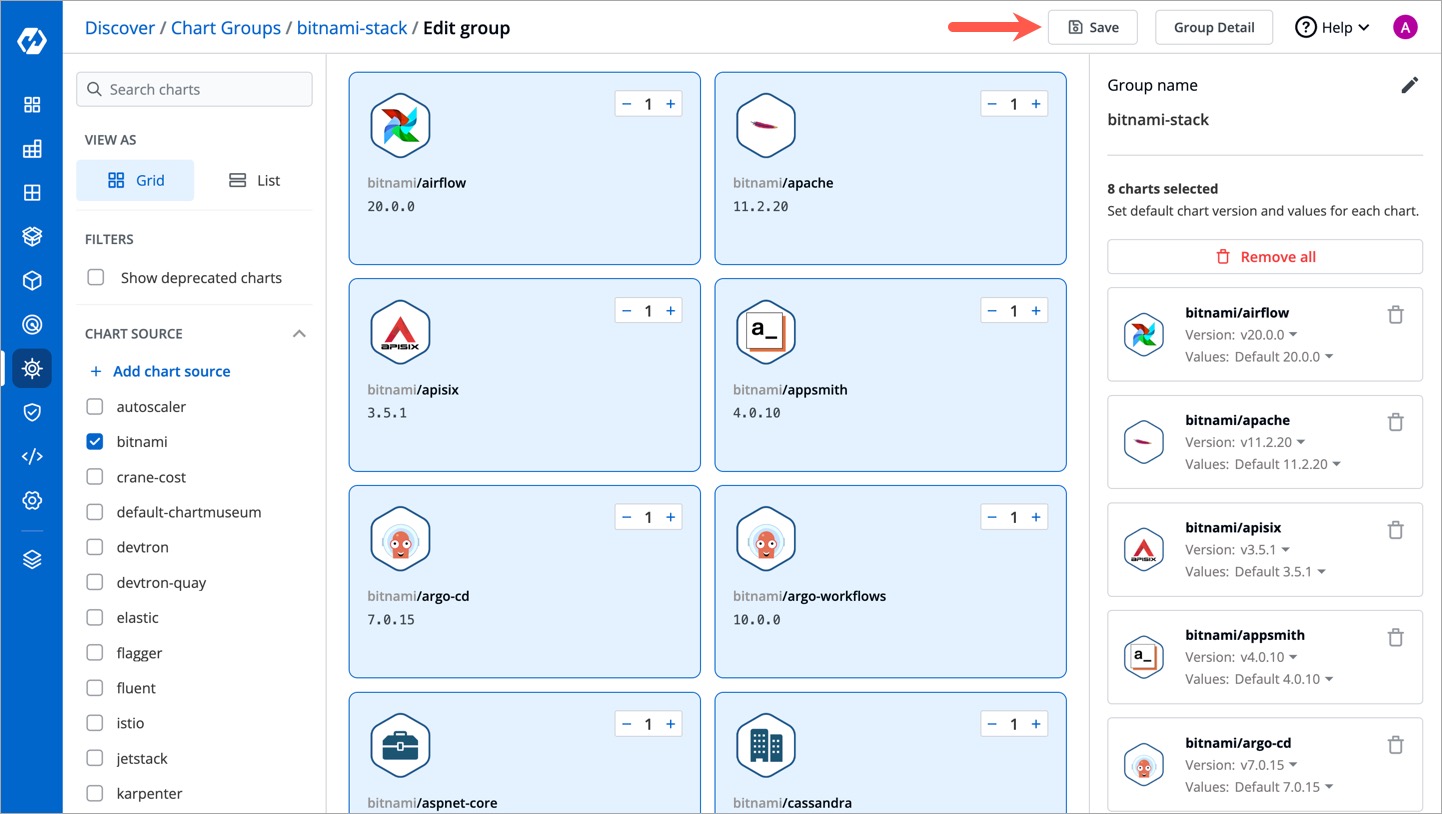
Once you create a group, you can now select and add charts to it.
-
To add a chart to the group, click the
+sign next to the chart you wish to add. You also can add multiple copies of the same chart in the chart group as per your requirements. -
Once you have finalized the charts for your group, click Save.
-
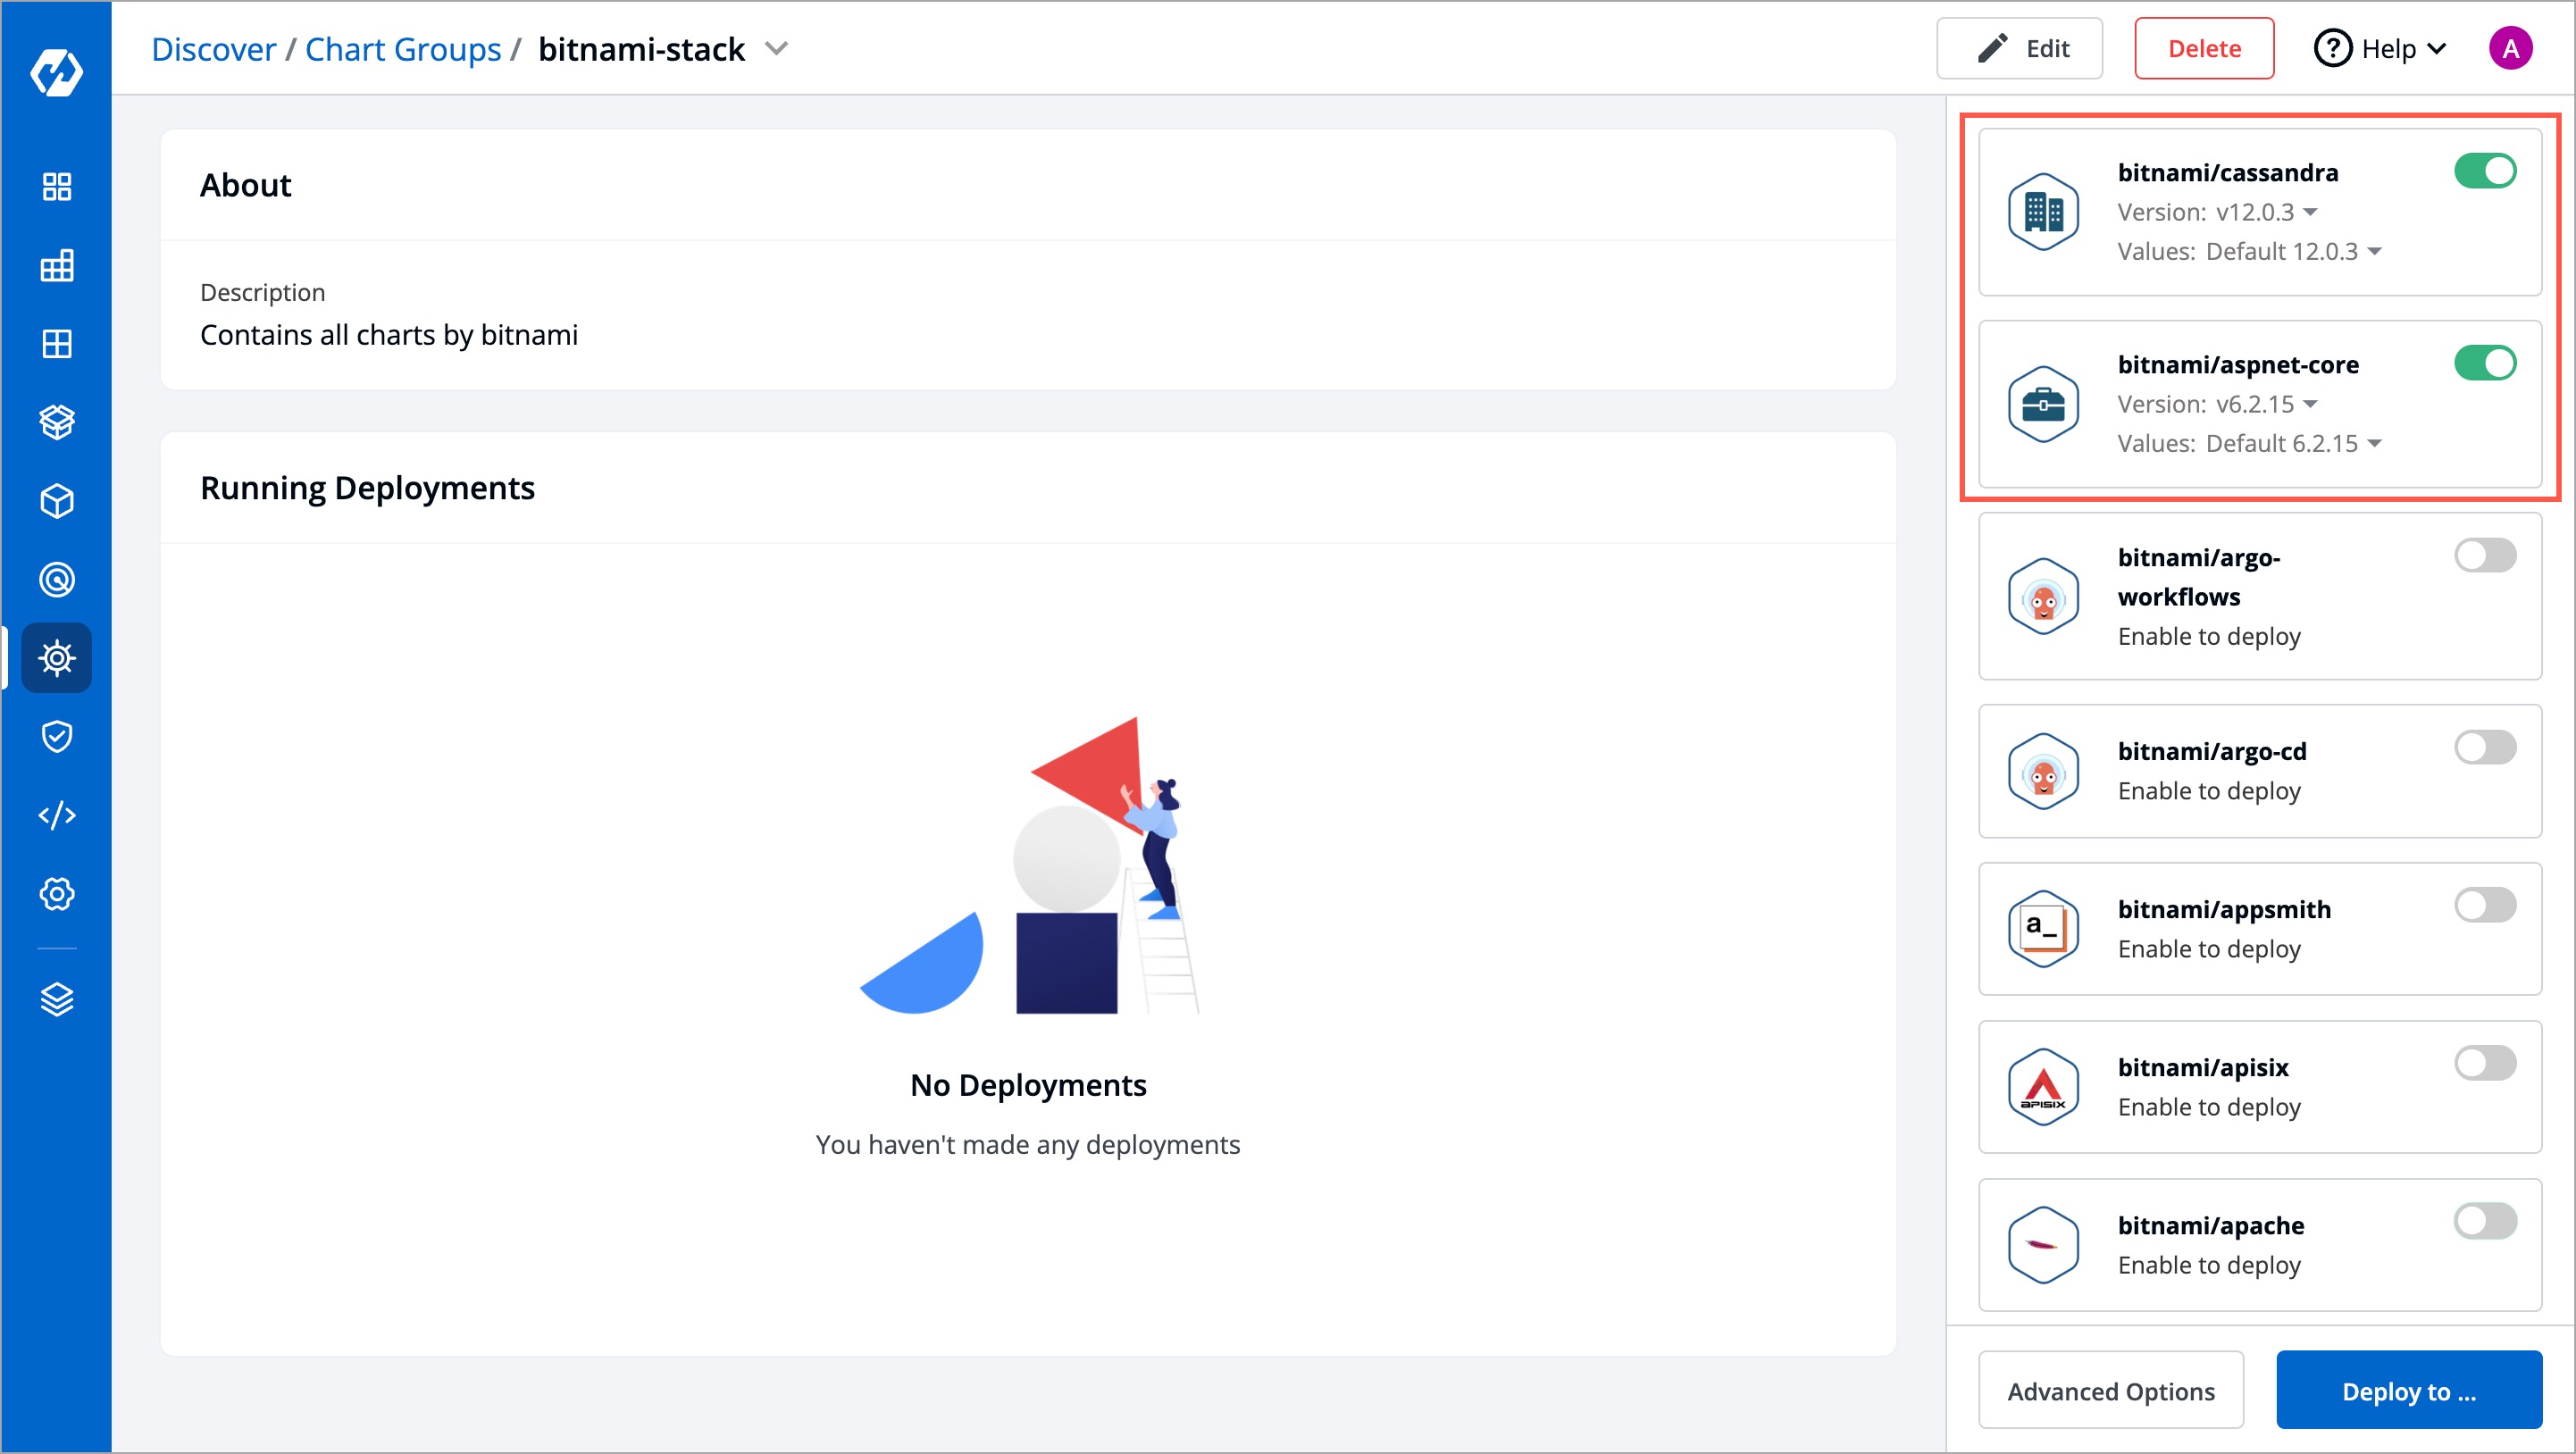
By default, a chart group will show all the charts you added to it. However, you may choose to deploy only selected charts and deselect the rest from the chart group.
-
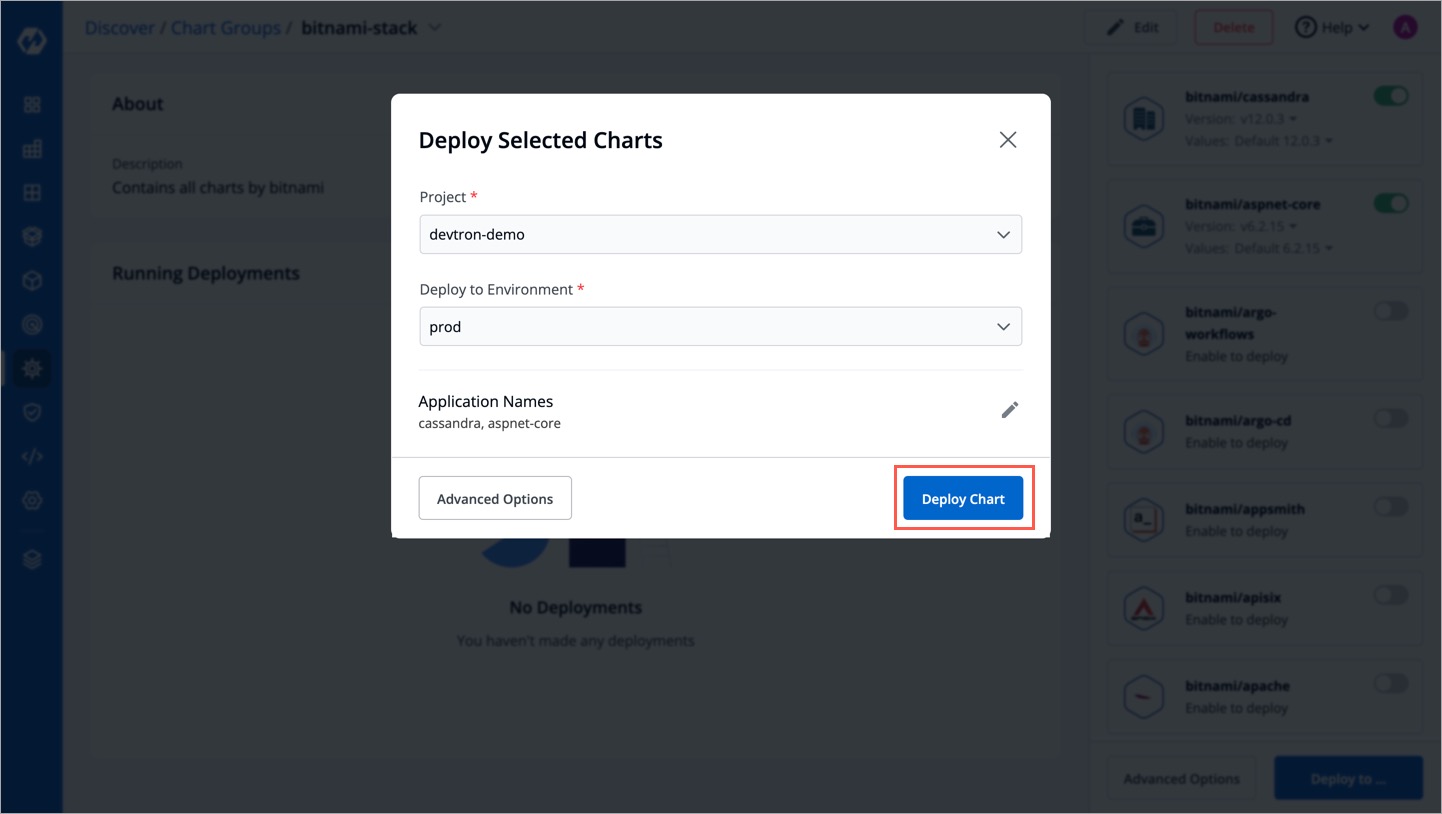
In the Deploy Selected Charts window, select the project and environment where you wish to deploy the chart group. You may use the Advanced Options if you wish to edit the chart configurations too.
-
Click Deploy to initiate the deployment of the selected charts in the Chart Group.

Before deploying your chart group, you may click Advanced Options to edit the chart configuration of any chart in the group.

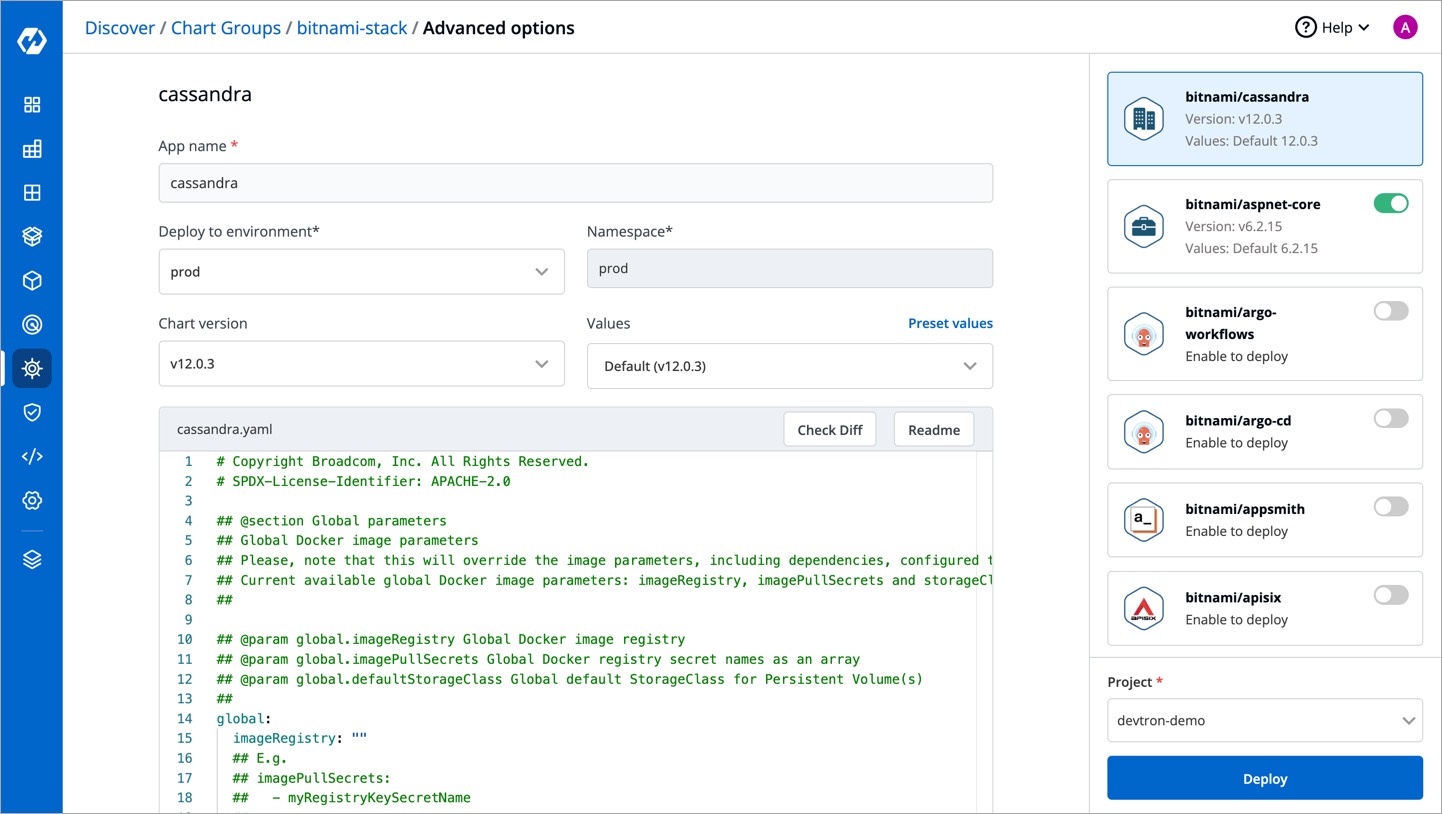
You can edit the following fields and also the YAML file of the corresponding chart.
| Key | Description |
|---|---|
| App name | Name of the app |
| Deploy to Environment | Select the environment in which the chart has to be deployed |
| Chart version | Select the version of the chart to be used |
| Values | You can use a default value or custom value. Ensure the value that you select for the chart is compatible with the 'Chart Version' you selected. |
After changing the configurations, select your project and click Deploy

You can rename a chart group, remove charts from it, or add new charts to the group. To edit a chart group, click it and use the Edit button.
{% embed url="https://www.youtube.com/watch?v=4bsxuUyRYTI" caption="Editing Chart Group in Devtron" %}
You may click Group Detail to view the charts added to the group and check their running instances.
To delete a chart group, click it and use the Delete button.