A Grafana panel that renders a JSON or JSONB value returned by your query as a
collapsible, interactive tree. It is handy for inspecting JSON columns from
PostgreSQL (json/jsonb), API responses surfaced through a data source, or
any field whose value is a JSON document.
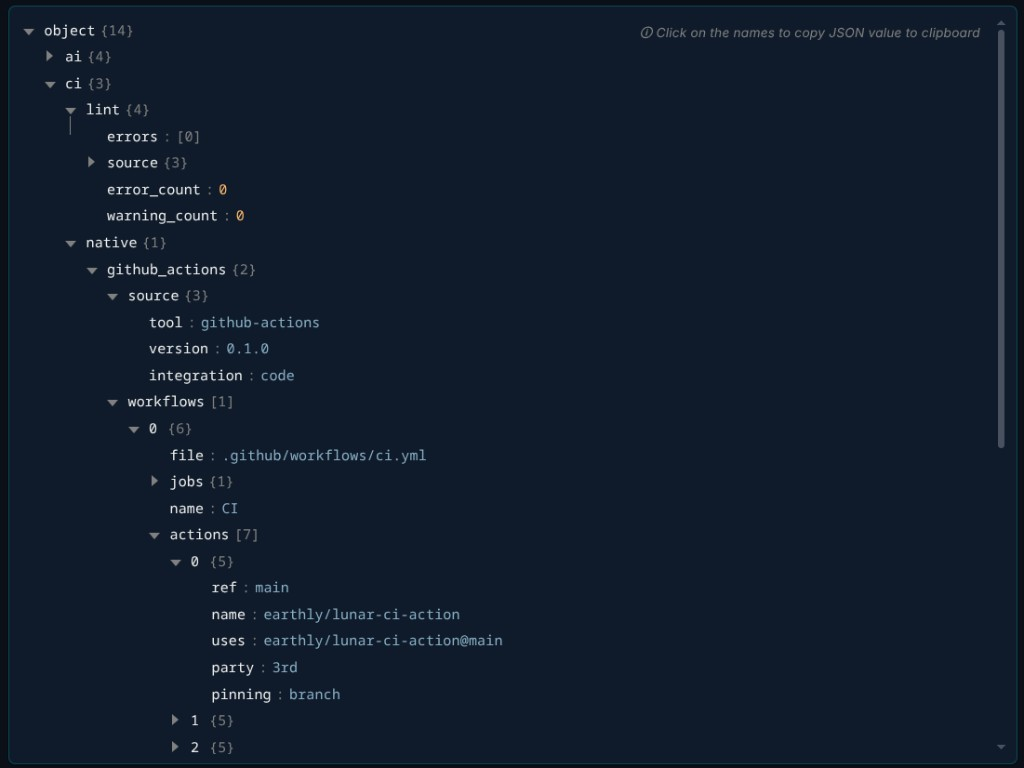
- Renders any JSON/JSONB value as an expandable tree.
- Click a key to copy its JSON subtree to the clipboard.
- Choose how many levels to expand on first render (collapsed, first level, or all).
- Pick which field and row to read when a query returns more than one.
- Compact mode for dense dashboards.
- Grafana 10.4 or later.
- A data source that returns the JSON you want to display in a field. The value can be a real JSON/JSONB object or a string containing JSON (it is parsed automatically).
-
Add a panel and select JSON Tree as the visualization.
-
Write a query that returns the JSON document in a field. For example, with a PostgreSQL data source:
SELECT metadata AS document
FROM components
WHERE id = $component
LIMIT 1;
-
The panel renders the value of the first JSON-like field of the first row. Use the panel options below to target a specific field or row.
| Option | Description |
|---|---|
| Field name | Name of the field that contains the JSON. If empty, the first JSON-like field is used. |
| Row index | Which row to render when the query returns several. Defaults to 0. |
| Default expand depth | Levels expanded on first render: 0 collapsed, 1 first level, -1 expand all. |
| Compact mode | Smaller paddings and fonts. |
Licensed under the MIT License.