Visualized architecture is a useful aid in collaboration and documentation.
The C4 model is a lean graphical notation technique for modelling the architecture of software systems. (Wikipedia)
Context, Container, Component & Code
Read more about C4 at c4model.com
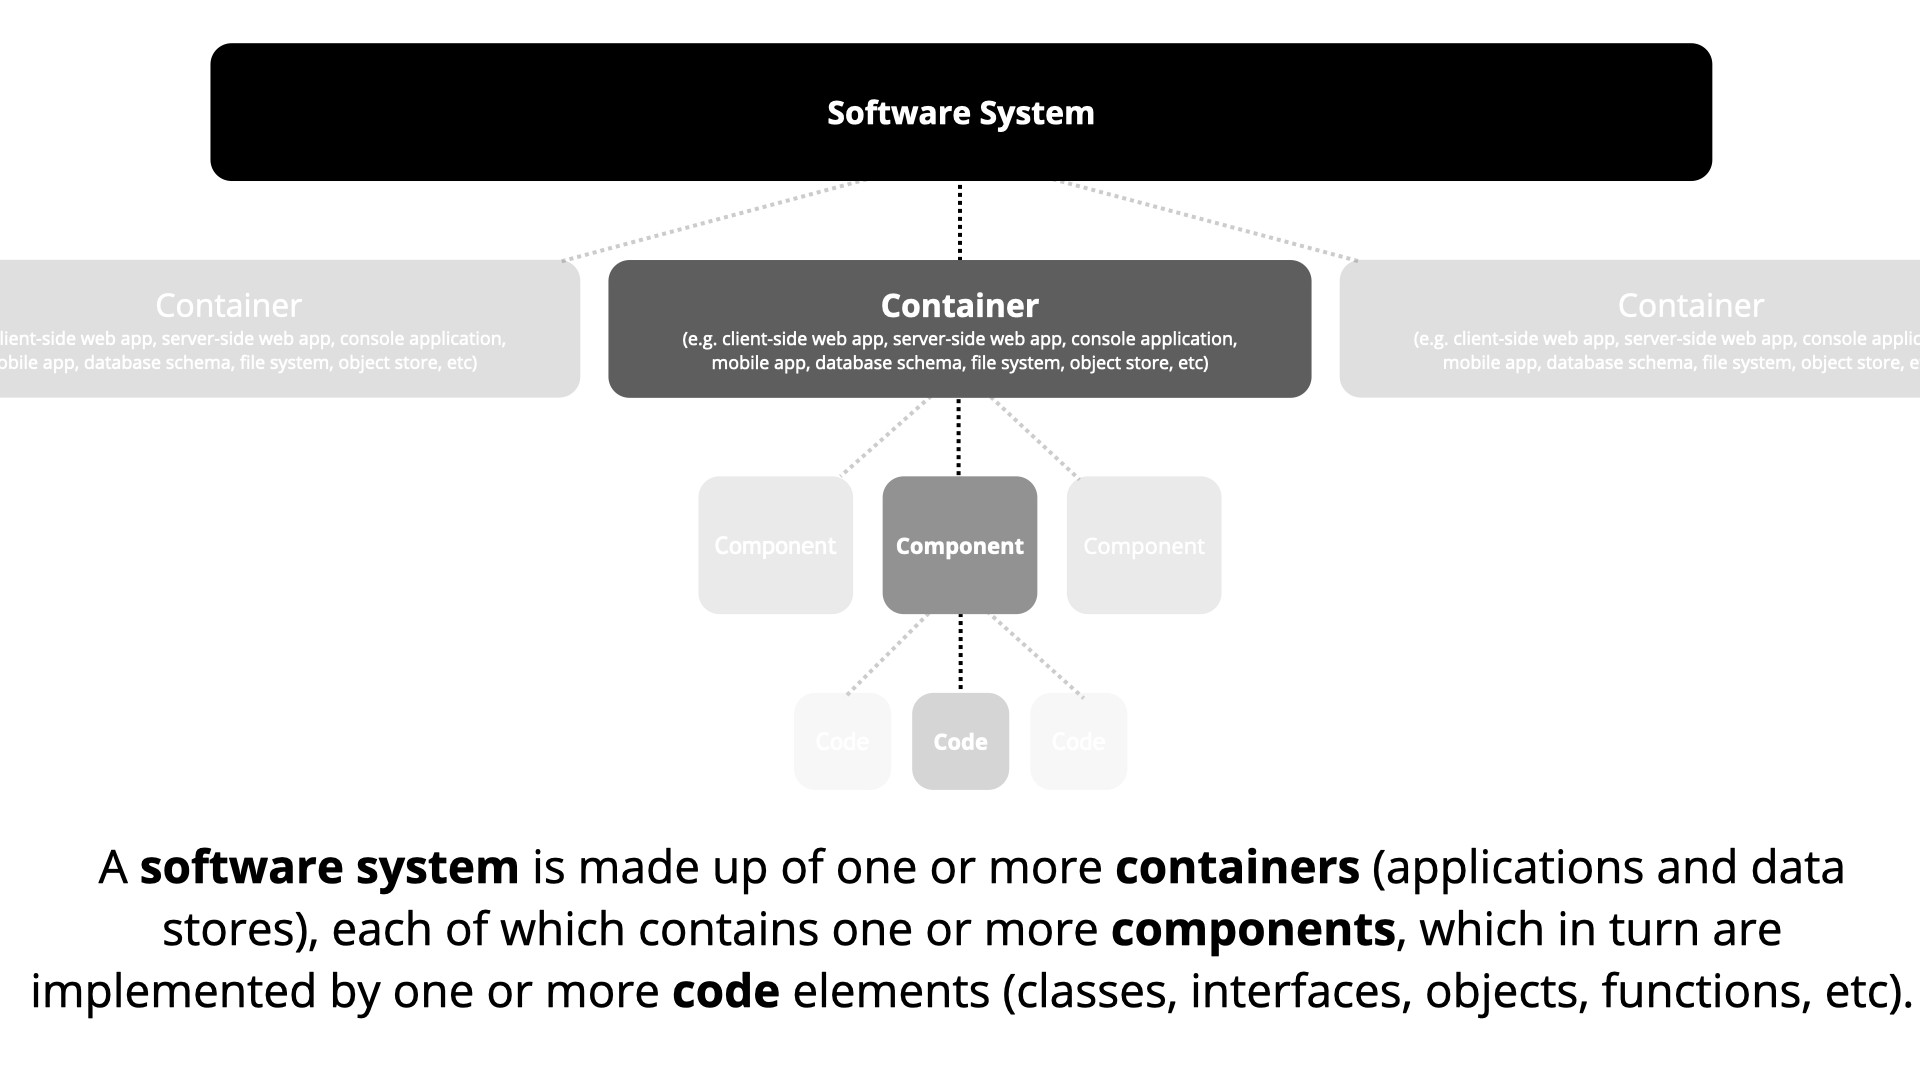
Valuable for
- Citizen developers
- Professional developers
- End users
- Product owners
- Stakeholders
Valuable for
- citizen developers
- professional developers
Valuable for
- Seasoned citizen developers
- professional developers
Code diagrams are usually redundant and not recommended to include in documentation, but can still be useful as a tool in workshops.
Valuable for:
- Seasoned citizen developers
- Professional developers
The repository includes some examples, the Plant UML extension is included in the repository codespace/devcontainer for generating image files from the .puml files
Plant UML is based on Unified Modeling Language (UML) is a modeling language that provides standards for software system design.
@startuml Canvas App And Power BI Dashboard - Context
title Power Platform Canvas App and Power BI report connected to internal API

!define FONTAWESOME https://raw.githubusercontent.com/tupadr3/plantuml-icon-font-sprites/master/font-awesome-5

!include https://raw.githubusercontent.com/plantuml-stdlib/C4-PlantUML/master/C4_Container.puml
!include FONTAWESOME/users.puml

Person(User, "Users", "Users in need of functionality", $sprite="users")
System(PowerBIService, "Power BI", "Power BI dashboard")
Container(DataverseSolution, "Solution", "Power Platform", "Canvas or model driven apps, automations, chatbots")
System(InternalService, "Internal Service", "Internally hosted APIs")
System_Ext(ExternalService, "External Service", "Externally hosted APIs")
System_Boundary(OnPremService, "On-premises service"){
    Container_Ext(SAP, "SAP", "Software system", "On-prem business data and management system")
}

Rel(User, DataverseSolution, "Uses", "Equinor | AAD")
Rel(User, PowerBIService, "Uses", "Equinor | AAD")
Rel(DataverseSolution, InternalService, "Requests", "user_impersonation scope")
Rel(DataverseSolution, ExternalService, "Requests")
Rel(PowerBIService, InternalService, "Reads")
Rel(User, SAP, "Uses on-premises", "RBAC")
Rel(InternalService, SAP, "Reads and writes data and user roles", "RBAC")

SHOW_FLOATING_LEGEND()
Lay_Distance(LEGEND(), DataverseSolution, 0)
@enduml
The above code will generate the following diagram:
 |
There are a lot of more graphical alternatives to create diagrams such as Miro, FigJam and many more, but the C4 model principles and concepts is the important part.
|
There are a lot of more graphical alternatives to create diagrams such as Miro, FigJam and many more, but the C4 model principles and concepts is the important part.