Hi, I am fine tuning mask_rcnn_R_50_FPN_3x model for plot boundaries detection but I don't understand why the pred_masks are not distributed across the whole image.
Full changes I made can be found here:
[Colob Notebook](
https://drive.google.com/file/d/1nwglXyHB6R2wu7esagFZHG0De6lriexp/view?usp=sharing)
I am training the model on a custom dataset which seem to work well see below input image and annotations:

Here is my configuration:
from detectron2.engine import DefaultTrainer

cfg = get_cfg()
cfg.merge_from_file(model_zoo.get_config_file("COCO-InstanceSegmentation/mask_rcnn_R_50_FPN_3x.yaml"))
cfg.DATASETS.TRAIN = ("field_train",)
cfg.DATASETS.TEST = ("field_val",)
cfg.DATALOADER.NUM_WORKERS = 2
cfg.MODEL.WEIGHTS = model_zoo.get_checkpoint_url("COCO-InstanceSegmentation/mask_rcnn_R_50_FPN_3x.yaml")  # Let training initialize from model zoo
cfg.SOLVER.IMS_PER_BATCH = 2  # This is the real "batch size" commonly known to deep learning people
cfg.SOLVER.BASE_LR = 0.00025  # pick a good LR
cfg.SOLVER.MAX_ITER = 1500    # 300 iterations seems good enough for this toy dataset; you will need to train longer for a practical dataset
cfg.SOLVER.STEPS = []        # do not decay learning rate
cfg.MODEL.ROI_HEADS.BATCH_SIZE_PER_IMAGE = 128   # The "RoIHead batch size". 128 is faster, and good enough for this toy dataset (default: 512)
cfg.MODEL.ROI_HEADS.NUM_CLASSES = 1  # only has one class (ballon). (see https://detectron2.readthedocs.io/tutorials/datasets.html#update-the-config-for-new-datasets)
# NOTE: this config means the number of classes, but a few popular unofficial tutorials incorrect uses num_classes+1 here.
cfg.OUTPUT_DIR = './saved_model'
os.makedirs(cfg.OUTPUT_DIR, exist_ok=True)
trainer = DefaultTrainer(cfg)
trainer.resume_or_load(resume=False)
trainer.train()
For now I am only plotting the pred_masks because that is what I need for now.
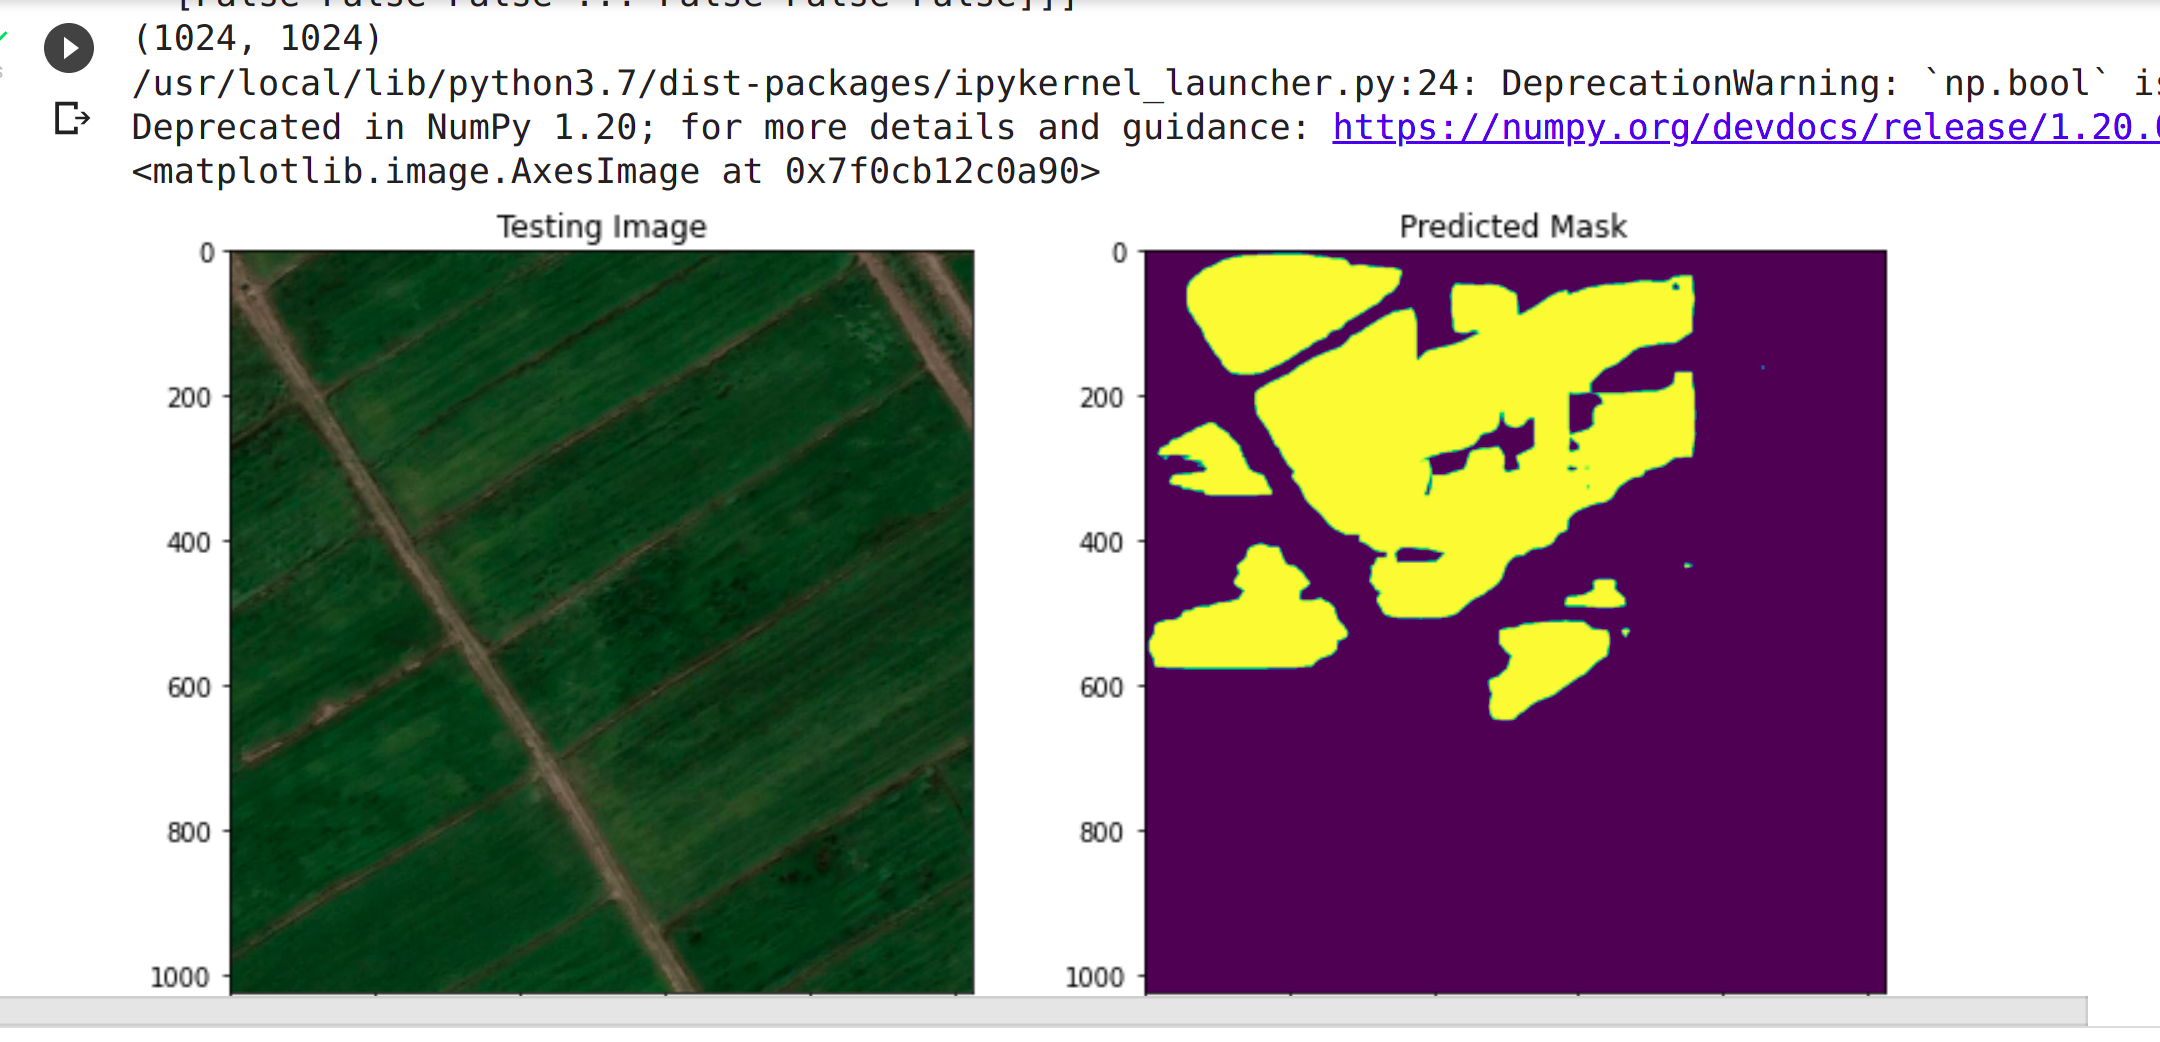
The predicted masks tend to be on the top part of the image see above and the plots on the bottom are not being detected.
Does anyone have any idea how I can improve my results? Suggestions are welcomed and thanks to this wonderful repo.
Hi, I am fine tuning mask_rcnn_R_50_FPN_3x model for plot boundaries detection but I don't understand why the pred_masks are not distributed across the whole image.
Full changes I made can be found here:
I am training the model on a custom dataset which seem to work well see below input image and annotations:

Here is my configuration:
For now I am only plotting the pred_masks because that is what I need for now.
The predicted masks tend to be on the top part of the image see above and the plots on the bottom are not being detected.
Does anyone have any idea how I can improve my results? Suggestions are welcomed and thanks to this wonderful repo.