Name
一个利用双移动平均线交易策略Dual-Moving-Average-Trading-Strategy
Author
ChaoZhang
Strategy Description
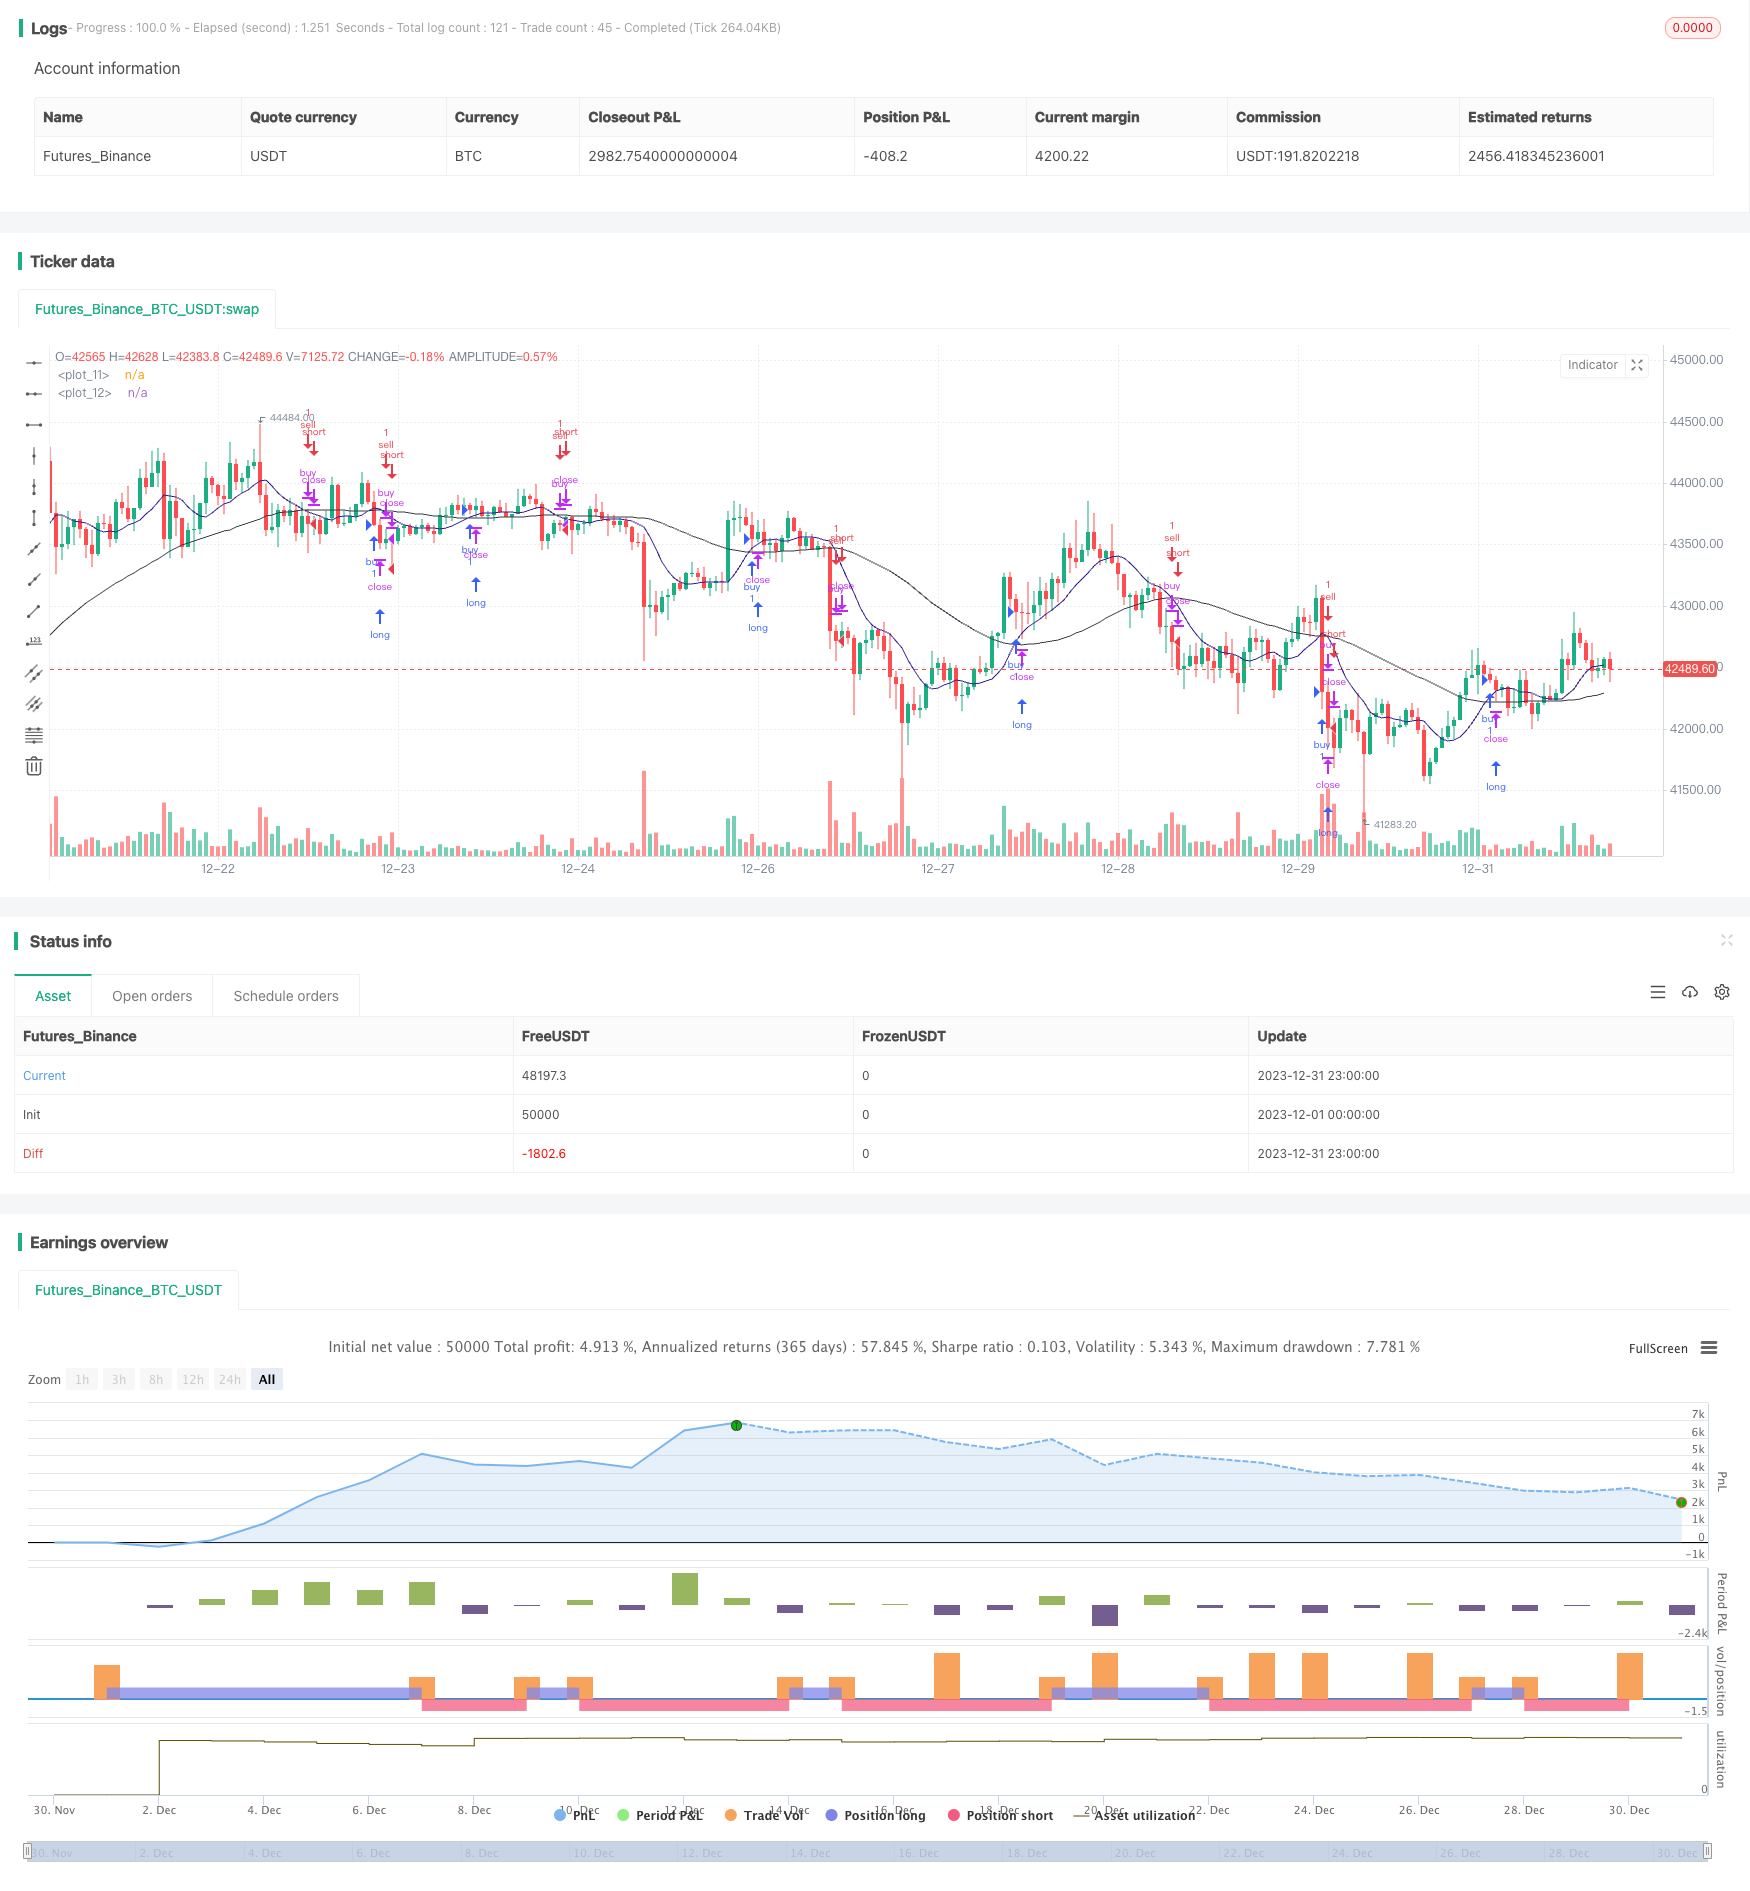
双移动平均线交易策略(Dual Moving Average Trading Strategy)是一个利用两条不同周期的移动平均线构建交易信号的量化交易策略。该策略通过计算两条移动平均线之间的关系来判断市场趋势和机会,在趋势性行情中具有较好的跟踪效果。
该策略主要运用两条移动平均线进行技术指标分析。策略中定义了一条较短周期的5日移动平均线ma0和一条较长周期的21日移动平均线ma1。策略通过比较价格与ma0的差值osc0和ma0与ma1的差值osc1的正负来判断目前的趋势状态。
当osc0>0和osc1>0时,表示短期均线已上穿长期均线,属于多头行情;当osc0<0和osc1<0时,表示短期均线已下穿长期均线,属于空头行情。策略在判断多头行情时,采取买入开仓的操作;判断空头行情时,采取卖出开仓的操作。
在开仓后,策略通过监控osc0和osc1的实时变化来判断持仓的获利空间。当多头持仓后osc0<0和osc1<0时,表示趋势反转,此时平掉多头仓位;当空头持仓后osc0>0和osc1>0时,表示趋势反转,此时平掉空头仓位。
双移动平均线交易策略具有如下优势:
-
操作原理简单,容易理解实现,适合量化交易初学者;
-
顺势交易,跟踪趋势性行情,收益较好;
-
通过调整移动平均线的周期参数,可以适应不同市场的特征;
-
可与其它指标或策略组合使用,扩大获利空间。
双移动平均线交易策略也存在一些风险:
-
当趋势反转时,无法及时止损,可能带来较大亏损;
-
震荡行情中轮番止损,实现难度较大;
-
参数优化难度较大,5日和21日并不是最优参数;
-
交易信号较滞后,入场较晚,可能影响获利率。
双移动平均线交易策略可从以下几个方面进行优化:
-
结合 VOL 指标确定真正趋势的开始,避免假突破;
-
增加附加判断条件,如价格突破、成交量放大等,确保交易信号的可靠性;
-
对持仓进行动态止损,及时控制亏损;
-
优化移动平均线差值的参数阈值,降低误差率。
-
利用机器学习方法自动优化移动平均线的周期参数。
双移动平均线交易策略整体来说是一种较为经典和实用的趋势跟踪策略。该策略操作简单,适合量化交易初学者练习;顺势而为,跟踪效果较好;可扩展性强,容易与其它技术指标和策略组合。但该策略也存在一定的不足,需要进一步优化以处理异常行情,降低风险,提高稳定性。
||
The Dual Moving Average Trading Strategy is a quantitative trading strategy that constructs trading signals using two moving average lines with different cycles. This strategy judges market trends and opportunities by calculating the relationship between the two moving average lines and has good tracking performance in trending markets.
The core technique this strategy utilizes is the analysis of two moving average lines. The strategy defines a 5-day short cycle moving average line ma0 and a 21-day long cycle moving average line ma1. By comparing the difference values osc0 between price and ma0 and osc1 between ma0 and ma1, the strategy determines the current trend status.
When osc0>0 and osc1>0, it means the short-term moving average line has crossed above the long-term line, indicating a bullish trend. When osc0<0 and osc1<0, it means the short-term line has crossed below, indicating a bearish trend. The strategy takes long position when a bullish trend is identified and takes short position when a bearish trend is identified.
After taking positions, the strategy keeps monitoring the real-time change of osc0 and osc1 to judge the profit range of the position. When osc0<0 and osc1<0 after taking long position, it means a trend reversal, so the long position should be closed. When osc0>0 and osc1>0 after taking short position, it also means a reversal, so the short position should be closed.
The Dual Moving Average Trading Strategy has the following advantages:
-
Simple principle and easy to understand and implement, suitable for quant trading beginners;
-
Trend following, good at tracking trending markets with decent profit;
-
The cycle parameters of the moving averages can be adjusted for different market conditions;
-
Can be combined with other indicators or strategies for greater profits.
There are also some risks with this strategy:
-
Unable to exit positions timely when trend reverses, may lead to huge losses;
-
Difficult to profit in range-bound markets due to frequent stop loss;
-
Hard to optimize parameters like 5-day and 21-day cycles;
-
Lagging trading signals, late market entrance, may influence profit rate.
The Dual Moving Average Trading Strategy can be optimized from the following aspects:
-
Combine with VOL to confirm real trend start, avoid false breakouts;
-
Add other filters like price breakout, volume expansion to ensure signal reliability;
-
Set dynamic stops to cut losses in time;
-
Optimize parameters like the threshold of moving average difference to reduce errors;
-
Utilize machine learning to auto optimize the cycles of the moving averages.
In conclusion, the Dual Moving Average Trading Strategy is a quite classic and practical trend following strategy. It has simple logic for beginners to practice, good at tracking trends, highly extensible to combine with other techniques. But it also has some flaws, further optimizations are needed to handle exceptional market conditions, reduce risk and improve stability.
[/trans]
Strategy Arguments
| Argument | Default | Description |
|---|---|---|
| v_input_1 | 5 | length0 |
| v_input_2 | 21 | length1 |
Source (PineScript)
/*backtest
start: 2023-12-01 00:00:00
end: 2023-12-31 23:59:59
period: 1h
basePeriod: 15m
exchanges: [{"eid":"Futures_Binance","currency":"BTC_USDT"}]
*/

//@version=2
strategy("[STRATEGY][RS]MA Strategy test V0", overlay=true)
length0 = input(5)
length1 = input(21)

isinsession = not na(time('1', '0400-1500'))
price = open

ma0 = ema(ema(price, length0), length0)
ma1 = ema(ema(price, length1), length1)
plot(ma0, color=navy)
plot(ma1, color=black)

osc0 = price-ma0
osc1 = ma0-ma1

isbull = osc0 > 0 and osc1 > 0
buy_condition = isinsession and isbull and not isbull[1]
buy_exit_condition = osc0 < 0 and osc1 < 0
strategy.entry("buy", strategy.long, comment="buy", when=buy_condition)
strategy.close(id='buy', when=buy_exit_condition)

isbear = osc0 < 0 and osc1 < 0
sell_condition = isinsession and isbear and not isbear[1]
sell_exit_condition = osc0 > 0 and osc1 > 0
strategy.entry("sell", strategy.short, comment="sell", when=sell_condition)
strategy.close(id='sell', when=sell_exit_condition)

//plot(strategy.equity, title="equity", color=red, linewidth=2, style=areabr)
Detail
https://www.fmz.com/strategy/440078
Last Modified
2024-01-26 14:45:55