Name
一个简单高效的MACD量化交易策略MACD-Crypto-Trading-Strategy
Author
ChaoZhang
Strategy Description
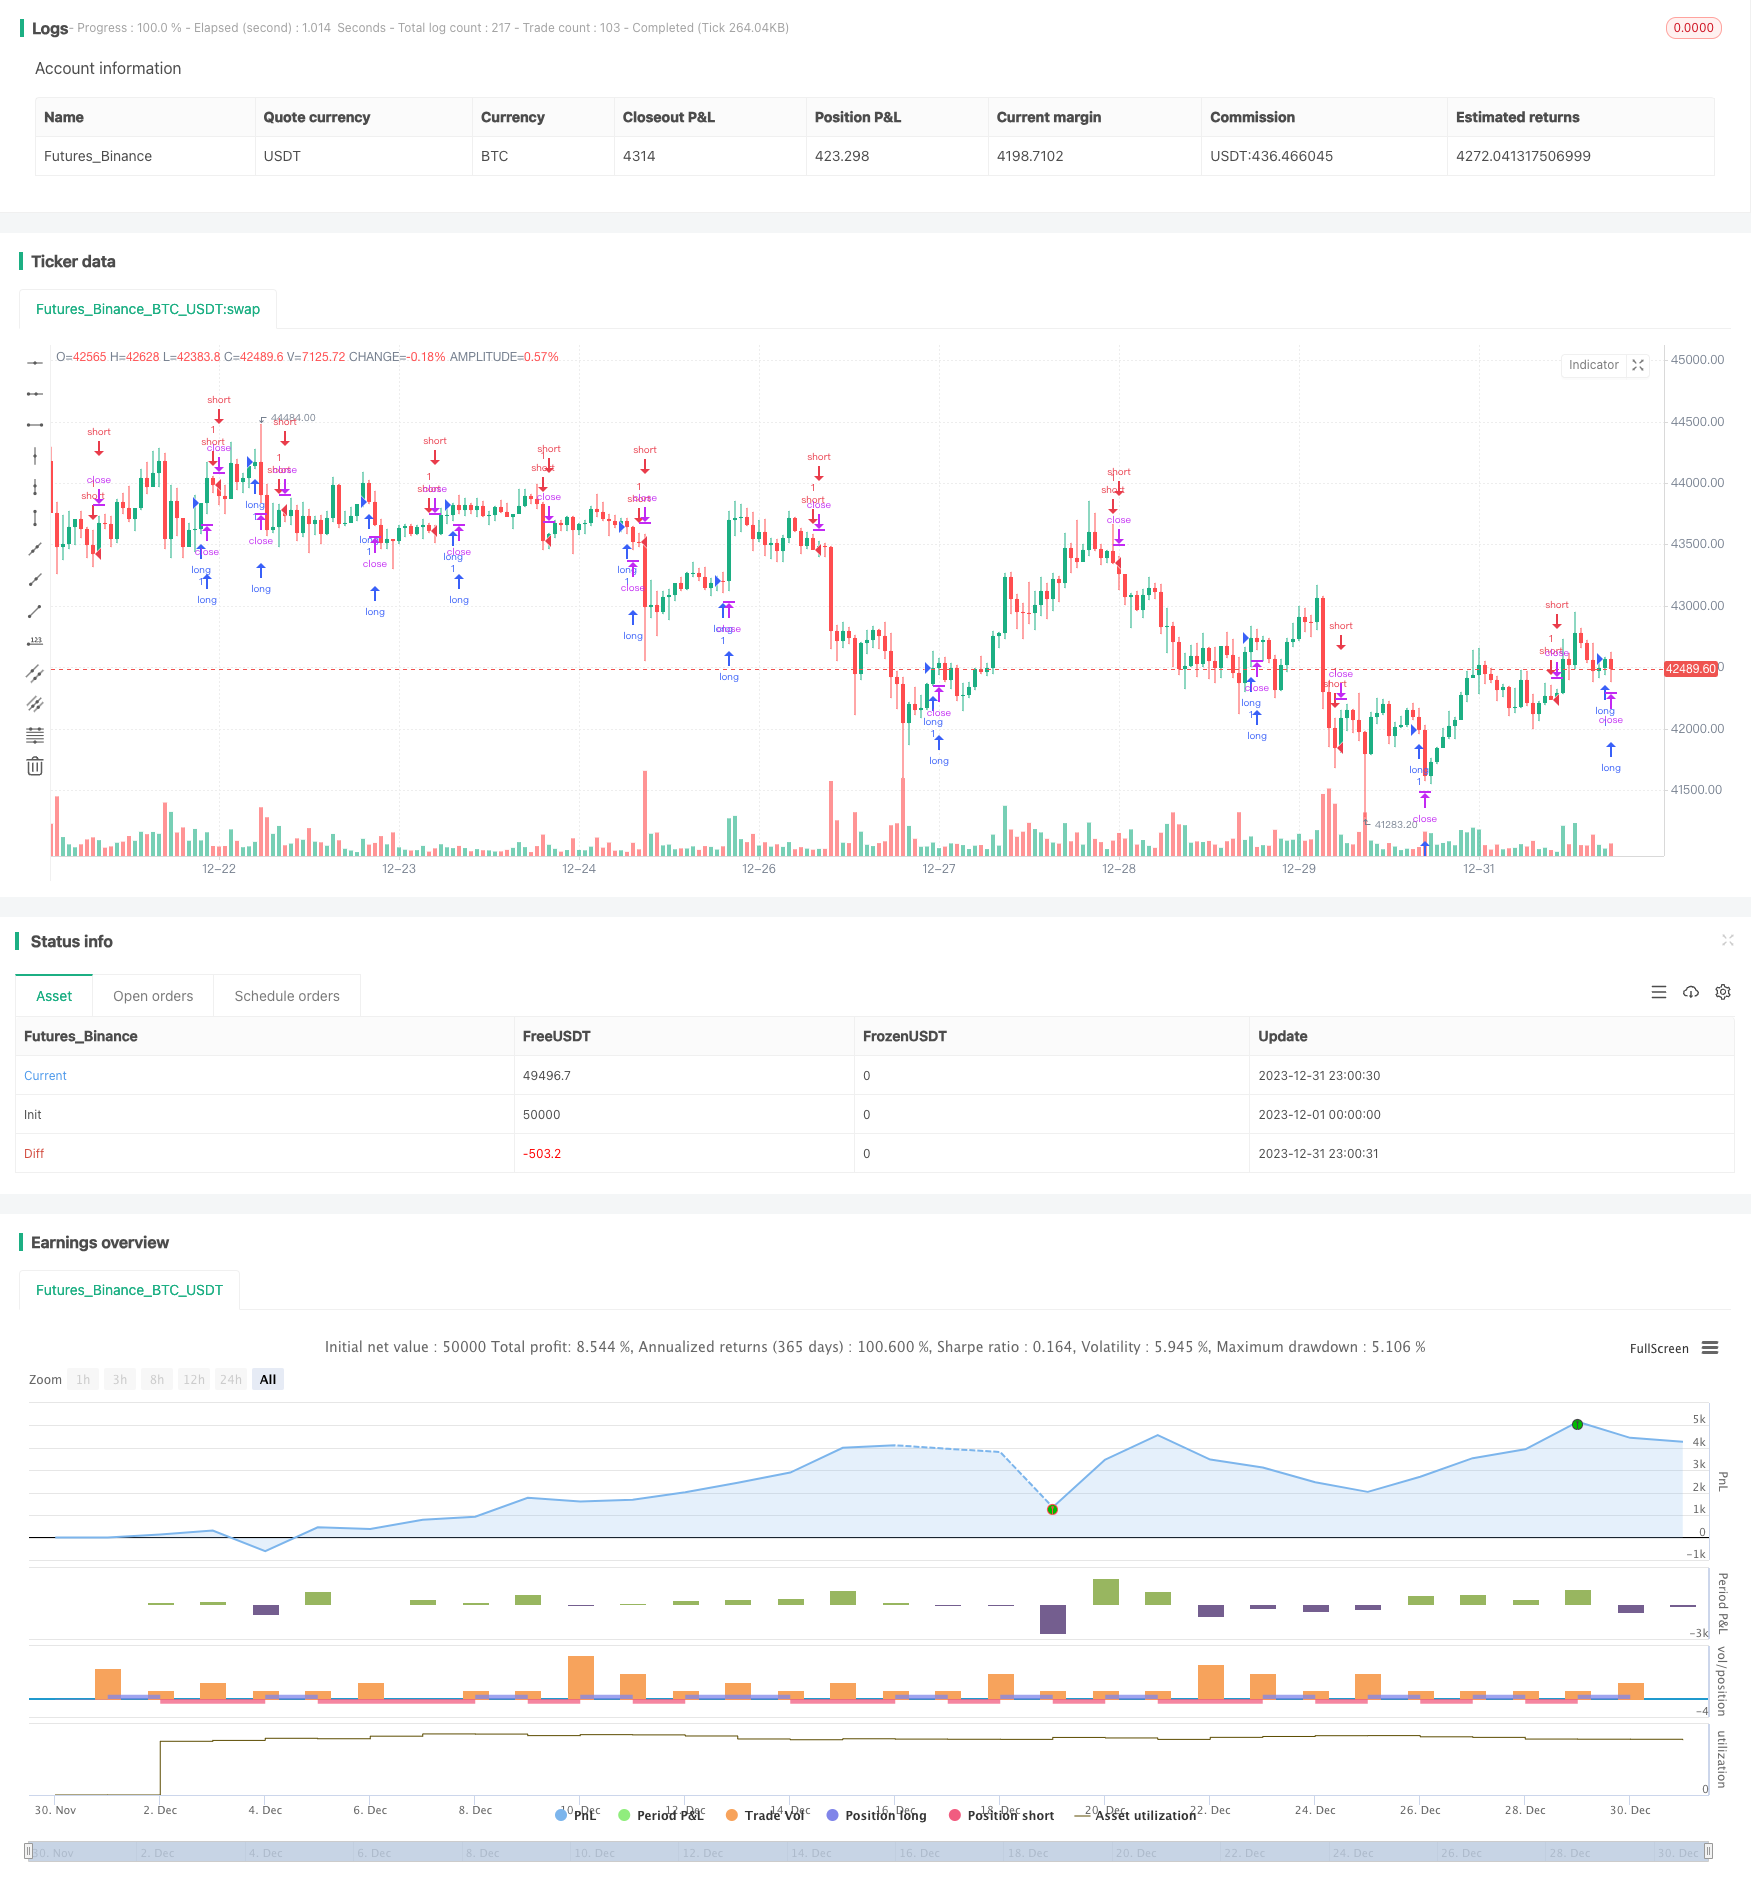
这个策略是一个简单高效的MACD量化交易策略,专门设计用于加密货币市场,适用于较高时间周期的交易,比如1小时、4小时、1天等。策略使用MACD指标判断市场趋势方向,并结合简单移动平均线产生交易信号。该策略最大的优势是简单高效,容易理解和实现,特别适合加密货币这种高波动市场。但是也有一定的风险,需要进一步优化和完善。
该策略使用MACD指标判断市场趋势和产生交易信号。MACD由快线、慢线和MACD柱组成。快线是短期移动平均线,慢线是长期移动平均线。当快线上穿慢线时为买入信号,当快线下穿慢线时为卖出信号。MACD柱是快线和慢线的差值,柱体为正说明处于多头市场上升趋势中,柱体为负说明处于空头市场下跌趋势中。该策略配合简单移动平均线,进一步验证信号,避免错误交易。具体来说,只有当MACD柱为正同时简单移动平均线也为正时才会产生多头信号做多;只有当MACD柱为负同时简单移动平均线也为负时才会产生空头信号做空。通过MACD柱判断大方向,防止逆势交易亏损。
这是一个非常简单高效的策略,最大的优势有以下几个方面:
-
使用MACD判断市场方向,这是一种成熟可靠的技术分析指标,可以准确判断趋势;
-
结合简单移动平均线进行信号过滤,可以避免假信号,提高信号准确率;
-
专门适用于加密货币这种高波动市场,这类市场MACD效果最好;
-
策略逻辑简单清晰,容易理解和实现,门槛低,容易被应用;
-
可以在较高时间周期运行,这样可以减少交易频率,降低交易成本和滑点的影响。
但是这个策略也存在一定的风险,主要有以下几个方面:
-
使用简单移动平均线作为信号过滤,在某些行情下可能错过最佳入场时机;
-
没有使用止盈止损策略,有可能给账户带来较大的单笔亏损;
-
可能会产生一定的延迟信号和假信号,导致不必要的亏损;
-
没有考虑到交易时间和频率对获利的影响。
这些风险都需要进一步完善和优化这个策略。
根据上述风险分析,该策略可以进一步从以下几个方向进行优化:
-
尝试不同参数设置和不同指标组合,找到最佳参数;
-
增加止盈止损策略,限制单笔亏损的最大值;
-
优化入场时机选择,设定更加严格的信号验证方式,确保信号效果;
-
考虑不同交易时间和交易频率对整体获利水平的影响。
通过这几个方向的优化,可以大大增强这个策略的稳定性、盈利水平和实战性。
总的来说,这是一个非常有实战价值的MACD交易策略。它简单高效、易于实现,非常适合那些想要快速入门量化交易的人。同时该策略也具有很大的优化空间,通过不断优化测试可以将其打造成稳定高效的量化策略,适合长期实盘运营。
||
This is a simple yet efficient MACD crypto trading strategy specifically designed for cryptocurrency markets and suitable for higher timeframe charts like 1 hour, 4 hours, 1 day etc. The strategy uses the MACD indicator to determine market trend direction and trading signals are generated with simple moving average. The biggest advantage of this strategy is being simple, efficient and easy to understand and implement, especially suitable for the highly volatile crypto markets. However there are also some risks that need further optimization and improvement.
The strategy utilizes the MACD indicator to decide market trend and generate trade signals. MACD consists of the fast line, slow line and MACD histogram. The fast line is the short term moving average and the slow line is the long term moving average. When fast line crosses above slow line, it’s a buy signal. When fast line crosses below slow line, it’s a sell signal. The MACD histogram is the difference between fast line and slow line. Positive histogram means an upward trending bull market while negative histogram means a downward bear market. This strategy uses simple moving average to further validate the signals and avoid false signals. Specifically, only when both the MACD histogram and simple moving average are positive, the strategy will generate long signal to go long. When both the MACD histogram and simple moving average are negative, the strategy will generate short signal to go short. Using the MACD histogram to determine market direction can prevent trading against the trend.
The biggest advantages of this simple yet efficient strategy are:
-
Using MACD to determine market direction, a mature and reliable technical indicator to accurately judge the trend;
-
Combining simple moving average for signal filtering, avoiding false signals and improving accuracy;
-
Specially designed for the highly volatile crypto markets where MACD performs the best;
-
The logic is simple and clear, easy to understand and implement, low barrier for adoption;
-
Can run on higher timeframes to lower trade frequency and reduce trading costs.
However there are also some risks of this strategy:
-
Using simple moving average for filtering might miss the best entry price in some market condition;
-
No profit taking or stop loss in place might lead to huge single trade loss;
-
Possible lagging signals and false signals might cause unnecessary loss;
-
Haven’t considered the impact of trading timeframe and frequency on overall profitability.
These risks need to be addressed by further optimization.
Based on the risks mentioned above, the strategy can be improved in the following directions:
-
Test different parameters and indicators combinations to find the optimal setting;
-
Add stop loss and profit taking logic to limit max single trade loss;
-
Optimize entry logic with more strict signal confirmation to ensure high quality signals;
-
Consider the impact of different trading timeframe and frequency on the overall profitability.
Through optimizations in these directions, the stability, profitability and viability of this strategy can be greatly enhanced.
In summary, this is a MACD trading strategy with huge practical value. It’s simple, efficient and easy to implement, perfect for people who want to get started with algo trading quickly. At the same time there is ample room for further optimizations to turn it into a stable money making algorithm suitable for long term live trading.
[/trans]
Strategy Arguments
| Argument | Default | Description |
|---|---|---|
| v_input_1_close | 0 | Source: close |
Source (PineScript)
/*backtest
start: 2023-12-01 00:00:00
end: 2023-12-31 23:59:59
period: 1h
basePeriod: 15m
exchanges: [{"eid":"Futures_Binance","currency":"BTC_USDT"}]
*/

// This source code is subject to the terms of the Mozilla Public License 2.0 at https://mozilla.org/MPL/2.0/
// © SoftKill21

//@version=4
strategy("MACD crypto strategy", overlay=true)

// Getting inputs
//fast_length = input(title="Fast Length", type=input.integer, defval=12)
//slow_length = input(title="Slow Length", type=input.integer, defval=26)
//src = input(title="Source", type=input.source, defval=close)
//signal_length = input(title="Signal Smoothing", type=input.integer, minval = 1, maxval = 50, defval = 9)
//sma_source = input(title="Simple MA(Oscillator)", type=input.bool, defval=true)
//sma_signal = input(title="Simple MA(Signal Line)", type=input.bool, defval=false)

fast_length = 12
slow_length = 26
src = input(title="Source", type=input.source, defval=close)
signal_length = 9
sma_source = true
sma_signal = false

// Calculating
fast_ma = sma_source ? sma(src, fast_length) : ema(src, fast_length)
slow_ma = sma_source ? sma(src, slow_length) : ema(src, slow_length)
macd = fast_ma - slow_ma
signal = sma_signal ? sma(macd, signal_length) : ema(macd, signal_length)
hist = macd - signal


longcondition = hist > 0
shortcondition = hist < 0

//sl = input(0.5, title="SL")
//tp = input(0.1, title="tp")

strategy.entry("long",1,when=longcondition)
strategy.entry("short",0,when=shortcondition)

//strategy.exit("x_long", "long" ,loss = close * sl / syminfo.mintick, profit = close * tp / syminfo.mintick , alert_message = "closelong")
//strategy.entry("short",0, when= loss = close * sl / syminfo.mintick)

//strategy.exit("x_short", "short" , loss = close * sl / syminfo.mintick, profit  = close * tp / syminfo.mintick,alert_message = "closeshort")

// risk = input(2, type=input.float,title="Risk percentage of BALANCE")
// strategy.risk.max_intraday_loss(risk, strategy.percent_of_equity)
Detail
https://www.fmz.com/strategy/440073
Last Modified
2024-01-26 14:20:04