Name
一种双均线交易策略Dual-Moving-Average-Crossover-Strategy
Author
ChaoZhang
Strategy Description
该策略运用快速移动平均线和慢速移动平均线的交叉作为买入和卖出信号。当快速移动平均线从下方向上突破慢速移动平均线时,产生买入信号;当快速移动平均线从上方向下跌破慢速移动平均线时,产生卖出信号。
双均线交易策略利用两个不同参数设置的移动平均线比较产生交易信号。一个是快速移动平均线,参数设置较小,能更快捕捉价格变动;另一个是慢速移动平均线,参数设置较大,作为长期趋势的判断指标。当短期价格高于长期价格趋势时,即快速移动平均线上穿慢速移动平均线,产生买入信号;当短期价格低于长期价格趋势时,即快速移动平均线下穿慢速移动平均线,产生卖出信号。
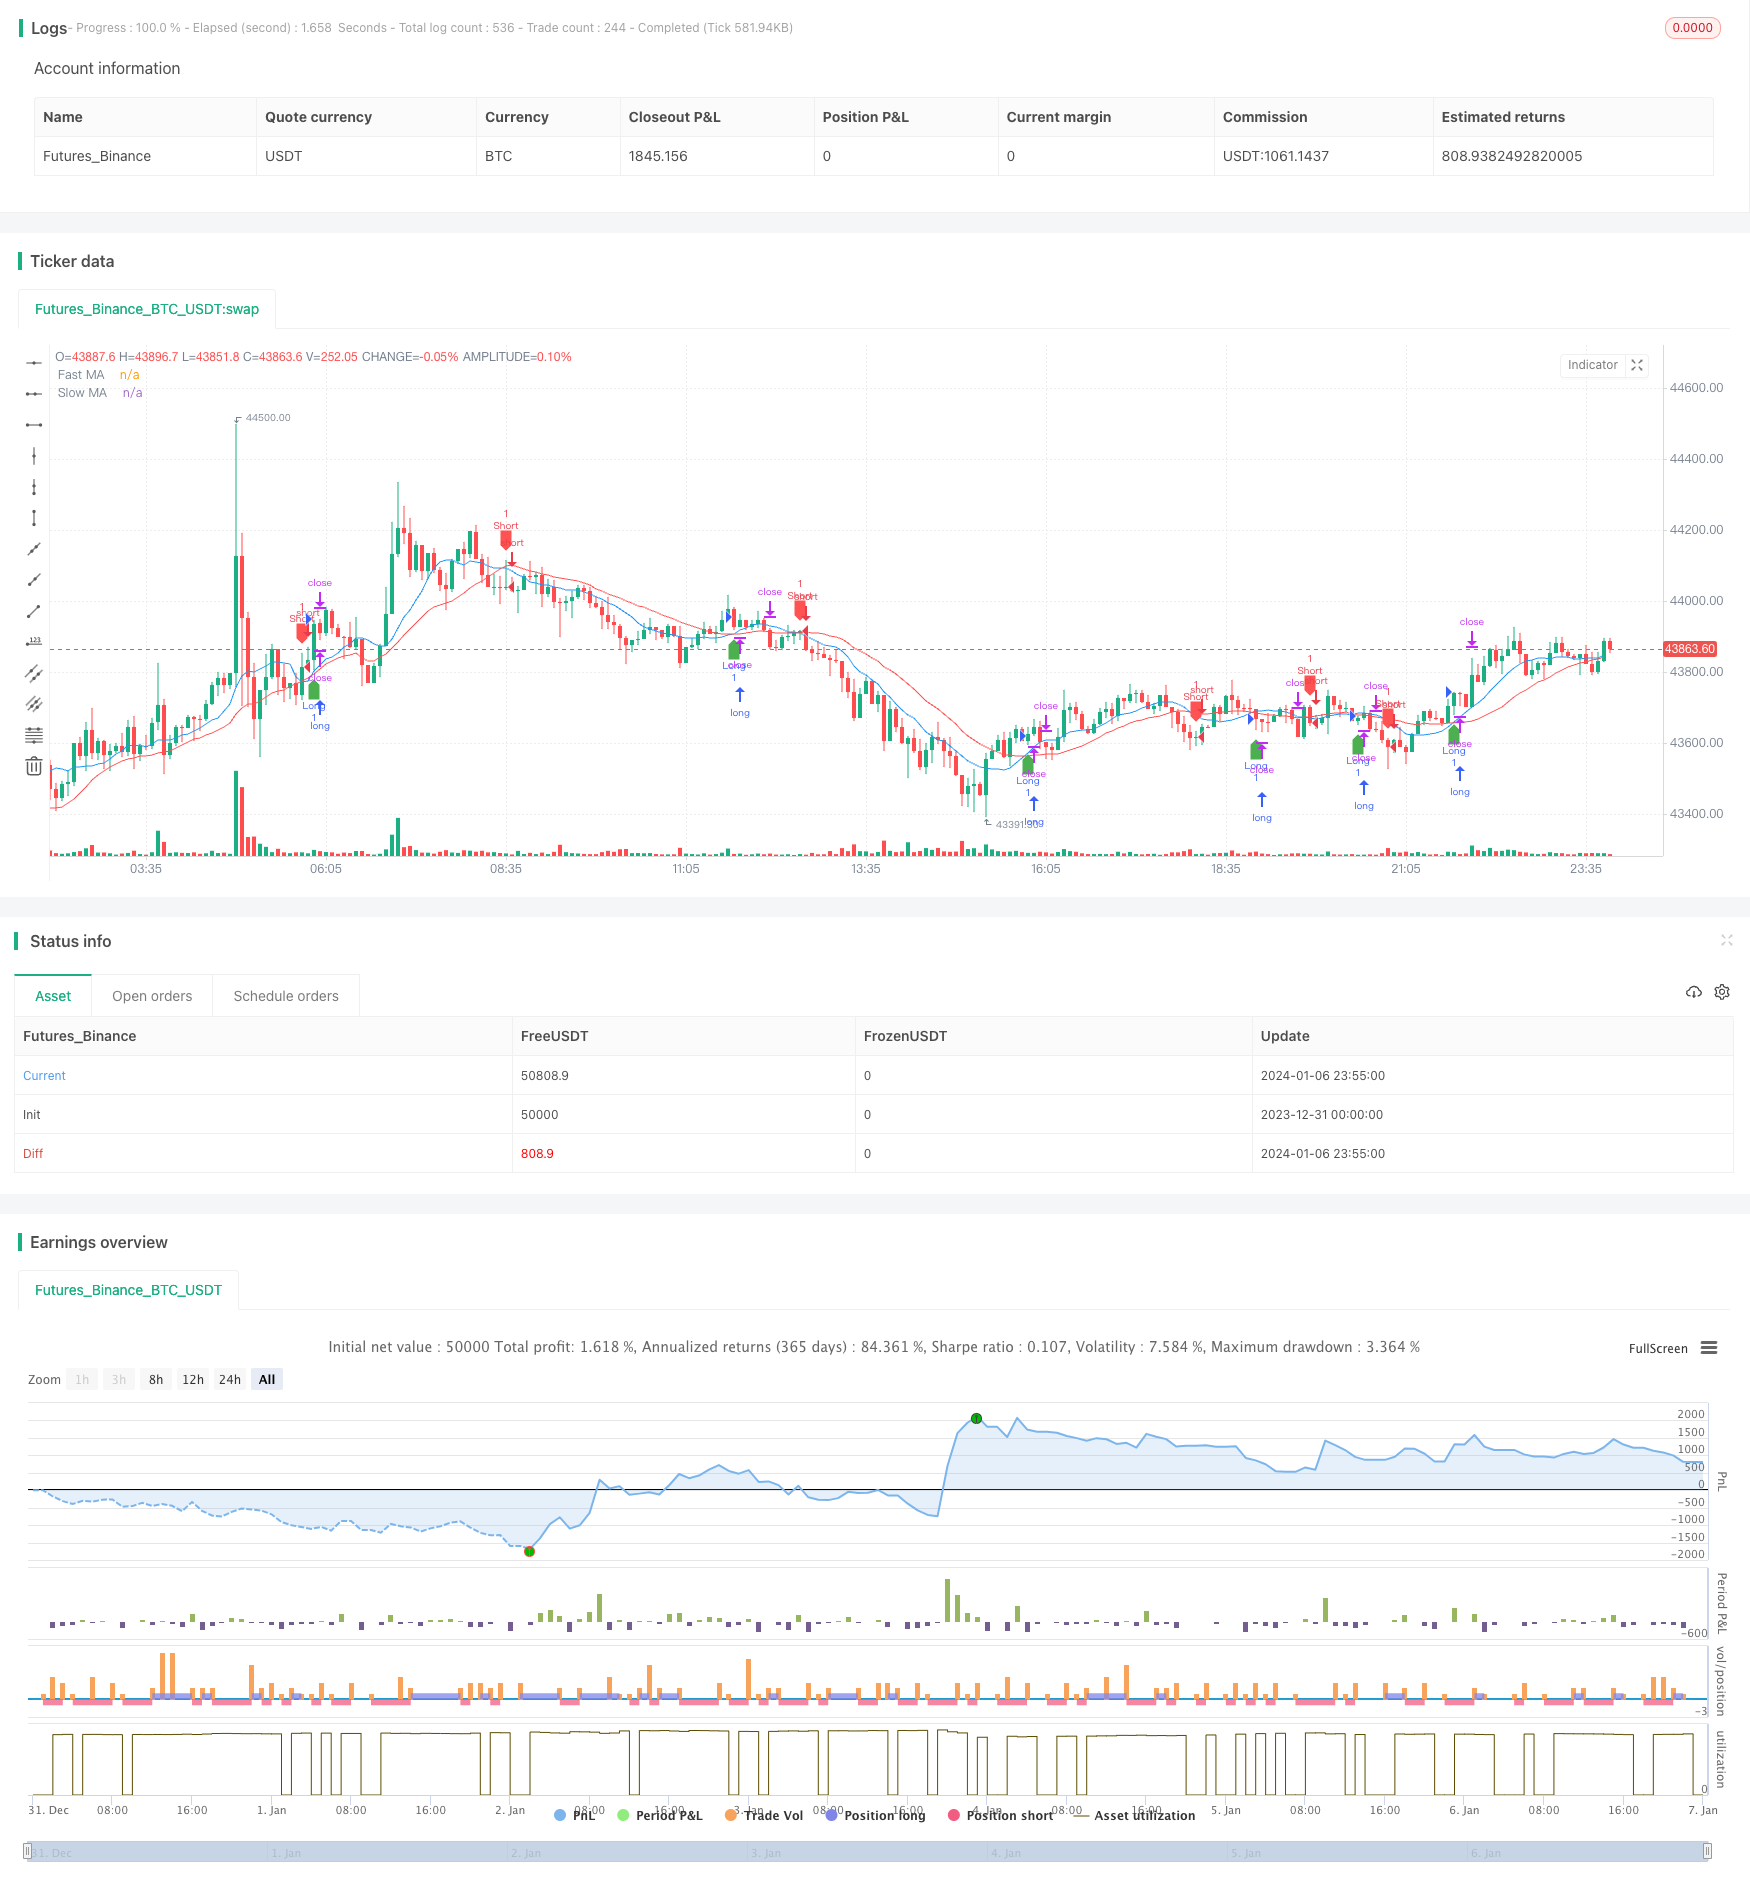
具体来说,该策略通过输入两个移动平均线参数,分别计算快速移动平均线和慢速移动平均线。然后把两个移动平均线画在价格图上,快速线为蓝色,慢速线为红色。当快速蓝线从下方向上穿过红线时,产生买入信号;当快速蓝线从上方向下跌破红线时,产生卖出信号。在交易信号产生后,执行相应的买入开仓或卖出开仓操作。最后,针对买入头寸设置止损止盈逻辑。
双均线策略具有以下优点:
- 操作简单,容易理解和实现。
- 充分利用移动平均线的优点,把握大趋势之外的短期机会。
- 策略参数调整灵活,可适应不同市场环境。
- 可在多种时间周期和品种中使用。
- 可结合其他指标进行优化,如成交量,stoch指标等。
双均线策略也存在以下风险:
- 双均线交叉无法有效过滤曲折盘整的震荡趋势,可能产生较多错误信号。
- 当价格在均线附近波动时,会频繁交叉进出,引发过于频繁的交易。
- 均线参数设置不当也会影响策略效果。
针对上述风险,可通过以下方法加以优化:
- 在均线交叉时判断价格与均线的距离,过滤掉距离太近的无效信号。
- 增加其他条件过滤器,如成交量放大,STOCH指标等,避免在震荡区间无效交易。
- 测试不同均线参数及其组合,找到最佳参数。
双均线策略可通过以下方式进行进一步优化:
- 增加成交量的判断,在价格交叉均线的同时成交量明显放大时才产生信号。
- 结合Stochastic oscillator等辅助指标,判断超买超卖区域避免错误信号。
- 针对不同品种和时间周期测试最佳均线参数。
- 增加机器学习模型判断趋势方向。
- 结合深度学习和决策树模型构建自适应交易系统。
双均线交易策略整体而言非常经典实用。它融合了趋势跟踪和短期价格反转两个维度,使策略在跟踪大趋势的同时不错过反转机会。通过优化模型和参数,可在维持其简单直观优点的同时,获得更可靠的交易信号,达到更好的策略表现。不同交易者可根据自己的偏好和市场环境,调整该策略的具体细节。
||
This article deeply analyzes a Dual Moving Average crossover trading strategy. The strategy uses the crossover of fast and slow moving averages as the buy and sell signals. When the fast moving average crosses above the slow moving average from the bottom up, it generates a buy signal. When the fast moving average crosses down through the slow moving average from the top, it generates a sell signal.
The Dual Moving Average strategy utilizes two moving averages with different parameter settings to generate trading signals by comparison. One is a fast moving average with a smaller parameter setting that can quickly capture price changes. The other one is a slow moving average, with a larger parameter setting as the benchmark of long term trend. When short term price is higher than long term trend, i.e. the fast moving average crosses above the slow one, it sends a buy signal. When short term price is lower than long term trend, i.e. the fast moving average crosses below the slow one, it generates a sell signal.
Specifically, this strategy takes two moving average parameters as input, and calculates the fast and slow moving averages respectively. Then it plots both moving averages on the price chart, with the fast line in blue and slow line in red. When the fast blue line crosses above the red line from the bottom up, it triggers a buy signal. When the fast blue line crosses down the red line from the top, it triggers a sell signal. After the trading signal is generated, it executes corresponding long or short entry orders. Finally, it sets stop loss and take profit logic for the long trades.
The Dual Moving Average strategy has the following advantages:
- Simple to understand and implement.
- Makes good use of the merits of moving averages to catch short term opportunities alongside major trends.
- Flexible parameter tuning to adapt to different market environments.
- Applicable across timeframes and instruments.
- Optimizable with additional indicators like volume, stochastics etc.
The Dual Moving Average strategy also has the following risks:
- Crossovers may fail to filter out choppy consolidation moves effectively, generating excessive false signals.
- Frequent crosses back and forth when price oscillates near the moving averages, causing over-trading.
- Inappropriate parameter selection negatively impacts strategy performance.
To address the above risks, the following optimization methods can be adopted:
- Add distance filters so crosses too close to the moving averages are ignored.
- Incorporate additional filters like volume spike and STOCH to avoid ineffective trades in range-bound zones.
- Test different moving average parameters and combinations to find the optimal settings.
The Dual Moving Average strategy can be further optimized in the following aspects:
- Add volume filter to trigger signals only when price crossover is accompanied by significant volume spike.
- Combine with Stochastic Oscillator etc. to avoid wrong signals in overbought/oversold zones.
- Test optimal moving average parameters across different products and timeframes.
- Incorporate machine learning models to judge trend direction.
- Build adaptive trading systems using deep learning and decision trees.
In summary, the Dual Moving Average strategy is very classical and practical. It combines both trend following and short term mean reversion, enabling it to ride big trends while catching reversal moves. By optimizing the models and tuning parameters properly, it can generate more reliable trading signals while maintaining simplicity and intuitiveness, thus leading to better strategy performance. Different traders can customize details of this strategy based on their own preference and market conditions.
[/trans]
Strategy Arguments
| Argument | Default | Description |
|---|---|---|
| v_input_1 | 10 | Fast MA Length |
| v_input_2 | 21 | Slow MA Length |
| v_input_3 | true | Stop Loss Percentage |
Source (PineScript)
/*backtest
start: 2023-12-31 00:00:00
end: 2024-01-07 00:00:00
period: 5m
basePeriod: 1m
exchanges: [{"eid":"Futures_Binance","currency":"BTC_USDT"}]
*/

//@version=5
strategy("Moving Average Crossover Strategy", overlay=true)

// Input parameters
fastLength = input(10, title="Fast MA Length")
slowLength = input(21, title="Slow MA Length")
stopLossPercent = input(1, title="Stop Loss Percentage")

// Calculate moving averages
fastMA = ta.sma(close, fastLength)
slowMA = ta.sma(close, slowLength)

// Plot the moving averages on the chart
plot(fastMA, color=color.blue, title="Fast MA")
plot(slowMA, color=color.red, title="Slow MA")

// Define trading signals
longCondition = ta.crossover(fastMA, slowMA)
shortCondition = ta.crossunder(fastMA, slowMA)

// Execute trades
strategy.entry("Long", strategy.long, when=longCondition)
strategy.entry("Short", strategy.short, when=shortCondition)

// Implement stop loss
strategy.exit("Stop Loss/Profit", from_entry="Long", loss=close * stopLossPercent / 100, profit=close * 2)

// Plot buy and sell signals on the chart
plotshape(series=longCondition, title="Buy Signal", color=color.green, style=shape.labelup, location=location.belowbar)
plotshape(series=shortCondition, title="Sell Signal", color=color.red, style=shape.labeldown, location=location.abovebar)
Detail
https://www.fmz.com/strategy/438048
Last Modified
2024-01-08 15:59:34