Name
一种只做多头的布林带突破追踪策略The-Bollinger-Band-breakout-strategy-is-a-long-only-momentum-chasing-strategy
Author
ChaoZhang
Strategy Description
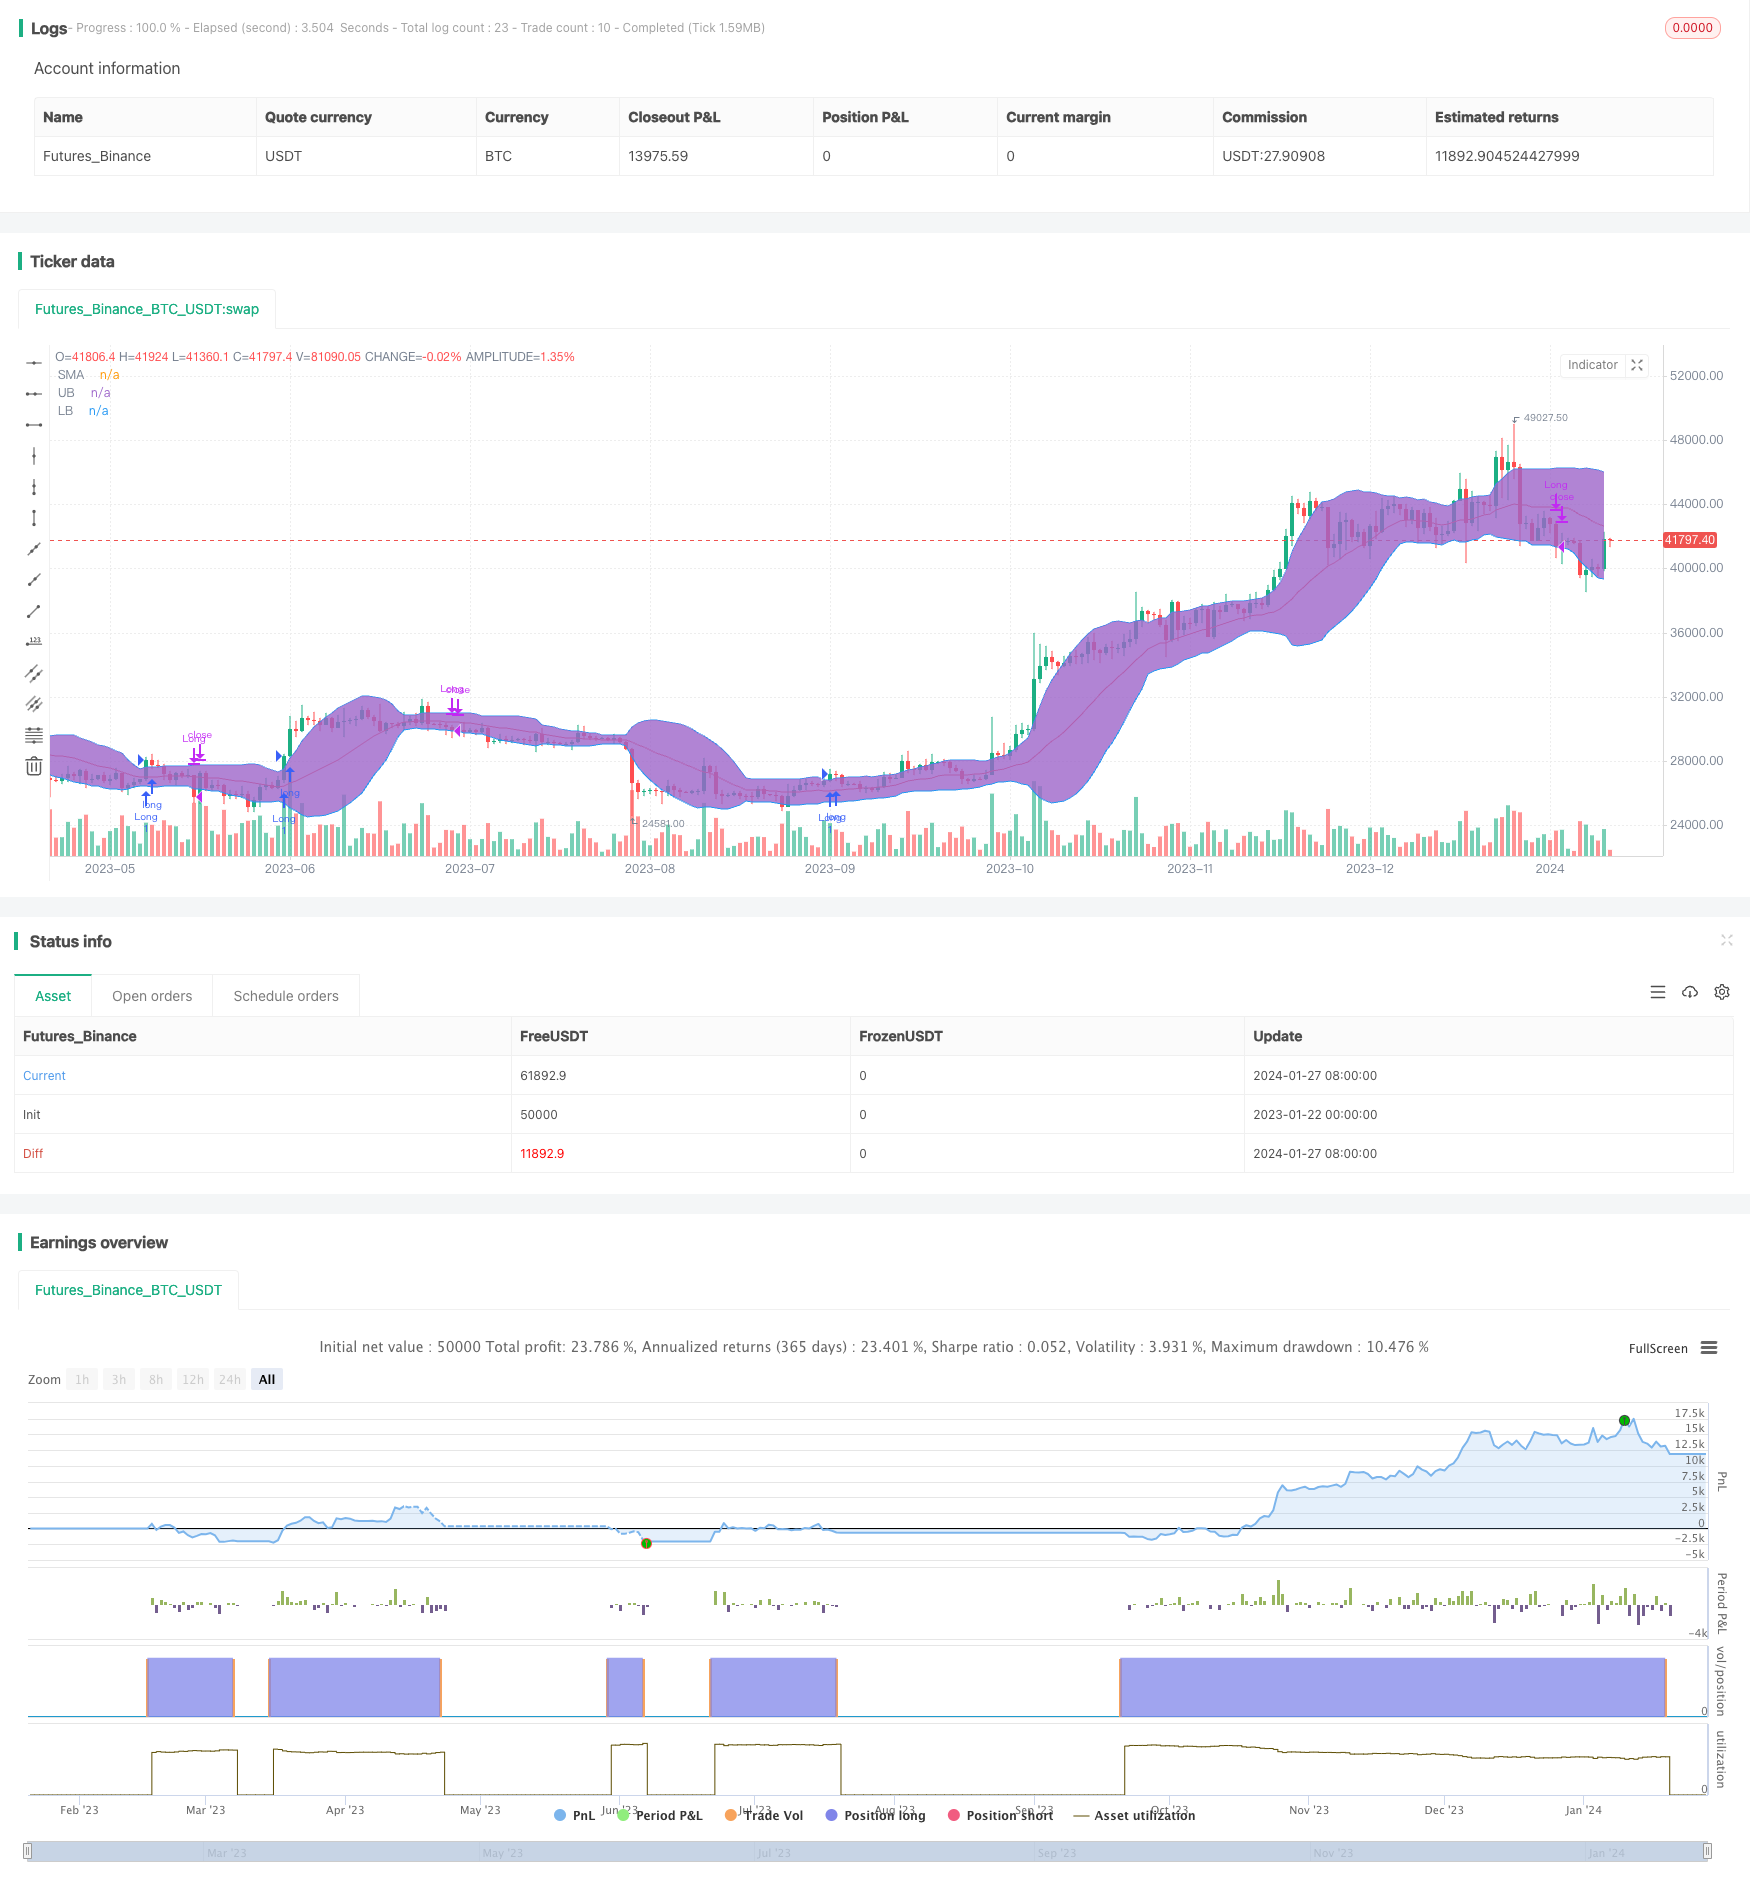
布林带突破策略是一种只做多头的momentum追踪策略。它利用布林带的上轨和下轨来判断价格动能,并在价格突破上轨时做多,在价格跌破下轨或移动平均线时平仓。
该策略首先计算N日移动平均线作为基准线,然后在基准线上下各添加K倍标准差构建上轨和下轨,从而形成布林带。当价格突破上轨时,表示价格出现向上突破,属于金叉信号,此时策略会开仓做多;当价格跌破下轨或移动平均线时,表示价格出现向下回落,属于死叉信号,此时策略会平仓清仓。
由于布林带上轨和下轨能够动态地包含价格数据的大部分分布,所以它们代表了当前市场价格的合理波动范围。当价格突破该合理波动范围,就意味着市场出现异常,需要及时调整仓位。这就是该策略的基本判断逻辑。
该策略有以下几个优势:
- 能够有效捕捉价格趋势,及时追踪市场momentum
- 利用布林带判断异常突破,不易假突破
- 规则清晰易执行,容易量化实现
- 可根据市场波动率选取合适的参数,优化策略
该策略也存在一些风险:
- 市场出现剧烈波动时,布林带判断会失效
- 无法判断市场实际趋势,可能追高杀跌
- 存在一定的时间滞后
- 没有考虑交易成本,实际操作效果会打折扣
为了控制这些风险,可以结合趋势判断指标,譬如MACD;也可以适当调整参数,缩小布林带范围来降低错误信号。
该策略还可以从以下几个方向进行优化:
- 结合交易量指标判断真实突破
- 利用自适应布林带实时优化参数
- 结合止损策略,控制单笔损失
- 增加持仓优化机制,根据市场情况动态调整仓位
通过以上几点优化,可以进一步提高策略稳定性,并减少交易风险。
布林带突破策略整体来说是一种较为经典的追踪趋势策略。它有比较清晰的判断逻辑和易操作的特点,适合量化交易。但也存在一定缺陷,需要进一步优化以适应复杂多变的市场环境。如果能与其他指标和策略机制有效结合,就能大幅提高效果。
||
The Bollinger Band breakout strategy is a long-only momentum chasing strategy. It uses the upper and lower bands of Bollinger Bands to judge price momentum and goes long when price breaks out above the upper band and closes position when price breaks down the lower band or moving average.
The strategy first calculates N-day moving average as the baseline, then adds and subtracts K times standard deviation above and below the baseline to construct upper and lower bands, forming Bollinger Bands. When price breaks out above the upper band, it signals an upward breakout, which is a golden cross signal. The strategy will open long position on this signal. When price breaks down the lower band or moving average, it signals a downward reversal, which is a death cross signal. The strategy will close out positions on this signal.
Since the upper and lower bands of Bollinger Bands can dynamically contain most of the distribution of price data, they represent the reasonable fluctuation range of current market prices. When price breaks through this reasonable fluctuation range, it means something unusual is happening in the market and positions need to be adjusted accordingly. This is the basic logic of the strategy.
The strategy has the following advantages:
- Can effectively capture price trends and timely chase market momentum
- Uses Bollinger Bands to judge abnormal breakouts, avoiding false breakouts
- Clear rules easy to implement and automate
- Parameters can be optimized according to market volatility to improve strategy
The strategy also has some risks:
- Bollinger Bands may fail when extreme volatility occurs
- Cannot determine actual market trend, may buy high and sell low
- Has some time lag
- Ignores trading costs, actual performance will be discounted
To control these risks, we can incorporate trend indicators like MACD, or properly adjust parameters to narrow Bollinger Bands to reduce bad signals.
The strategy can also be optimized from the following aspects:
- Incorporate trading volume to judge true breakouts
- Use adaptive Bollinger Bands to dynamically optimize parameters
- Add stop loss mechanisms to control single loss
- Increase position management to dynamically adjust positions based on market conditions
Through the above optimizations, we can further improve the stability of the strategy and reduce trading risks.
In summary, the Bollinger Band breakout strategy is a rather classic trend chasing strategy. It has clear logic and easy automation. But there are still some flaws, requiring further optimizations to adapt to complex changing market environments. If combined properly with other indicators and mechanisms, the results can be greatly improved.
[/trans]
Strategy Arguments
| Argument | Default | Description |
|---|---|---|
| v_input_1 | 20 | Period |
| v_input_2 | 1.5 | Standard Deviation |
| v_input_3 | true | Exit Option |
Source (PineScript)
/*backtest
start: 2023-01-22 00:00:00
end: 2024-01-28 00:00:00
period: 1d
basePeriod: 1h
exchanges: [{"eid":"Futures_Binance","currency":"BTC_USDT"}]
*/

// This source code is subject to the terms of the Mozilla Public License 2.0 at https://mozilla.org/MPL/2.0/
// © Senthaamizh

//@version=4
strategy(title="Bollinger Band Breakout", shorttitle = "BB-BO", overlay=true)
source = close
length = input(20, minval=1, title = "Period") //Length of the Bollinger Band
mult = input(1.5, minval=0.001, maxval=50, title = "Standard Deviation") // Use 1.5 SD for 20 period MA; Use 2 SD for 10 period MA
exit = input(1, minval=1, maxval=2,title = "Exit Option") // Use Option 1 to exit using lower band; Use Option 2 to exit using moving average

basis = sma(source, length)
dev = mult * stdev(source, length)

upper = basis + dev
lower = basis - dev

if (crossover(source, upper))
    strategy.entry("Long", strategy.long, qty=1)

if(exit==1)
    if (crossunder(source, lower))
        strategy.close("Long")

if(exit==2) //basis is good for N50 but lower is good for BN (High volatility)
    if (crossunder(source, basis))
        strategy.close("Long")

plot(basis, color=color.red,title= "SMA")
p1 = plot(upper, color=color.blue,title= "UB")
p2 = plot(lower, color=color.blue,title= "LB")
fill(p1, p2)
Detail
https://www.fmz.com/strategy/440308
Last Modified
2024-01-29 11:05:29