Name
一种趋势跟踪动态通道突破策略Dynamic-Channel-Breakout-Strategy
Author
ChaoZhang
Strategy Description
动态通道突破策略是一种趋势跟踪策略。该策略使用Donchian通道指标来动态确定突破买入和卖出价格,结合波动率ATR指标设定止损点,实现交易信号生成和止损退出的全自动化。
Donchian通道是一个动态通道指标,通过计算过去一定周期内的最高价和最低价,形成上轨和下轨。上轨线为过去n周期内的最高价,下轨线为过去n周期内的最低价。 Donchian通道反映了市场的波动范围和潜在趋势。
该策略设置Donchian通道周期为20天。当价格突破上轨时产生买入信号,表明行情进入上涨趋势;当价格跌破下轨时产生卖出信号,表明行情进入下跌趋势。
ATR指标是平均真实波幅(Average True Range)的缩写,它反映了某一资产最近一段时间内的平均波动幅度。ATR可以自动适应市场波动频率的变化,从而更准确地反映市场最近期的实际波幅。
该策略采用20日ATR指标计算止损点。ATR数值越大表示市场波动越大,设置的止损点就越远。这可以防止止损点过于接近,被市场小幅波动击出。
当价格上穿Donchian通道中线时,产生买入信号;当价格下穿Donchian通道中线时,产生卖出信号。这表明价格开始突破该通道,进入新一轮的趋势。
同时,结合ATR指标计算的止损点,当亏损达到止损点时主动止损退出仓位,控制风险。
Donchian通道是一种趋势跟踪指标。该策略通过动态调整通道范围,能够自动跟踪市场趋势的变化,进而产生买入和卖出信号。这避免了人工判断的主观性,使交易信号的产生更加客观和可靠。
策略同时包含做多和做空规则,可以实现双边交易。这 expands 了策略适用的市场环境,在行情上涨和下跌时均可以获利。
结合ATR指标的止损机制可以有效控制单笔交易的损失。这对于量化交易尤为重要,可以保证策略在大概率事件下获得稳定的正收益。
Donchian通道策略存在一定的被套风险。当价格出现反转,重新进入通道时,如果不止损就会形成重大损失。本策略通过ATR指标的止损机制降低了该风险。
在趋势反转的时候,Donchian通道指标会产生错误信号。用户需要关注行情局势,避免在显著趋势反转来临时仍然盲目跟单。本策略中可以加入趋势判断指标等来减少该风险。
Donchian通道和ATR止损的周期参数需要优化检验,否则将产生过多错误信号。本策略中使用的是经验参数,实盘中需要根据历史数据进行参数优化。
可以加入移动平均线等趋势判断指标,避免在显著趋势反转点产生错误信号。
对Donchian通道和ATR参数进行优化,找到最佳参数组合。适当缩短通道周期可以更快捕捉趋势转折。
结合其他辅助判断指标,如K线形态、交易量变化等,可以提高信号的准确性,减少不必要的反转交易。
动态通道突破策略通过Donchian通道的上下轨来定位趋势方向,并产生交易信号。结合ATR指标的止损机制控制风险。该策略自动化程度高,适合量化交易。优化空间在于参数选择优化,以及结合其他辅助指标提升信号准确性。总体而言,该策略对市场趋势的判断准确,具有较强的实用性。
||
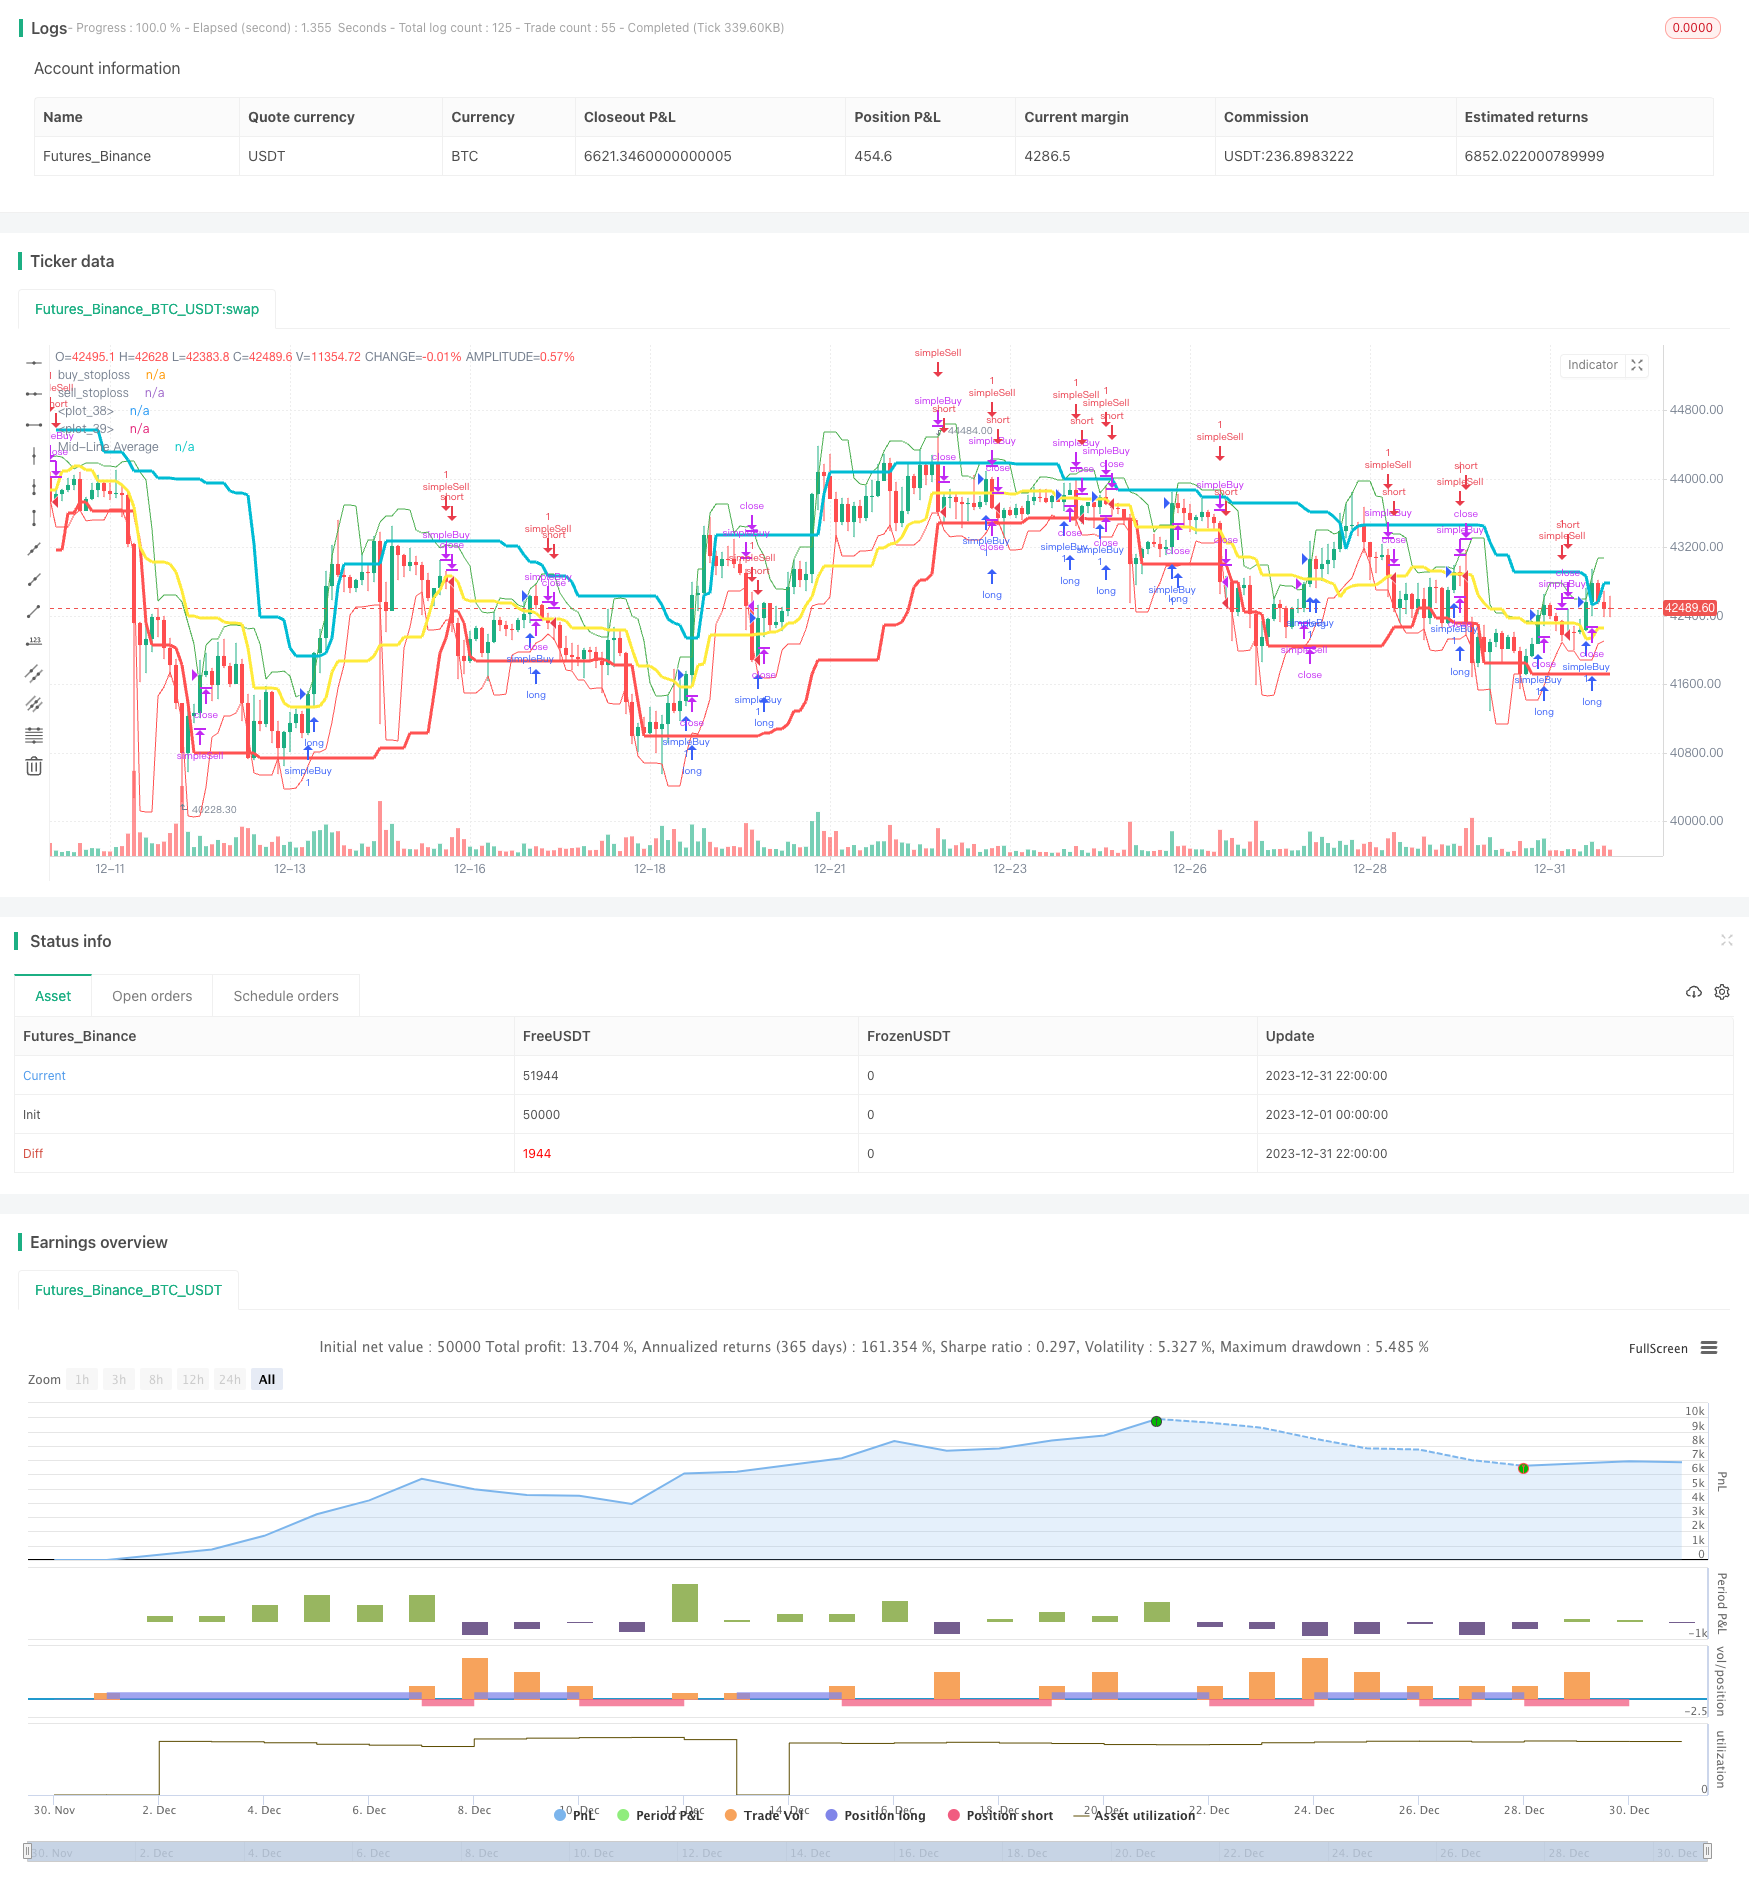
The Dynamic Channel Breakout Strategy is a trend following strategy. It uses the Donchian Channel indicator to dynamically determine the breakout buy and sell prices, combines the ATR indicator to set stop loss points, and achieves full automation of trade signal generation and stop loss exits.
The Donchian Channel is a dynamic channel indicator that forms upper and lower bands by calculating the highest and lowest prices over a certain period in the past. The upper band is the highest price in the past n periods, and the lower band is the lowest price in the past n periods. The Donchian Channel reflects the fluctuation range and potential trend of the market.
This strategy sets the Donchian Channel period to 20 days. When the price breaks through the upper rail, a buy signal is generated, indicating that the market has entered an upward trend. When the price falls below the lower rail, a sell signal is generated, indicating that the market has entered a downward trend.
The ATR indicator is the abbreviation for Average True Range, which reflects the average fluctuation amplitude of a certain asset over a recent period of time. ATR can automatically adapt to changes in market volatility frequency to more accurately reflect the actual volatility of the market in the recent period.
This strategy uses the 20-day ATR indicator to calculate the stop loss point. The larger the ATR value, the greater the market fluctuation, and the farther the set stop loss point. This prevents the stop loss point from being too close and knocked out by minor market fluctuations.
When the price breaks through the middle line of the Donchian Channel upwards, a buy signal is generated. When the price breaks through the middle line downwards, a sell signal is generated. This indicates that the price has started to break through this channel and enter a new round of trend.
At the same time, combined with the stop loss point calculated by the ATR indicator, when the loss reaches the stop loss point, the position will be actively stopped out to control risks.
The Donchian Channel is a trend tracking indicator. By dynamically adjusting the channel range, this strategy can automatically track changes in market trends and generate buy and sell signals accordingly. This avoids the subjectivity of manual judgment and makes the trading signals more objective and reliable.
The strategy contains both long and short rules, which allows two-way trading. This expands the market environments where the strategy can be applied, enabling profitability in both uptrend and downtrend.
The stop loss mechanism of the ATR indicator can effectively control the loss of a single trade. This is especially important for quantitative trading to ensure that strategies obtain stable positive returns in events of high probability.
The Donchian Channel strategy has some risk of being trapped. If the price reverses and re-enters the channel without a stop loss, significant losses may be incurred. The ATR stop loss mechanism in this strategy helps mitigate such risk.
At trend reversals, the Donchian Channel indicator will generate erroneous signals. The user needs to pay attention to market conditions to avoid blind trades when significant trend reversals occur. Trend judgment indicators can be added to reduce such risk.
The period parameters of both the Donchian Channel and the ATR stop loss need to be optimized, otherwise excessive incorrect signals may be generated. The parameters in this strategy are empirical. In real trading, they need to be optimized based on historical data.
Trend judgment indicators such as moving averages can be added to avoid erroneous signals at significant trend turning points.
Optimize Donchian Channel and ATR parameters to find the best combination. Appropriately shortening the channel cycle can catch trend turns faster.
Combine other auxiliary judgment indicators such as candlestick patterns and trading volume changes to improve signal accuracy and reduce unnecessary reversal trades.
The Dynamic Channel Breakout Strategy locates the trend direction through the upper and lower bands of the Donchian Channel and generates trading signals. The ATR stop loss mechanism controls the risk. This strategy has a high degree of automation and is suitable for quantitative trading. Optimization spaces lie in parameter selection optimization and combining other auxiliary indicators to improve signal accuracy. In general, this strategy judges market trends accurately and has strong practicality.
[/trans]
Strategy Arguments
| Argument | Default | Description |
|---|---|---|
| v_input_1 | 20 | ATR Length: |
| v_input_2 | 2018 | Backtest Start Year |
| v_input_3 | true | Backtest Start Month |
| v_input_4 | true | Backtest Start Day |
| v_input_5 | 2018 | Backtest Start Year |
| v_input_6 | 12 | testEndMonth |
| v_input_7 | 31 | Backtest Start Day |
| v_input_8 | 20 | Period |
Source (PineScript)
/*backtest
start: 2023-12-01 00:00:00
end: 2023-12-31 23:59:59
period: 2h
basePeriod: 15m
exchanges: [{"eid":"Futures_Binance","currency":"BTC_USDT"}]
*/

//@version=4
strategy(title = "dc",  overlay = true)
atrLength = input(title="ATR Length:", defval=20, minval=1)

testStartYear = input(2018, "Backtest Start Year")
testStartMonth = input(1, "Backtest Start Month")
testStartDay = input(1, "Backtest Start Day")
testPeriodStart = timestamp(testStartYear,testStartMonth,testStartDay,0,0)

testEndYear = input(2018, "Backtest Start Year")
testEndMonth = input(12)
testEndDay = input(31, "Backtest Start Day")
testPeriodEnd = timestamp(testStartYear,testStartMonth,testStartDay,0,0)


testPeriod() =>
    true
    //time >= testPeriodStart  ? true : false

dcPeriod = input(20, "Period")

dcUpper = highest(close, dcPeriod)[1]
dcLower = lowest(close, dcPeriod)[1]
dcAverage = (dcUpper + dcLower) / 2
atrValue=atr(atrLength)


useTakeProfit   = na
useStopLoss     = na
useTrailStop    = na
useTrailOffset  = na

Buy_stop = lowest(low[1],3) - atr(20)[1] / 3
plot(Buy_stop, color=red, title="buy_stoploss")
Sell_stop = highest(high[1],3) + atr(20)[1] / 3
plot(Sell_stop, color=green, title="sell_stoploss")

plot(dcLower, style=line, linewidth=3, color=red, offset=1)
plot(dcUpper, style=line, linewidth=3, color=aqua, offset=1)

plot(dcAverage, color=yellow, style=line, linewidth=3, title="Mid-Line Average")

strategy.entry("simpleBuy", strategy.long, when=(close > dcAverage) and cross(close,dcAverage))
strategy.close("simpleBuy",when=((close < dcAverage) and  cross(close,dcAverage)) or ( close< Buy_stop))

strategy.entry("simpleSell", strategy.short,when=(close < dcAverage) and cross(close,dcAverage) )
strategy.close("simpleSell",when=((close > dcAverage) and cross(close,dcAverage)) or ( close > Sell_stop))

//strategy.exit("Exit simpleBuy", from_entry = "simpleBuy", profit = useTakeProfit, loss = useStopLoss, trail_points = useTrailStop, trail_offset = useTrailOffset)
//strategy.exit("Exit simpleSell", from_entry = "simpleSell", profit = useTakeProfit, loss = useStopLoss, trail_points = useTrailStop, trail_offset = useTrailOffset)
Detail
https://www.fmz.com/strategy/439076
Last Modified
2024-01-17 15:29:55