Name
三内下反转策略Three-Inside-Down-Reversal-Strategy
Author
ChaoZhang
Strategy Description
[trans]
三内下反转策略是一种识别股价反转信号的技术分析策略。它由三根K线组成,先是一个包含了较长上影线的阳线,紧接着是一个完全包含了前一根K线实体的阴线,最后一根K线开盘价低于前一根K线的收盘价。这表明价格在经历上涨后,在该水平遇到了较强的抛盘压力,预示着向下反转的可能。
三内下反转策略判断规则如下:
- K线1:较长上影线的阳线,该阳线的最高价和开盘价之间的差值相对实体部分为较大
- K线2:完全包含了前一根K线实体的阴线,该阴线的最低价需要低于前一阳线的最低价
- K线3:开盘价低于K线2的收盘价,且收盘价也低于K线2的最低价
满足以上三个条件时,表明价格在上涨过程中遇到了较强卖压,可能发生向下反转。此时策略会在K线3开盘时打开多单,并设置止损位和止盈位。具体开仓、止损和止盈逻辑如下:
开仓逻辑: 当三根K线满足上述判断规则时,在第三根K线(K线3)的开盘价开多单
止损逻辑: 持仓价格下跌至止损位时,平掉多单止损
止盈逻辑: 持仓价格上涨至止盈位时,平掉多单止盈
三内下反转策略的主要优势有:
-
交易信号明确,容易判断。三内下的形态特征非常明显,容易识别,避免漏单。
-
成功率较高。这种价格形态往往预示着市场情绪和主流方向的转变,打开仓位的成功率较高。
-
风险可控。有清晰的止损逻辑,可以将单笔损失控制在一定范围,避免爆仓。
-
适应性强。适用于大多数品种和时间周期,特别是对中短线操作而言,效果较好。
三内下反转策略也存在一定的风险,主要有:
-
可能发生止损。反转信号也有失效的可能性,此时会触发止损退出。
-
期限风险。如果反转持续时间过长,会面临更多的资金成本。
-
参数设定风险。止损位和止盈位的设置会影响实际损益,需要谨慎评估。
-
频繁交易风险。反转次数多了也会增加交易成本和心理压力。
三内下反转策略可以从以下几个方面进行优化:
-
结合交易量指标。增加交易量的判断规则,避免虚假信号。
-
调整参数设置。评估不同品种和周期下的最优止损、止盈参数。
-
加入过滤条件。结合其它指标避免在盘整期间的失效交易。
-
优化开仓timing。判断第三根K线开盘后的价格动向,寻找更优入场点位。
三内下反转策略通过识别价格在上涨中遇到卖压而有可能发生反转的K线形态,在反转初期阶段打开仓位,实现对股价反转的捕捉。这是一种风险可控、简单实用的技术分析策略,可谓量化交易的“定番菜单”之一。它具有识别信号高效、交易规则清晰的优点,也需要注意可能面临的止损和持仓风险,在实践中需要对策略参数进行评估和优化,从而获得更好的策略表现。
||
The Three Inside Down Reversal strategy is a technical analysis strategy that identifies reversal signals in stock prices. It consists of three candlesticks, starting with a bullish candle with a long upper shadow, followed by a bearish candle that completely engulfs the body of the previous one, and completed with a third candle whose opening price is below the previous closing price. This indicates that after rising, the price encountered strong selling pressure at this level, signaling a possible downward reversal.
The judgment rules of the Three Inside Down Reversal strategy are:
-
Candlestick 1: A bullish candle with a relatively long upper shadow, which means a large difference between its highest price and opening price compared to its real body.
-
Candlestick 2: A bearish candle that completely engulfs the real body of the previous candle, with its lowest price below that of candlestick 1.
-
Candlestick 3: Its opening price is lower than the closing price of candlestick 2, and its closing price is also lower than the lowest price of candlestick 2.
When the above three conditions are met, it indicates that strong selling pressure has emerged during an upward price movement, and a downward reversal may occur. The strategy will then open a long position at the opening price of candlestick 3, with a stop loss and take profit set. The specific logic for entry, stop loss and take profit is:
Entry Logic: Open long position at the opening price of candlestick 3 when the above rules are met.
Stop Loss Logic: Close long position for stop loss when price falls to stop loss level.
Take Profit Logic:
Close long position for profit when price rises to take profit level.
The main advantages of the Three Inside Down Reversal strategy are:
-
Clear trading signals that are easy to judge. The pattern features of Three Inside Down are very obvious and easy to identify, avoiding missing trades.
-
Relatively high success rate. This price pattern often signifies a change in market sentiment and mainstream direction, leading to a high success rate for opening positions.
-
Controllable risk. There is a clear stop loss logic that limits single loss within a range, avoiding account blowups.
-
Strong adaptability. It is applicable to most varieties and timeframes, and works especially well for medium and short-term trading.
There are also some risks in the Three Inside Down Reversal strategy:
-
Potential stop loss being triggered. There is still a chance of failure for reversal signals, which would trigger the stop loss.
-
Time limitation risk. If the reversal process lasts too long, there will be higher capital costs.
-
Risk from parameter setting. Stop loss and take profit settings impact actual P&L, requiring prudent evaluation.
-
Risk from frequent trading. Higher trade count leads to increased transaction costs and psychological pressure.
The Three Inside Down Reversal strategy can be optimized from the following aspects:
-
Combine with trading volume indicators. Adding volume criteria avoids false signals.
-
Adjust parameter settings. Evaluate optimal stop loss and take profit parameters across different products and timeframes.
-
Add filter conditions. Incorporate other indicators to avoid invalid trades during consolidation periods.
-
Optimize entry timing. Assess price action after opening of the third candlestick and find better entry points.
The Three Inside Down Reversal strategy aims to open positions during the initial stage of potential price reversals by identifying candlestick patterns representing the emergence of selling pressure interrupting an upward price movement. This is a risk-controllable, simple and practical technical analysis strategy that is essential in the toolbox of quantitative trading. It has the advantage of efficiently spotting trading signals and having clear trading rules, but also needs to pay attention to risks like stop loss and holding periods during practical implementation. Further evaluations and optimizations of the strategy parameters can lead to better strategy performance.
[/trans]
Strategy Arguments
| Argument | Default | Description |
|---|---|---|
| v_input_1 | 40 | Take Profit pip |
| v_input_2 | 20 | Stop Loss pip |
Source (PineScript)
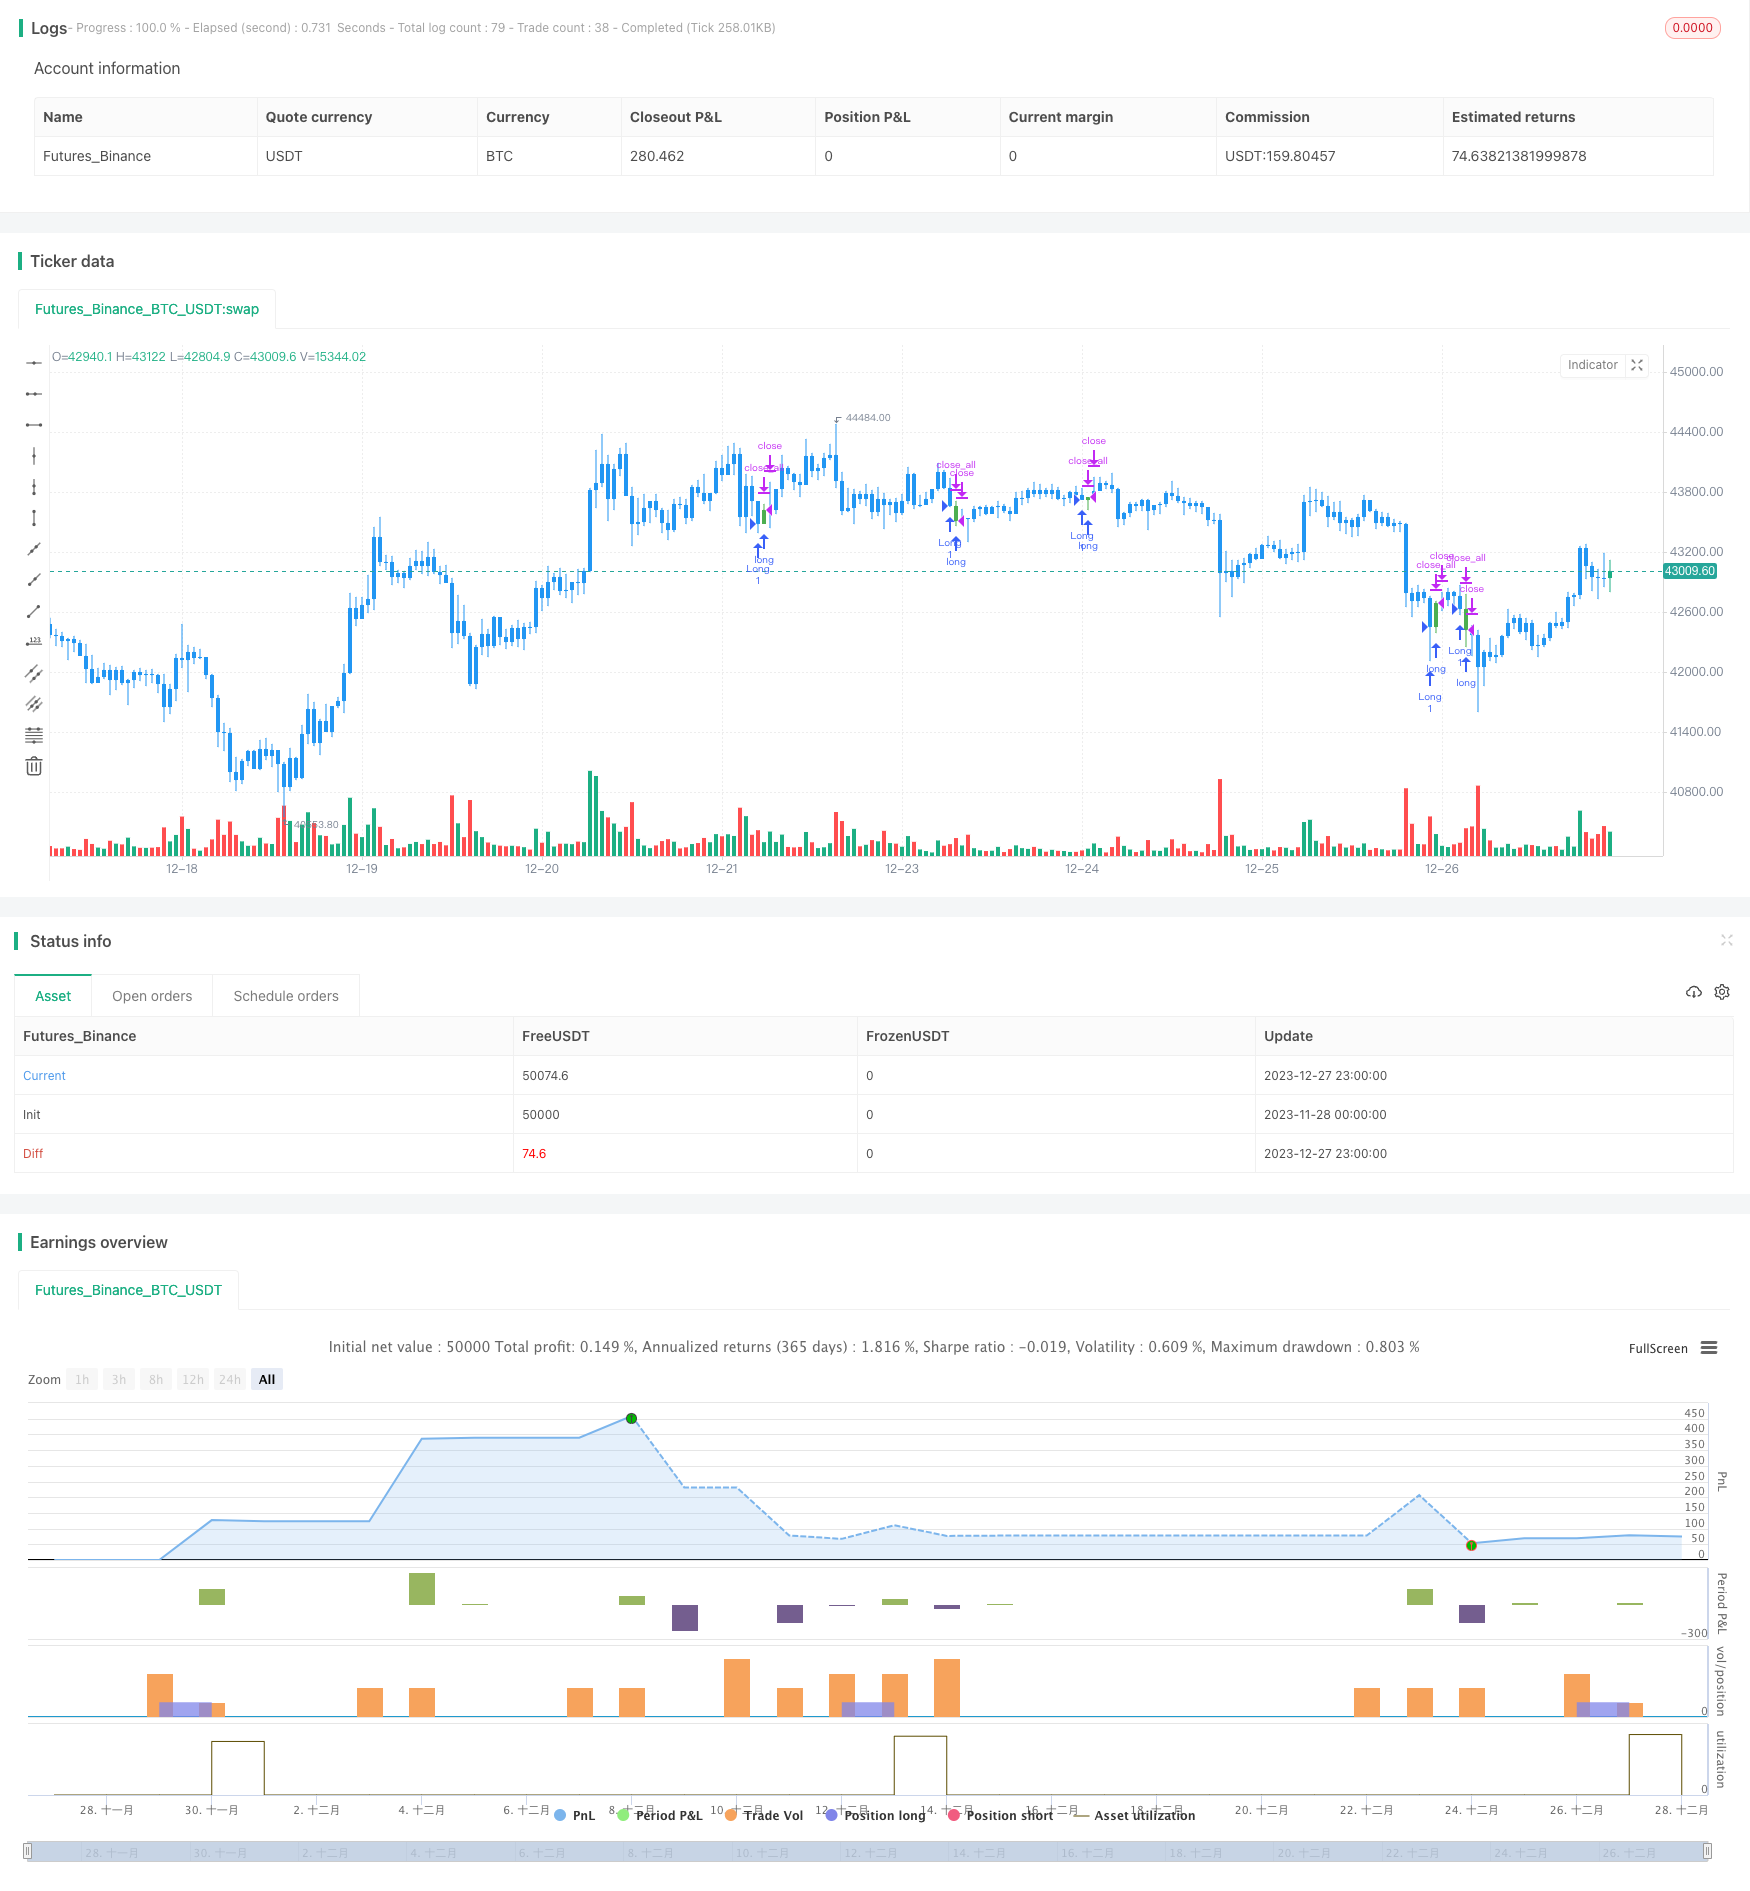
/*backtest
start: 2023-11-28 00:00:00
end: 2023-12-28 00:00:00
period: 1h
basePeriod: 15m
exchanges: [{"eid":"Futures_Binance","currency":"BTC_USDT"}]
*/

//@version=3
////////////////////////////////////////////////////////////
//  Copyright by HPotter v1.0 06/02/2019
//    This is a three candlestick bearish reversal pattern consisting of a bearish
//    harami pattern formed by the first 2 candlesticks then followed by down
//    candlestick with a lower close than the prior candlestick.
// WARNING:
// - For purpose educate only
// - This script to change bars colors.
////////////////////////////////////////////////////////////
strategy(title = "Three Inside Down Backtest", overlay = true)
input_takeprofit = input(40, title="Take Profit pip", step=0.01)
input_stoploss = input(20, title="Stop Loss pip", step=0.01)
barcolor(close[2] > open[2] ? open[1] > close[1] ? open[1] <= close[2] ? open[2] <= close[1] ? open[1] - close[1]< close[2] - open[2] ? close < open ? close < close[1] ? open < open[1] ? close < open[2] ? yellow :na :na : na : na : na:na : na : na : na)
posprice = 0.0
pos = 0.0
barcolor(nz(pos[1], 0) == -1 ? red: nz(pos[1], 0) == 1 ? green : blue )
posprice :=  close[2] > open[2] ? open[1] > close[1] ? open[1] <= close[2] ? open[2] <= close[1] ? open[1] - close[1]< close[2] - open[2] ? close < open ? close < close[1] ? open < open[1] ? close < open[2] ? close :nz(posprice[1], 0) :nz(posprice[1], 0) : nz(posprice[1], 0) : nz(posprice[1], 0) :nz(posprice[1], 0):nz(posprice[1], 0):nz(posprice[1], 0):nz(posprice[1], 0):nz(posprice[1], 0)
pos := iff(posprice > 0, 1, 0)
if (pos == 0)
    strategy.close_all()
if (pos == 1)
    strategy.entry("Long", strategy.long)
posprice := iff(high >= posprice + input_takeprofit and posprice > 0, 0 ,  nz(posprice, 0))
posprice := iff(low <= posprice - input_stoploss and posprice > 0, 0 ,  nz(posprice, 0))
Detail
https://www.fmz.com/strategy/436992
Last Modified
2023-12-29 11:09:56