Name
三移动平均线量化交易策略Triple-Moving-Average-Quantitative-Trading-Strategy
Author
ChaoZhang
Strategy Description
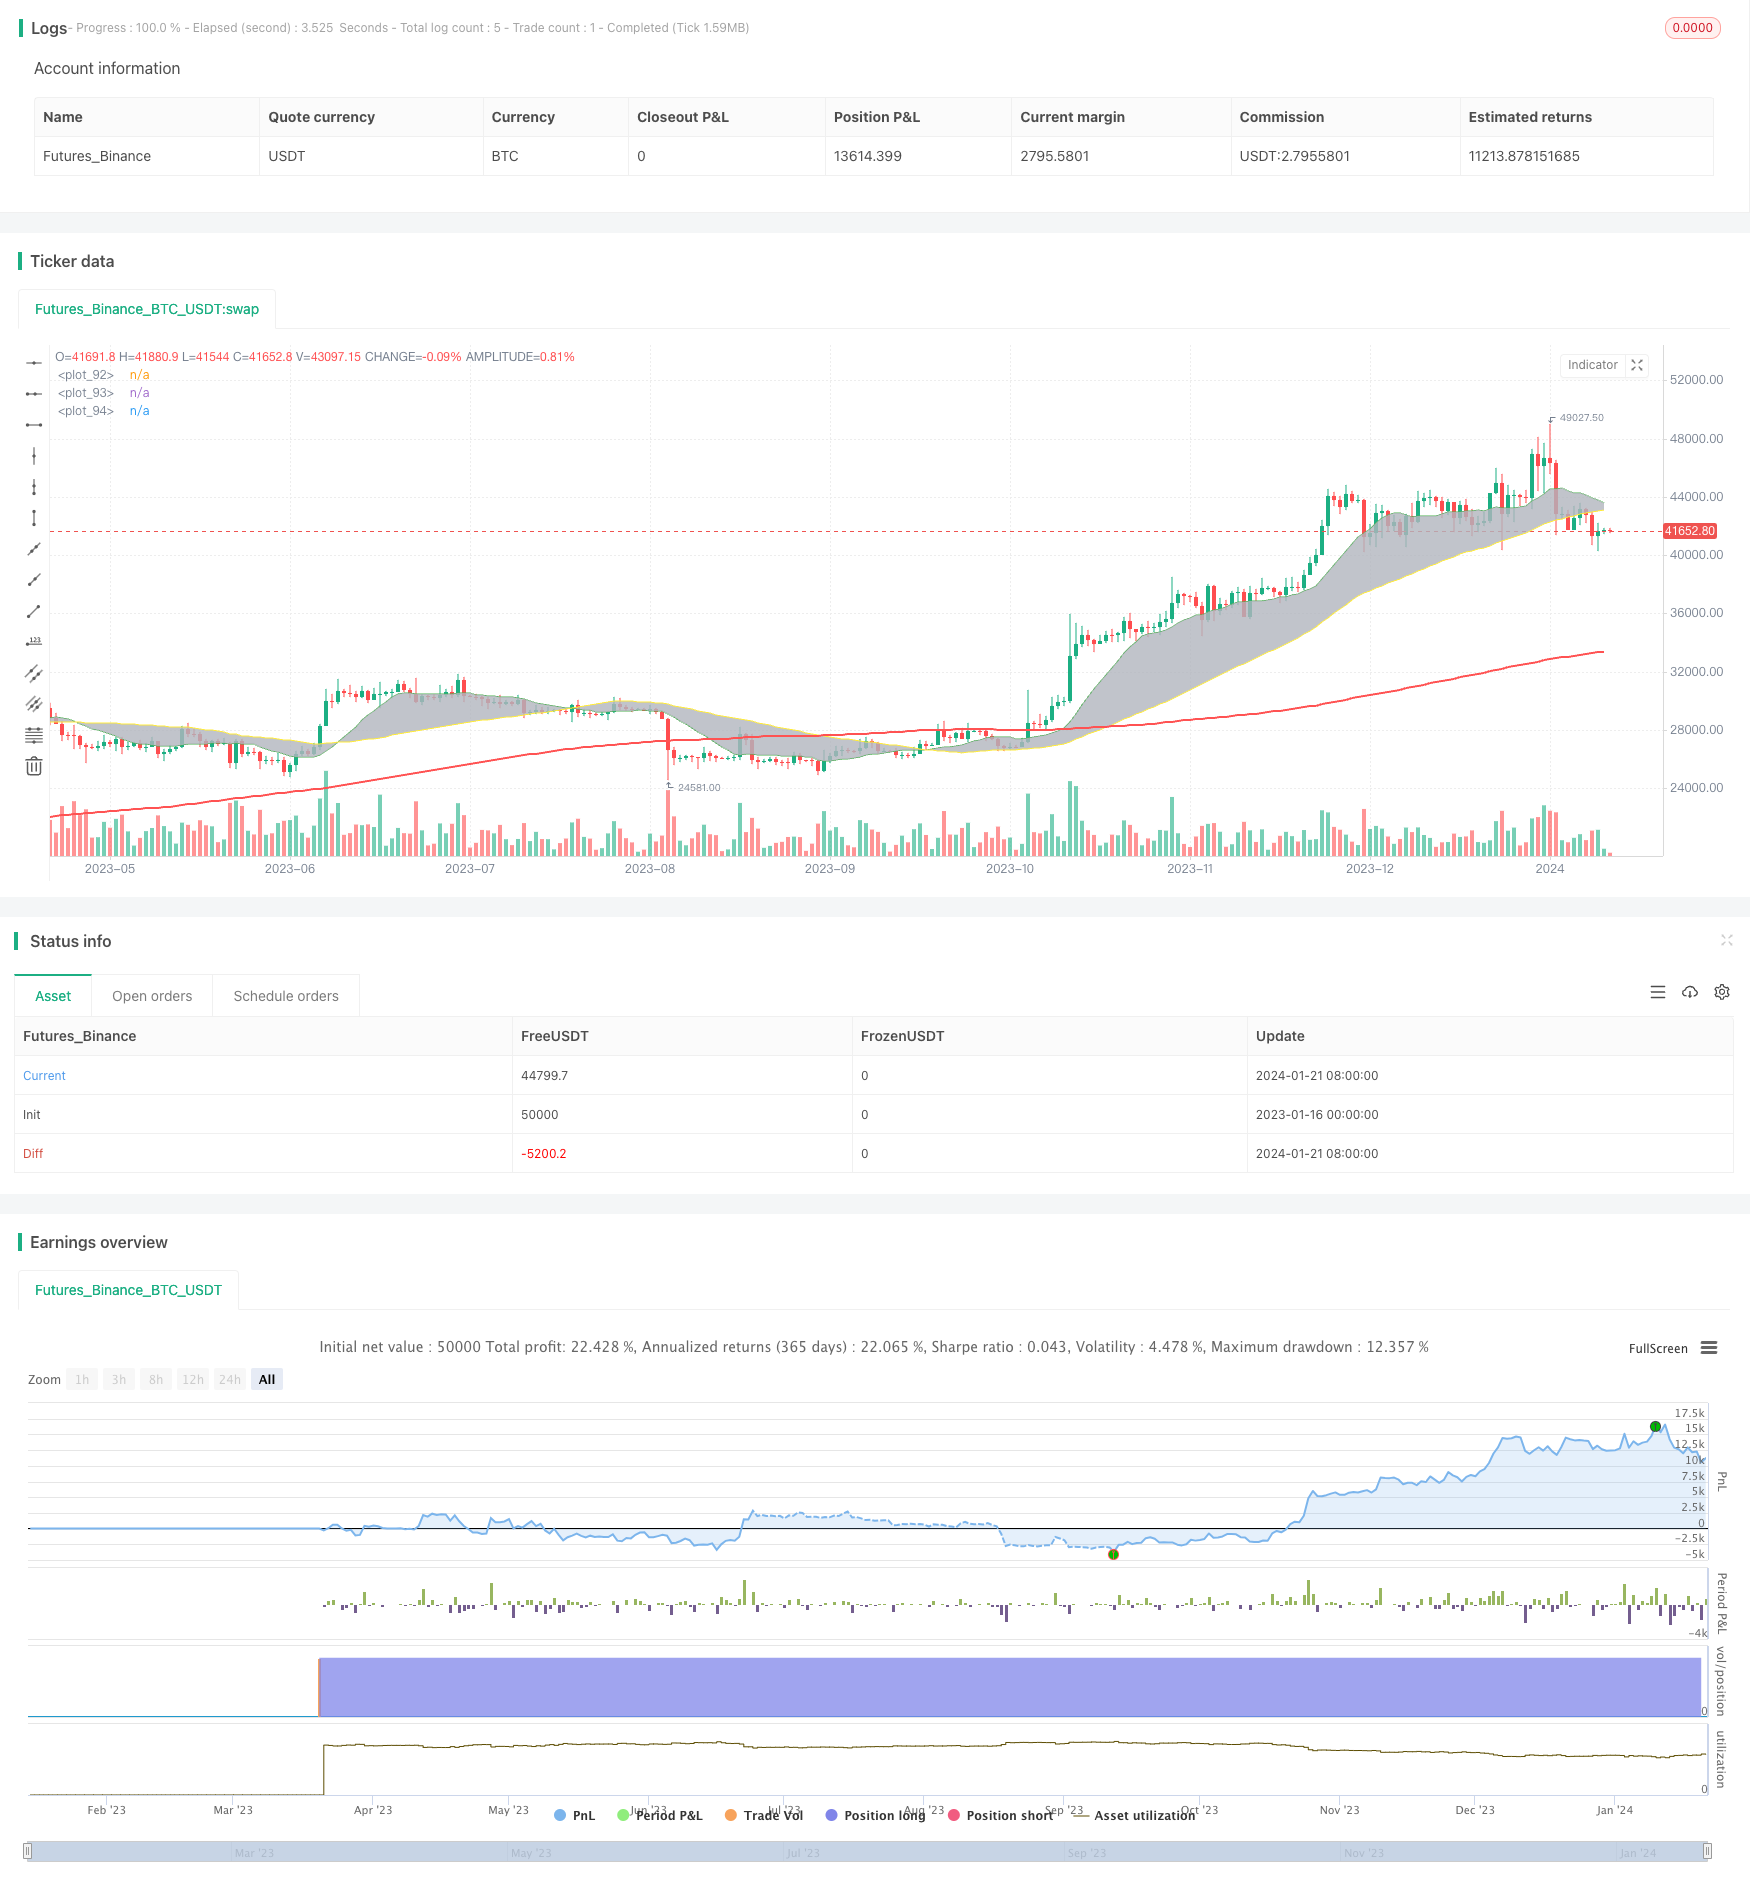
本策略通过计算三条不同周期的移动平均线,并结合价格突破形成交易信号,属于典型的趋势跟踪策略。该策略旨在跟踪市场中期趋势,通过动态调整参数可以适用于不同品种和交易环境。
该策略包含三条移动平均线:MA1、MA2和MA3。MA1和MA2之间形成交易通道,其交叉给出交易信号;MA3用于过滤信号。
当快速平均线MA1上穿中期平均线MA2时,表明短期趋势变强,这时如果价格高于长期平均线MA3,则产生做多信号;相反,如果MA1下穿MA2,并且价格低于MA3,则产生做空信号。
MA3的作用是过滤掉短期市场噪音,只在确定趋势进入中长期阶段后产生信号。该策略通过动态调整三条移动平均线的参数,可以在不同市场中寻找最佳参数组合。
- 通过多组移动平均线捕捉不同周期趋势
- MA3过滤信号,避免被套利
- 可自定义平均线类型及参数,适应性强
- 可视化交叉以识别信号点
- 大周期趋势逆转时,移动平均线交叉滞后
- 交易频率可能过高,增加交易成本和滑点风险
- 参数不当可能导致过度交易或信号指示滞后
可通过调整MA周期,优化参数选择不同品种;优化止损策略,控制单笔损失;结合其他技术指标确认信号有效性,降低误信号概率。
- 增加其他指标判断趋势,如MACD、布林带等
- 增加止损/止盈策略
- 动态调整参数,寻找最优参数组合
- 不同品种参数优化
- 考虑交易成本,优化交易频率
本策略通过计算三条移动平均线并观察交叉产生交易信号,使用快中慢配合的思路判断趋势,是一个典型的趋势跟踪策略。该策略通过参数优化可以适用于不同品种,但存在被套和错过转折点的风险。未来可通过引入其他技术指标判断信号有效性,开发动态参数优化机制等进行优化,使策略更具弹性。
||
This strategy generates trading signals by calculating three moving averages of different periods and combining price breakthroughs. It belongs to a typical trend-following strategy. The strategy aims to follow medium-term trends in the market and can be adapted to different products and trading environments by dynamically adjusting parameters.
The strategy contains three moving averages: MA1, MA2 and MA3. MA1 and MA2 form a trading channel, and their crossover generates trading signals; MA3 is used to filter signals.
When the fast moving average MA1 crosses above the medium-term moving average MA2, it indicates the strengthening of the short-term trend. At this time, if the price is above the long-term moving average MA3, a long signal is generated; conversely, if MA1 crosses below MA2 and the price is below MA3, a short signal is generated.
The role of MA3 is to filter out short-term market noise and only generate signals after determining that the trend has entered the medium and long term stage. By dynamically adjusting the parameters of the three moving averages, the strategy can find the optimal parameter combination in different markets.
- Capture trends of different cycles through multiple moving averages
- MA3 filters signals to avoid whipsaws
- Customizable moving average types and parameters, high adaptability
- Visualize crosses to identify signal points
- Moving averages may lag when major trend reverses
- Potentially high trading frequency, increasing trading costs and slippage risks
- Improper parameters may cause overtrading or lagging signals
Can optimize MA periods for different products; optimize stop loss to control single loss; combine other technical indicators to confirm signal validity and reduce false signals.
- Add other indicators to determine trends, e.g. MACD, Bollinger Bands, etc.
- Add stop loss/take profit strategies
- Dynamically adjust parameters to find optimal combinations
- Parameter optimization for different products
- Consider trading costs, optimize trade frequency
This strategy generates trading signals by calculating three moving averages and observing their crosses. Using the idea of combining fast, medium and slow lines to determine trends, it is a typical trend-following strategy. The strategy can be adapted to different products through parameter optimization, but risks whipsaws and missing turnings. Future improvements could introduce other technical indicators to judge signal validity, develop dynamic parameter optimization mechanisms, etc. to make the strategy more flexible.
[/trans]
Strategy Arguments
| Argument | Default | Description |
|---|---|---|
| v_input_1 | 13 | MA1 Period |
| v_input_2 | 0 | MA1 Type: SMA |
| v_input_3_close | 0 | MA1 Source: close |
| v_input_4 | true | MA1 Visible |
| v_input_5 | 50 | MA2 Period |
| v_input_6 | 0 | MA2 Type: SMA |
| v_input_7_close | 0 | MA2 Source: close |
| v_input_8 | true | MA2 Visible |
| v_input_9 | 200 | MA3 Period |
| v_input_10 | 0 | MA3 Type: SMA |
| v_input_11_close | 0 | MA3 Source: close |
| v_input_12 | true | MA3 Visible |
| v_input_13 | true | Show Crosses |
Source (PineScript)
/*backtest
start: 2023-01-16 00:00:00
end: 2024-01-22 00:00:00
period: 1d
basePeriod: 1h
exchanges: [{"eid":"Futures_Binance","currency":"BTC_USDT"}]
*/

// This source code is subject to the terms of the Mozilla Public License 2.0 at https://mozilla.org/MPL/2.0/
// © Meesemoo

//@version=4
strategy("Custom MA Strategy Tester", overlay = true)
MA1Period = input(13, title="MA1 Period")
MA1Type = input(title="MA1 Type", defval="SMA", options=["RMA", "SMA", "EMA", "WMA", "HMA", "DEMA", "TEMA"])
MA1Source = input(title="MA1 Source", type=input.source, defval=close)
MA1Visible = input(title="MA1 Visible", type=input.bool, defval=true)
MA2Period = input(50, title="MA2 Period")
MA2Type = input(title="MA2 Type", defval="SMA", options=["RMA", "SMA", "EMA", "WMA", "HMA", "DEMA", "TEMA"])
MA2Source = input(title="MA2 Source", type=input.source, defval=close)
MA2Visible = input(title="MA2 Visible", type=input.bool, defval=true)
MA3Period = input(200, title="MA3 Period")
MA3Type = input(title="MA3 Type", defval="SMA", options=["RMA", "SMA", "EMA", "WMA", "HMA", "DEMA", "TEMA"])
MA3Source = input(title="MA3 Source", type=input.source, defval=close)
MA3Visible = input(title="MA3 Visible", type=input.bool, defval=true)
ShowCrosses = input(title="Show Crosses", type=input.bool, defval=true)

MA1 = if MA1Type == "SMA"
    sma(MA1Source, MA1Period)
else
    if MA1Type == "EMA"
        ema(MA1Source, MA1Period)
    else
        if MA1Type == "WMA"
            wma(MA1Source, MA1Period)
        else
            if MA1Type == "RMA"
                rma(MA1Source, MA1Period)
            else
                if MA1Type == "HMA"
                    wma(2*wma(MA1Source, MA1Period/2)-wma(MA1Source, MA1Period), round(sqrt(MA1Period)))
                else
                    if MA1Type == "DEMA"
                        e = ema(MA1Source, MA1Period)
                        2 * e - ema(e, MA1Period)
                    else
                        if MA1Type == "TEMA"
                            e = ema(MA1Source, MA1Period)
                            3 * (e - ema(e, MA1Period)) + ema(ema(e, MA1Period), MA1Period)


MA2 = if MA2Type == "SMA"
    sma(MA2Source, MA2Period)
else
    if MA2Type == "EMA"
        ema(MA2Source, MA2Period)
    else
        if MA2Type == "WMA"
            wma(MA2Source, MA2Period)
        else
            if MA2Type == "RMA"
                rma(MA2Source, MA2Period)
            else
                if MA2Type == "HMA"
                    wma(2*wma(MA2Source, MA2Period/2)-wma(MA2Source, MA2Period), round(sqrt(MA2Period)))
                else
                    if MA2Type == "DEMA"
                        e = ema(MA2Source, MA2Period)
                        2 * e - ema(e, MA2Period)
                    else
                        if MA2Type == "TEMA"
                            e = ema(MA2Source, MA2Period)
                            3 * (e - ema(e, MA2Period)) + ema(ema(e, MA2Period), MA2Period)

MA3 = if MA3Type == "SMA"
    sma(MA3Source, MA3Period)
else
    if MA3Type == "EMA"
        ema(MA3Source, MA3Period)
    else
        if MA3Type == "WMA"
            wma(MA3Source, MA3Period)
        else
            if MA3Type == "RMA"
                rma(MA3Source, MA3Period)
            else
                if MA3Type == "HMA"
                    wma(2*wma(MA3Source, MA3Period/2)-wma(MA3Source, MA3Period), round(sqrt(MA3Period)))
                else
                    if MA3Type == "DEMA"
                        e = ema(MA3Source, MA3Period)
                        2 * e - ema(e, MA3Period)
                    else
                        if MA3Type == "TEMA"
                            e = ema(MA3Source, MA3Period)
                            3 * (e - ema(e, MA3Period)) + ema(ema(e, MA3Period), MA3Period)


p1 = plot(MA1Visible ? MA1 : na, color=color.green, linewidth=1)
p2 = plot(MA2Visible ? MA2 : na, color=color.yellow, linewidth=1)
p3 = plot(MA3Visible ? MA3 : na, color=color.red, linewidth=2)

fill(p1, p2, color.silver, transp=80, title="Fill")


start = timestamp(2019, 1, 1, 1, 0)
end = timestamp(2025, 1, 1, 1, 0)

if time >= start and time <= end
    longCondition = crossover(MA1, MA2) and close > MA3
    if (longCondition)
        strategy.entry("Long", strategy.long)

    shortCondition = crossunder(MA1, MA2) and close < MA3
    if (shortCondition)
        strategy.entry("Short", strategy.short)
Detail
https://www.fmz.com/strategy/439738
Last Modified
2024-01-23 14:20:50