Name
三重EMA随机RSI交叉金叉策略Three-EMA-Stochastic-RSI-Crossover-Golden-Cross-Strategy
Author
ChaoZhang
Strategy Description
三重EMA随机RSI交叉金叉策略是一种趋势跟踪策略。它结合了三重指数移动平均线指标和随机指数相对强弱指标,通过双重指标的交叉信号来判断入场时机。
该策略的信号判断基于以下逻辑:
-
三重EMA判断趋势:8日线在上,14日线在中,50日线在下构成多头趋势,反之构成空头趋势。
-
随机RSI指标判断交叉:K线从下方向上穿过D线产生金叉信号,表示强势进入。
-
只做多头,空头暂不考虑。
当三重EMA呈现上行趋势,且随机RSI出现金叉时,做多。在此基础上设置止损和止盈线来锁定利润。
该策略结合双重指标判断,能有效锁定趋势。主要优势如下:
-
三重EMA过滤掉短期噪音,锁定中长线趋势。
-
随机RSI金叉确认强势进入。
-
ATR智能止损止盈,锁定利润。
-
策略逻辑简单清晰,容易理解和实施。
该策略主要风险如下:
-
大盘震荡时容易被套。当三重EMA指标在震荡中产生多次金叉死叉时,会频繁开仓建仓带来交易风险。可通过优化EMA参数或增加其他过滤指标来解决。
-
没有做空机会。只做多会错过底部反弹机会。可考虑加入 MACD 等指标,在空头趋势中寻找做空机会。
该策略主要可优化的方向包括:
-
优化EMA参数,改进趋势判断。
-
增加MACD等指标,判断空头趋势,增加做空机会。
-
增加波动率指标,如ATR,改进止损止盈设定。
-
结合交易量指标,避免虚假突破。
-
利用机器学习等技术进行参数优化。
总的来说,该三重EMA随机RSI交叉策略结合双重指标判断,可以有效过滤震荡、锁定趋势,是一种简单实用的趋势跟踪策略。通过继续优化参数、增加过滤指标、利用先进技术等手段,可以获得更好的策略表现。
||
The Three EMA Stochastic RSI Crossover Golden Cross strategy is a trend following strategy. It combines the Three EMA indicator and the Stochastic Relative Strength Index to determine entry signals based on the crossover of the two indicators.
The signal determination of this strategy is based on the following logic:
-
Three EMA to determine the trend: 8-day EMA on top, 14-day EMA in the middle and 50-day EMA at the bottom form an uptrend; the reverse forms a downtrend.
-
Stochastic RSI to determine crossover: when the K line crosses above the D line from below, a golden cross signal is generated, indicating a strong uptrend.
-
Only go long; short is not considered for now.
When the Three EMA shows an uptrend and the Stochastic RSI generates a golden cross, go long. Set stop loss and take profit based on this to lock in profits.
The main advantages of this strategy with dual indicator determination are:
-
Three EMA filters out short term noise and locks in medium-long term trends.
-
Stochastic RSI golden cross confirms strong uptrend.
-
ATR smart stop loss and take profit locks in profits.
-
Simple and clear strategy logic, easy to understand and implement.
The main risks of this strategy are:
-
Vulnerable to consolidation. Frequent open/close orders bring trading risk when Three EMA generates multiple crosses in sideways markets. This can be solved by optimizing EMA parameters or adding other filters.
-
No shorting opportunities. Only longs miss bottom rebound chances. Consider adding MACD to find shorts in downtrends.
The main optimization directions include:
-
Optimize EMA parameters to improve trend determination.
-
Add MACD etc to determine downtrends and increase short chances.
-
Add volatility indicators like ATR to improve stops and limits.
-
Incorporate volume to avoid false breakouts.
-
Utilize machine learning etc for parameter optimization.
In summary, the Three EMA Stochastic RSI Crossover strategy effectively filters out consolidation and locks in trends by combining dual indicator determination, making it a simple and practical trend following strategy. Further improvements on parameters, filters, technologies will lead to better strategy performance.
[/trans]
Strategy Arguments
| Argument | Default | Description |
|---|---|---|
| v_input_1 | true | FromMonth |
| v_input_2 | true | FromDay |
| v_input_3 | 2020 | FromYear |
| v_input_4 | true | ToMonth |
| v_input_5 | true | ToDay |
| v_input_6 | 9999 | ToYear |
| v_input_7 | 3 | smoothK |
| v_input_8 | 3 | smoothD |
| v_input_9 | 14 | lengthRSI |
| v_input_10 | 14 | lengthStoch |
| v_input_11_close | 0 | RSI Source: close |
| v_input_12 | 14 | ATR Length |
| v_input_13 | 8 | EMA 1 |
| v_input_14 | 14 | EMA 2 |
| v_input_15 | 50 | EMA 3 |
| v_input_16 | 2 | Profitfactor |
| v_input_17 | 3 | Stopfactor |
Source (PineScript)
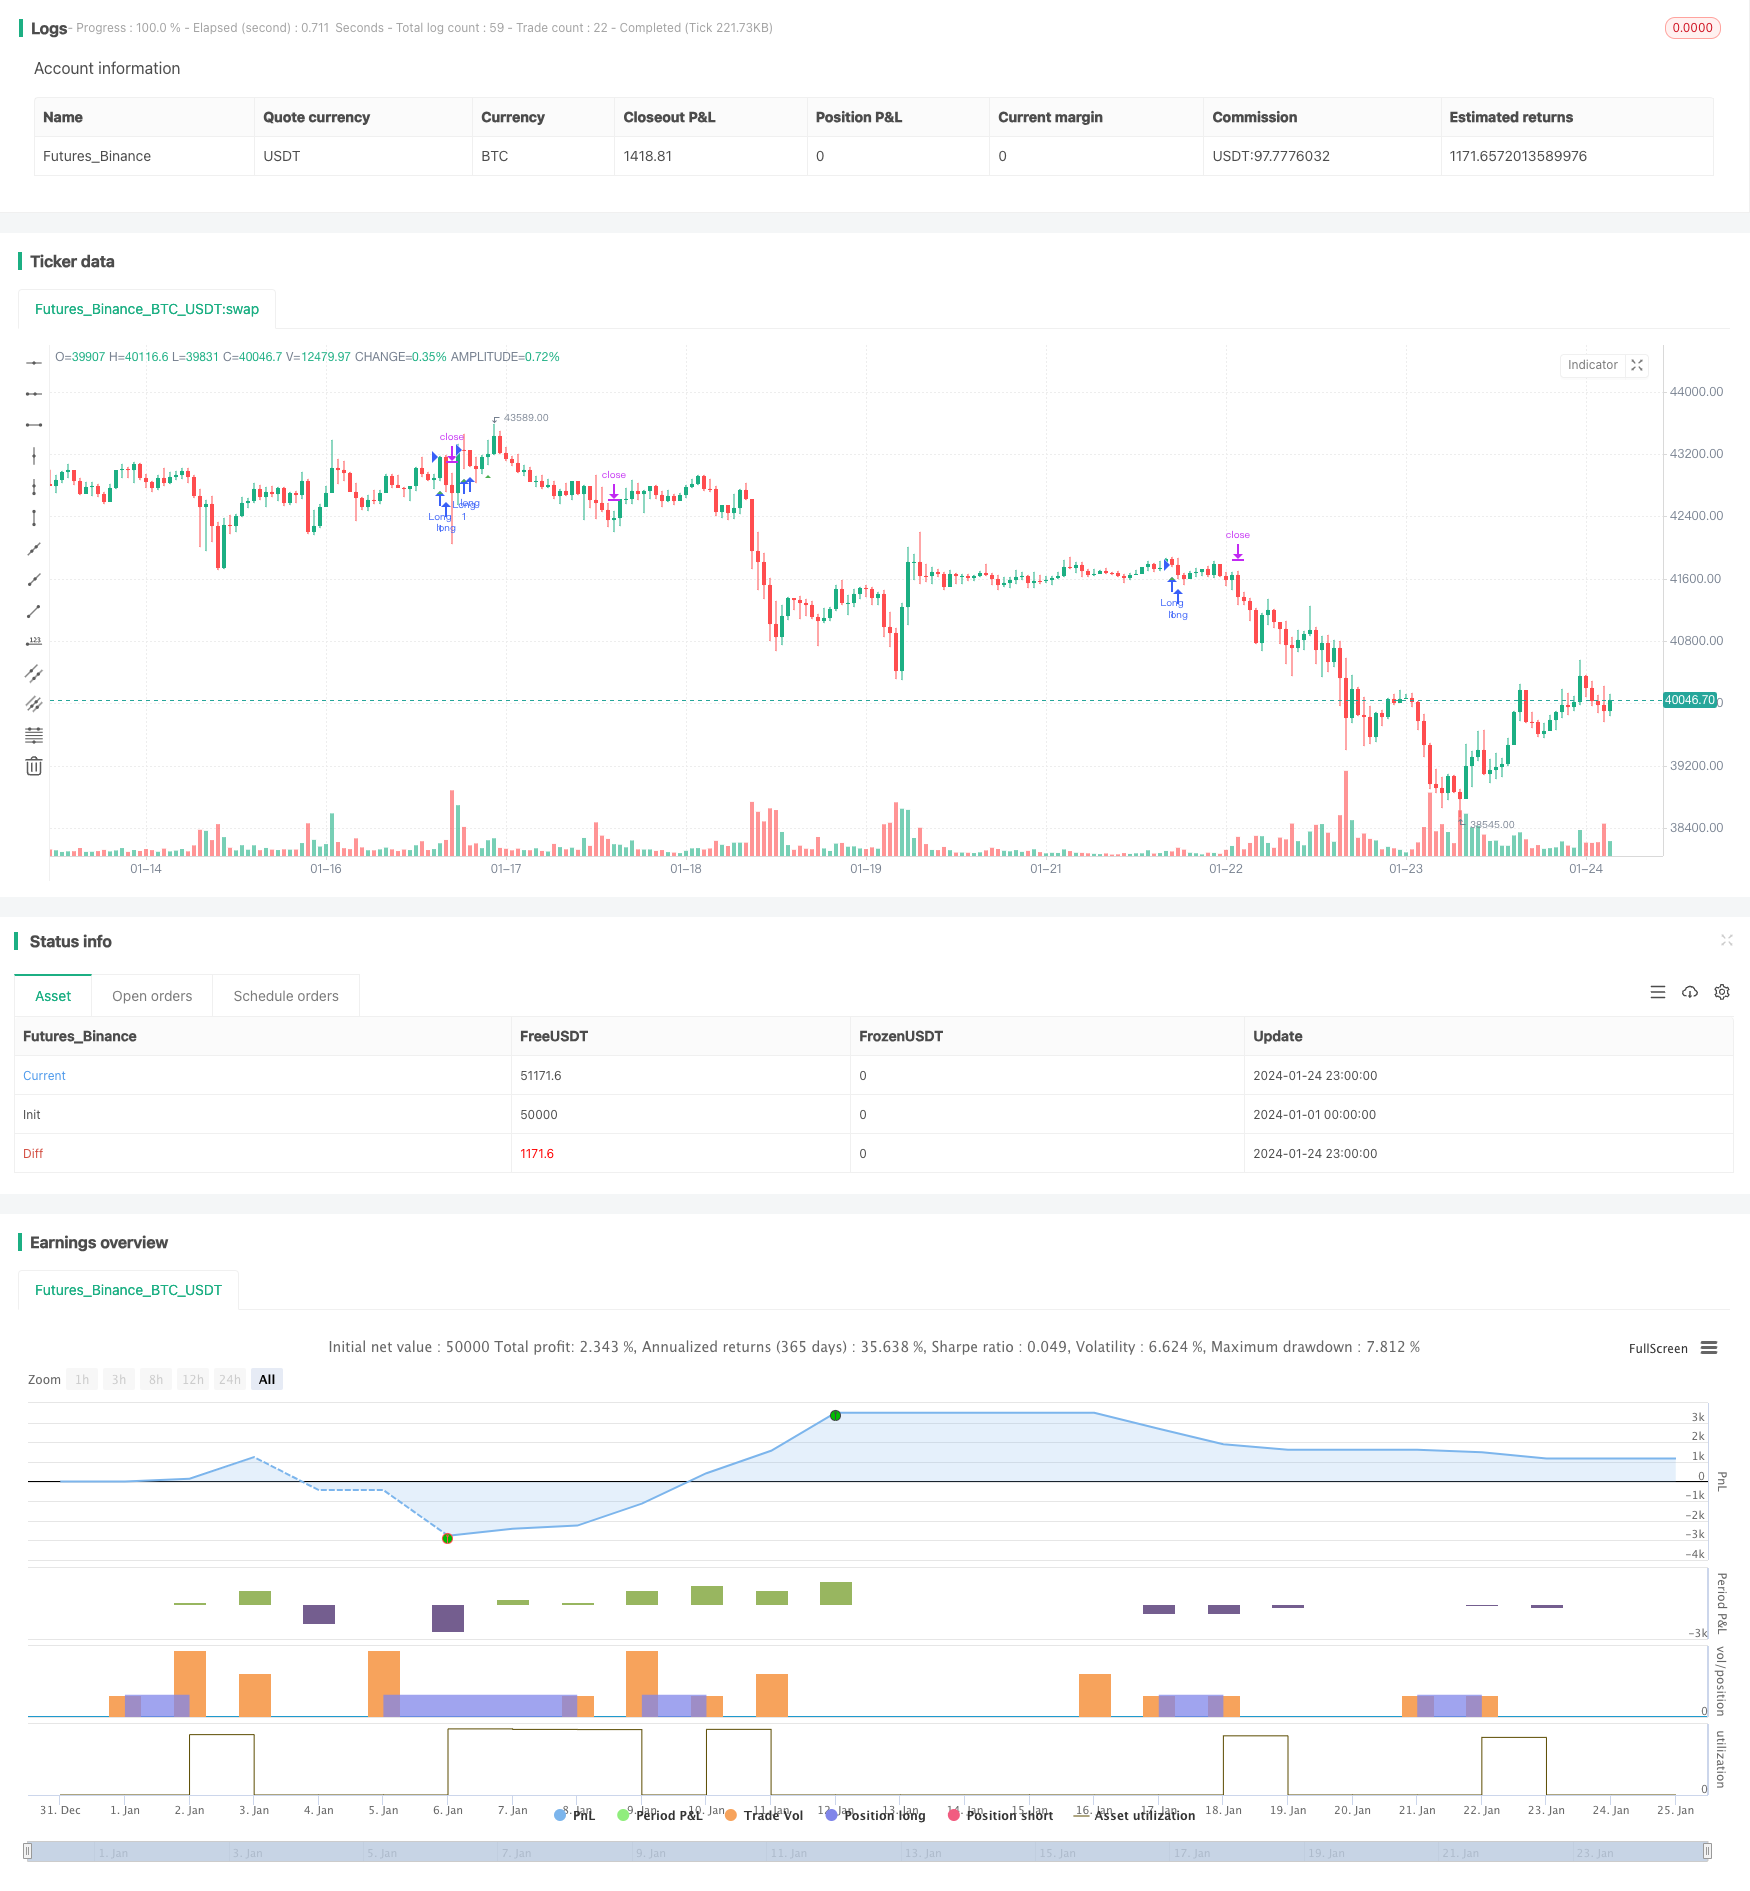
/*backtest
start: 2024-01-01 00:00:00
end: 2024-01-25 00:00:00
period: 1h
basePeriod: 15m
exchanges: [{"eid":"Futures_Binance","currency":"BTC_USDT"}]
*/

//@version=4

strategy(title="Stoch RSI Crossover Strat + EMA", shorttitle="Stoch RSI Cross + EMA Strat", overlay = true)

// Time Range
FromMonth=input(defval=1,title="FromMonth",minval=1,maxval=12)
FromDay=input(defval=1,title="FromDay",minval=1,maxval=31)
FromYear=input(defval=2020,title="FromYear",minval=2017)
ToMonth=input(defval=1,title="ToMonth",minval=1,maxval=12)
ToDay=input(defval=1,title="ToDay",minval=1,maxval=31)
ToYear=input(defval=9999,title="ToYear",minval=2017)
start=timestamp(FromYear,FromMonth,FromDay,00,00)
finish=timestamp(ToYear,ToMonth,ToDay,23,59)
window()=>true

// See if this bar's time happened on/after start date
afterStartDate = time >= start and time<=finish?true:false

//STOCH RSI
smoothK = input(3, minval=1)
smoothD = input(3, minval=1)
lengthRSI = input(14, minval=1)
lengthStoch = input(14, minval=1)
src = input(close, title="RSI Source")

rsi1 = rsi(src, lengthRSI)
k = sma(stoch(rsi1, rsi1, rsi1, lengthStoch), smoothK)
d = sma(k, smoothD)

//ATR
lengthATR = input(title="ATR Length", defval=14, minval=1)
atr = atr(lengthATR)

//MULTI EMA
emasrc = close,
len1 = input(8, minval=1, title="EMA 1")
len2 = input(14, minval=1, title="EMA 2")
len3 = input(50, minval=1, title="EMA 3")

ema1 = ema(emasrc, len1)
ema2 = ema(emasrc, len2)
ema3 = ema(emasrc, len3)

col1 = color.lime
col2 = color.blue
col3 = color.orange

//EMA Plots
//plot(ema1, title="EMA 1", linewidth=1, color=col1)
//plot(ema2, title="EMA 2", linewidth=1, color=col2)
//plot(ema3, title="EMA 3", linewidth=1, color=col3)

crossup = k[0] > d[0] and k[1] <= d[1]
emapos = ema1 > ema2 and ema2 > ema3 and close > ema1
barbuy = crossup and emapos

//plotshape(crossup, style=shape.triangleup, location=location.belowbar, color=color.white)
plotshape(barbuy, style=shape.triangleup, location=location.belowbar, color=color.green)

longloss = sma(open, 1)
//plot(longloss, color=color.red)

//Buy and Sell Factors
profitfactor = input(title="Profitfactor", type=input.float, step=0.1, defval=2)
stopfactor = input(title="Stopfactor", type=input.float, step=0.1, defval=3)
bought = strategy.position_size[1] < strategy.position_size
longcondition = barbuy

if (longcondition) and (afterStartDate) and strategy.opentrades < 1
    strategy.entry("Long", strategy.long)

if (afterStartDate) and strategy.opentrades > 0
    barsbought = barssince(bought)
    profit_level = strategy.position_avg_price + (atr*profitfactor)
    stop_level = strategy.position_avg_price - (atr*stopfactor)
    strategy.exit("Take Profit/ Stop Loss", "Long", stop=stop_level[barsbought], limit=profit_level[barsbought])
Detail
https://www.fmz.com/strategy/440102
Last Modified
2024-01-26 16:07:34