Name
价格动量追踪策略Price-Momentum-Tracking-Strategy
Author
ChaoZhang
Strategy Description
[trans]
该策略采用价格动量指标来判断交易方向。具体而言,分别计算均线和均价,当价格上穿均线和均价时产生买入信号。为过滤假信号,要求之前没有类似信号。之后保存信号状态,并结合均线判断产生最终的开仓信号。策略同时包含止损和止盈设置。
该策略主要基于价格动量指标来判断趋势方向。首先计算价格的均线和均价:
swmaClose = swma(close)
vwapClose = vwap(close)
其中,swma为运动平均线,vwap为成交量加权平均价。这二者都能反映价格平均水平。
然后比较价格与均值的大小关系,判断是否上穿均线和均价,从而判断是否属于看涨信号:
swmaLong = close > swmaClose
vwapLong = close > vwapClose
为过滤假信号,要求这两个指标之前没有给出信号:
triggerLong = vwapLong and not vwapLong[1] and not swmaLong and not swmaLong[1]
接下来保存看涨信号:
saveLong = false, saveLong := triggerLong ? true : not vwapLong ? false : saveLong[1]
最后,当保存了上穿信号,并且价格再度上穿均线时,产生开仓信号:
startLong = saveLong and swmaLong
这样可以过滤掉部分假信号,使得信号更加可靠。
策略还包含止损止盈设置。止损距离为可配置,止盈设置为止损的一定倍数。
该策略具有以下优势:
- 使用价格动量指标,能较好判断趋势方向
- 结合双重指标和多步判断,可过滤假信号,使策略更可靠
- 止损止盈设置合理,可以控制单笔交易风险
- 策略参数可配置,适应不同市场环境
- 策略逻辑简单直接,容易理解实现
该策略也存在一些风险:
- 均线指标存在滞后,可能错过部分价格波动
- 效果依赖参数设置,不同参数组合效果差异大
- 买点信号较少,存在一定漏单风险
- 多步判断会过滤部分机会,可能影响盈利水平
对策:
- 可以测试不同均线参数,优化参数设置
- 适当简化判断逻辑,增加买点信号
- 调整止损止盈比例,控制单笔损失
该策略还可以从以下方向进行优化:
- 测试更多价格动量指标,如MACD、DMI等
- 增加卖出信号判断,实现双向交易
- 结合交易量指标,避免潜在的假突破
- 根据回测结果优化参数设置
- 考虑根据市场环境自动调整参数
- 增加机器学习算法,实现参数自适应优化
这些优化可以提高策略灵活性、稳健性与盈利水平。
该价格动量追踪策略整体来说是简单直接、逻辑清晰的趋势追踪策略。策略使用价格均线和均价判断价格动量方向,并设计多步验证机制来提高信号质量。策略同时包含合理的止损止盈设定。从代码量来看,策略逻辑非常简洁,只需要20多行pine脚本即可实现。总的来说,该策略是一个非常好的学习案例,初学者可以作为量化交易战略理解的很好的起点。当然,策略本身也具有实际的交易价值,通过参数优化和功能扩展,可以成为避免噪音、跟踪趋势的实用交易系统。
||
This strategy uses price momentum indicators to determine the trading direction. Specifically, it calculates the moving average and mean price respectively. When the price crosses above the moving average and mean price, a buy signal is generated. To filter out false signals, it requires no similar previous signals. Then it saves the signal status and generates the final opening position signal in combination with the moving average. The strategy also contains stop loss and take profit settings.
The strategy mainly relies on price momentum indicators to judge the trend direction. First it calculates the moving average and mean price of the price:
swmaClose = swma(close)
vwapClose = vwap(close)
Where swma is the smoothed moving average and vwap is volume weighted average price. Both can reflect the average price level.
Then compare the price with the average to see if the price crosses above the moving average and mean price, to judge if it is a bullish signal:
swmaLong = close > swmaClose
vwapLong = close > vwapClose
To filter out false signals, it requires no previous signals from these two indicators:
triggerLong = vwapLong and not vwapLong[1] and not swmaLong and not swmaLong[1]
Next, save the bullish signal:
saveLong = false, saveLong := triggerLong ? true : not vwapLong ? false : saveLong[1]
Finally, when the saved crossing signal and the price crosses above the moving average again, generate the opening position signal:
startLong = saveLong and swmaLong
This can filter out some false signals and make the signals more reliable.
The strategy also contains stop loss and take profit settings. The stop loss distance is configurable, and the take profit is set to a certain multiple of the stop loss.
The strategy has the following advantages:
- Using price momentum indicators can better judge the trend direction
- The combination of dual indicators and multi-step verification can filter false signals and make the strategy more reliable
- The stop loss and take profit settings are reasonable to control single trade risk
- The strategy parameters are configurable to adapt to different market environments
- The strategy logic is simple and straightforward, easy to understand and implement
The strategy also has some risks:
- The moving average indicator has a lag and may miss some price fluctuations
- The effect relies on parameter settings, and different parameter combinations can make big differences
- There are relatively few buy signals, with some missed trade risks
- Multi-step verification will filter some opportunities, which may impact profit level
Countermeasures:
- Test different moving average parameters for parameter optimization
- Slightly simplify the logical judgment to increase buy signals
- Adjust the stop loss and take profit ratio to control single loss
The strategy can also be optimized in the following directions:
- Test more price momentum indicators such as MACD, DMI, etc.
- Add sell signal judgments to implement dual-direction trading
- Incorporate trading volume indicators to avoid potential false breakouts
- Optimize parameter settings based on backtest results
- Consider automatically adjusting parameters based on market conditions
- Add machine learning algorithms to achieve parameter self-adaptive optimization
These optimizations can improve strategy flexibility, robustness and profitability.
Overall, this price momentum tracking strategy is a simple, straightforward and logical trend tracking strategy. The strategy uses price moving averages and mean prices to determine price momentum direction, and designs a multi-step verification mechanism to improve signal quality. The strategy also contains reasonable stop loss and take profit settings. In terms of code, the strategy logic is very concise, requiring only 20+ lines of Pine script to implement. In summary, this strategy is a very good learning example, beginners can use it as a very good starting point to understand quantitative trading strategies. Of course, the strategy itself also has practical trading value. Through parameter optimization and function expansion, it can become a practical trading system to avoid noise and track trends.
[/trans]
Strategy Arguments
| Argument | Default | Description |
|---|---|---|
| v_input_1 | false | Consecutive Orders |
| v_input_2 | 250 | Stop Loss |
| v_input_3 | 10 | Reward/Risk |
Source (PineScript)
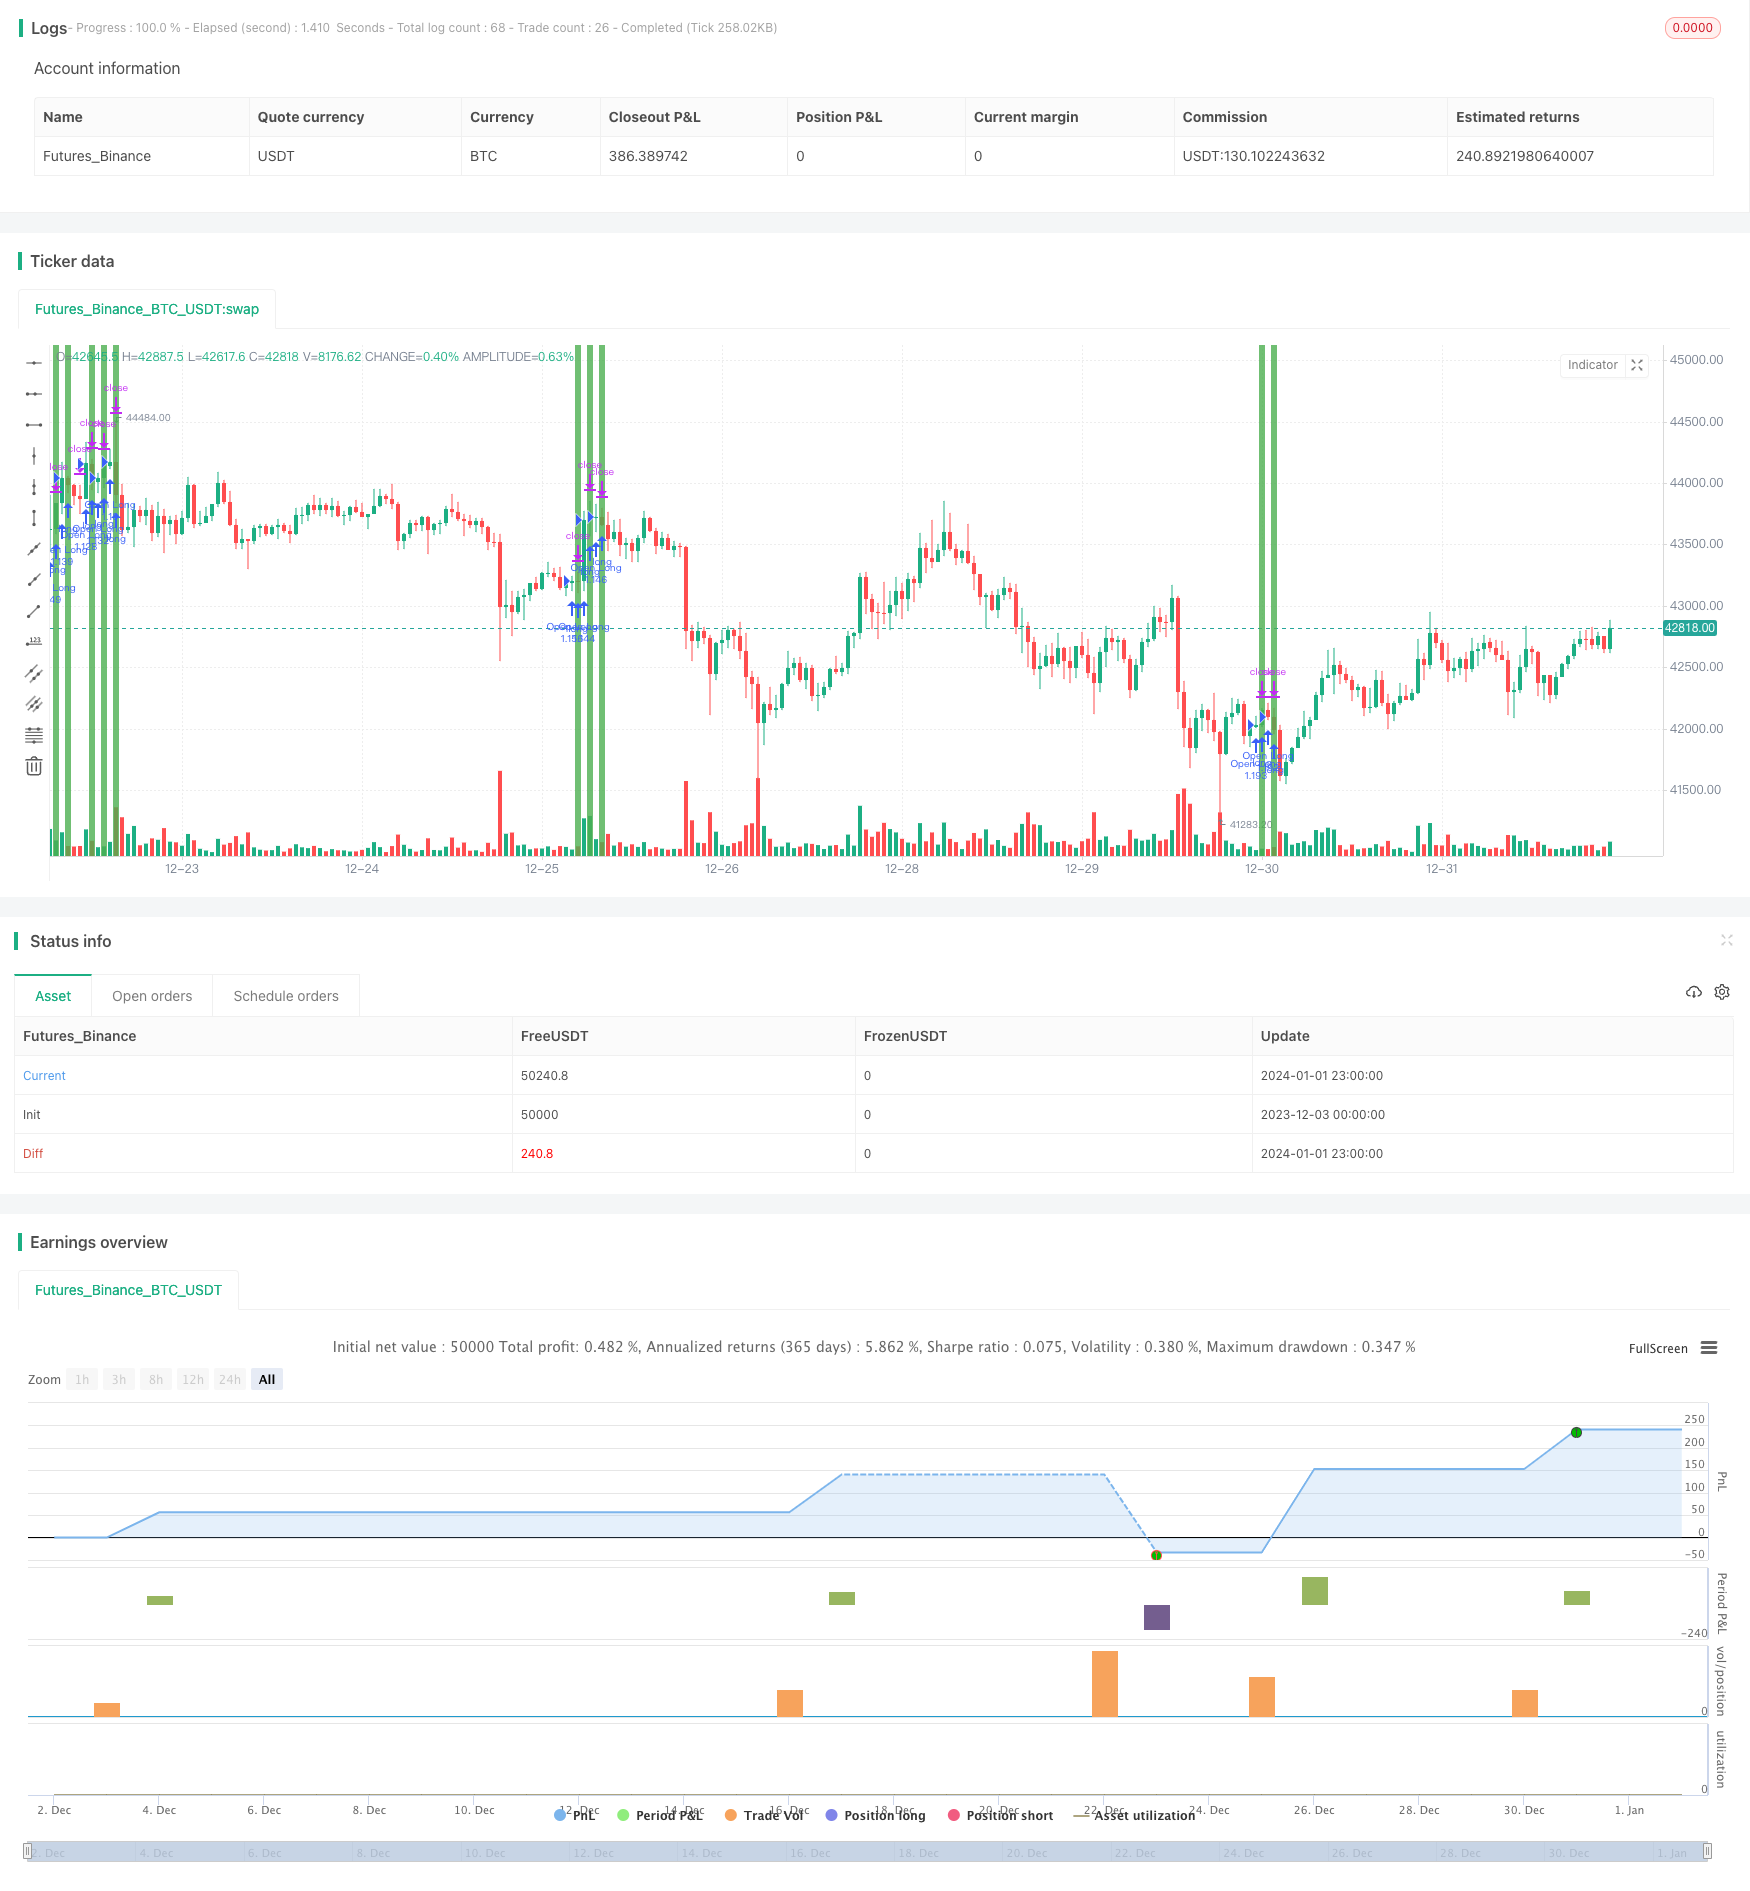
/*backtest
start: 2023-12-03 00:00:00
end: 2024-01-02 00:00:00
period: 1h
basePeriod: 15m
exchanges: [{"eid":"Futures_Binance","currency":"BTC_USDT"}]
*/

//@version=4
strategy(title = "Simple Price Momentum", shorttitle = "SPM", overlay = true, initial_capital = 20000, default_qty_value = 100, default_qty_type = strategy.percent_of_equity, commission_value = 0.025)

// How To Create A Simple Trading Strategy With TradingView
// https://docs.google.com/document/d/1fXxCtPuGgTXb-RuBJNbwlfgkeiLTK5060LfTrzRlr5k/view

swmaClose = swma(close)
vwapClose = vwap(close)

swmaLong = close > swmaClose
vwapLong = close > vwapClose

triggerLong = vwapLong and not vwapLong[1] and not swmaLong and not swmaLong[1]
saveLong = false, saveLong := triggerLong ? true : not vwapLong ? false : saveLong[1]

startLong = saveLong and swmaLong
startLong := input(false, "Consecutive Orders") ? startLong : startLong and not startLong[1]

stopLoss = input(250, "Stop Loss", step = 50)
takeProfit = input(10, "Reward/Risk") * stopLoss

strategy.entry("Open Long", strategy.long, when = startLong)
strategy.exit("Exit Long", "Open Long", profit = stopLoss, loss = takeProfit)

// bgcolor(swmaLong ? color.blue : na)
// bgcolor(vwapLong ? color.orange : na)
// bgcolor(triggerLong ? color.purple : na)
// bgcolor(saveLong ? color.yellow : na)
bgcolor(startLong[1] ? color.green : na)
Detail
https://www.fmz.com/strategy/437561
Last Modified
2024-01-03 17:32:14