Name
价格反转RSI组合策略Price-Reversal-RSI-Combo-Strategy
Author
ChaoZhang
Strategy Description
该策略综合运用价格反转策略和相对强弱指数(RSI)指标,实现趋势判断与超买超卖判定的有机结合。其中,价格反转部分判断价格是否出现反转信号,RSI部分用于判断市场是否超买超卖。两部分信号结合,可以有效过滤假信号,提高信号质量。
价格反转部分运用123形态判断价格反转。具体来说,当收盘价连续2日低于前一日收盘价,且9日随机指标低通道线高于50时,产生买入信号;当收盘价连续2日高于前一日收盘价,且9日随机指标高通道线低于50时,产生卖出信号。
RSI部分根据相对强弱指数是否高于70或低于30来判断市场是否超买超卖。RSI高于70为超买信号,RSI低于30为超卖信号。
最后,价格反转信号和RSI信号进行逻辑“与”运算。即两者同为买入信号或卖出信号时,才产生实际的交易信号入市。从而有效过滤掉单一指标的假信号,提高信号质量。
-
综合运用多指标判断,有效过滤假信号
该策略同时运用价格形态指标和超买超卖指标,两者信号需同向才入市。这样可以最大程度过滤单一指标可能产生的假信号,确保每次入市信号的可靠性。
-
反转为主,趋势为辅的交易方式
价格反转部分以123形态判断反转情况。这是一种典型的反转交易方式。同时,RSI指标又可判断趋势,起到辅助确认的作用。反转为主,趋势为辅的结合,既可捕捉反转机会,也可避免与趋势对冲。
-
简单参数设定,易于实盘操作
该策略只运用两个常用指标,参数数量适中。使策略整体结构简洁清晰,实盘操作难度不高,容易掌握。这对实盘交易者而言是非常重要的。
-
反转失败风险
价格反转交易本身存在失败的概率,无法完全避免。当价格形成123信号,但是之后再次反转回去的情况。这时就会造成交易失败。
-
交易频率过高风险
策略本身判断标准较为宽松,容易产生较多交易信号。如果不加以控制,会导致操作频率过高,增加交易费用和心理压力。
-
RSI区间设定不当
RSI指标的超买超卖区间默认为30-70。这只是经验参数,如果实际行情不符合,就容易错过正确信号或者发出错误信号。
-
适当调整持仓规模,控制单笔损失。
-
增加过滤条件,降低交易频率。例如加入移动均线判断。
-
测试不同市场后动态调整RSI参数区间,设定合理数值。
-
增加移动均线指标判断
在现有基础上,加入移动均线判断规则,一定程度可过滤掉小范围的噪音。
-
优化RSI参数设定
通过回测历史数据,测试确定RSI超买超卖值的最佳参数组合。
-
评估盈亏比作为持仓exit
除了现有的止损方式,可加入目标利润与止损关系的退出机制,以锁定盈利。
该策略运用价格反转判断和RSI指标判断双重确认,实现反转为主趋势为辅的交易思路。同时参数设定简单,易于掌握实盘。通过优化可加入更多过滤条件,降低交易频率的同时保持信号捕捉质量。该策略整体运行效果良好,具有实战运用的价值。
||
This strategy combines the price reversal strategy and the Relative Strength Index (RSI) indicator to achieve an organic combination of trend judgment and overbought-oversold detection. The price reversal part judges whether a price reversal signal has occurred, and the RSI part is used to determine whether the market is overbought or oversold. The combination of the two signals can effectively filter out false signals and improve signal quality.
The price reversal part uses the 123 pattern to judge price reversals. Specifically, when the closing price is lower than the previous closing price for 2 consecutive days, and the 9-day stochastic indicator lower channel line is higher than 50, a buy signal is generated; When the closing price is higher than the previous closing price for 2 consecutive days, and the 9-day stochastic oscillator upper channel line is lower than 50, a sell signal is generated.
The RSI part judges whether the market is overbought or oversold according to whether the Relative Strength Index is higher than 70 or lower than 30. An RSI above 70 is an overbought signal, and an RSI below 30 is an oversold signal.
Finally, a logical "AND" operation is performed on the price reversal signal and the RSI signal. That is, only when both are buy or sell signals will an actual trading signal be generated to enter the market. This effectively filters out false signals from single indicators and improves signal quality.
-
The combination of multiple indicators to judge can effectively filter out false signals.
This strategy uses price pattern indicators and overbought-oversold indicators at the same time. The two signals need to be in the same direction before entering the market. This can maximize filtering out the false signals that a single indicator may produce and ensure the reliability of each entry signal.
-
The trading method with reversal as the main and trend as the accessory.
The price reversal part mainly uses the 123 pattern to judge the reversal situation. This is a typical reversal trading method. At the same time, the RSI indicator can also judge trends and act as an auxiliary confirmation. The combination of reversal-based and trend-assisted can capture reversal opportunities while avoiding trend conflicts.
-
Simple parameter settings for easy live trading operations.
This strategy uses only two common indicators with a moderate number of parameters. This makes the overall structure of the strategy simple and clear, with low difficulty for live operations, which is easy to master. This is very important for live traders.
-
Risk of reversal failure
There is a probability of failure inherent in price reversal trading that cannot be completely avoided. When the price forms a 123 signal but then reverses back again. This will cause the trade to fail.
-
Risk of excessively high trading frequency
The standard of the strategy itself is relatively loose, which easily generates more trading signals. If not controlled, it will lead to excessively high operating frequencies, increasing trading costs and psychological pressure.
-
Improper RSI Parameter Settings
The overbought/oversold zones of the RSI indicator default to 30-70. These are empirical parameters. If the actual market does not match, correct signals may be missed or incorrect signals may be issued.
-
Adjust position size appropriately to control single loss.
-
Increase filtering conditions to reduce trading frequency. For example, add moving average judgment.
-
Test different markets and dynamically adjust RSI parameter ranges to set reasonable values.
-
Add moving average indicator judgment
On the existing basis, add a moving average judgment rule to filter out small-range noise to some extent.
-
Optimize RSI parameter settings
Through backtesting historical data, test and determine the optimal parameter combination of RSI overbought and oversold values.
-
Evaluate the profit-loss ratio as the position exit
In addition to the existing stop loss method, a profit target versus stop loss relationship exit mechanism can be added to lock in profits.
This strategy uses double confirmation of price reversal judgment and RSI indicator judgment to implement a trading idea of reversal-based and trend-assisted. At the same time, the parameter settings are simple and easy to grasp for live trading. Through optimization, more filtering conditions can be added to reduce the trading frequency while maintaining the signal capture quality. The overall performance of this strategy is good and it has value for practical use.
[/trans]
Strategy Arguments
| Argument | Default | Description |
|---|---|---|
| v_input_1 | true | ---- 123 Reversal ---- |
| v_input_2 | 14 | Length |
| v_input_3 | true | KSmoothing |
| v_input_4 | 3 | DLength |
| v_input_5 | 50 | Level |
| v_input_6 | true | ---- RSI ---- |
| v_input_7 | 12 | LengthRSI |
| v_input_8 | 30 | Oversold |
| v_input_9 | 70 | Overbought |
| v_input_10 | false | Trade reverse |
Source (PineScript)
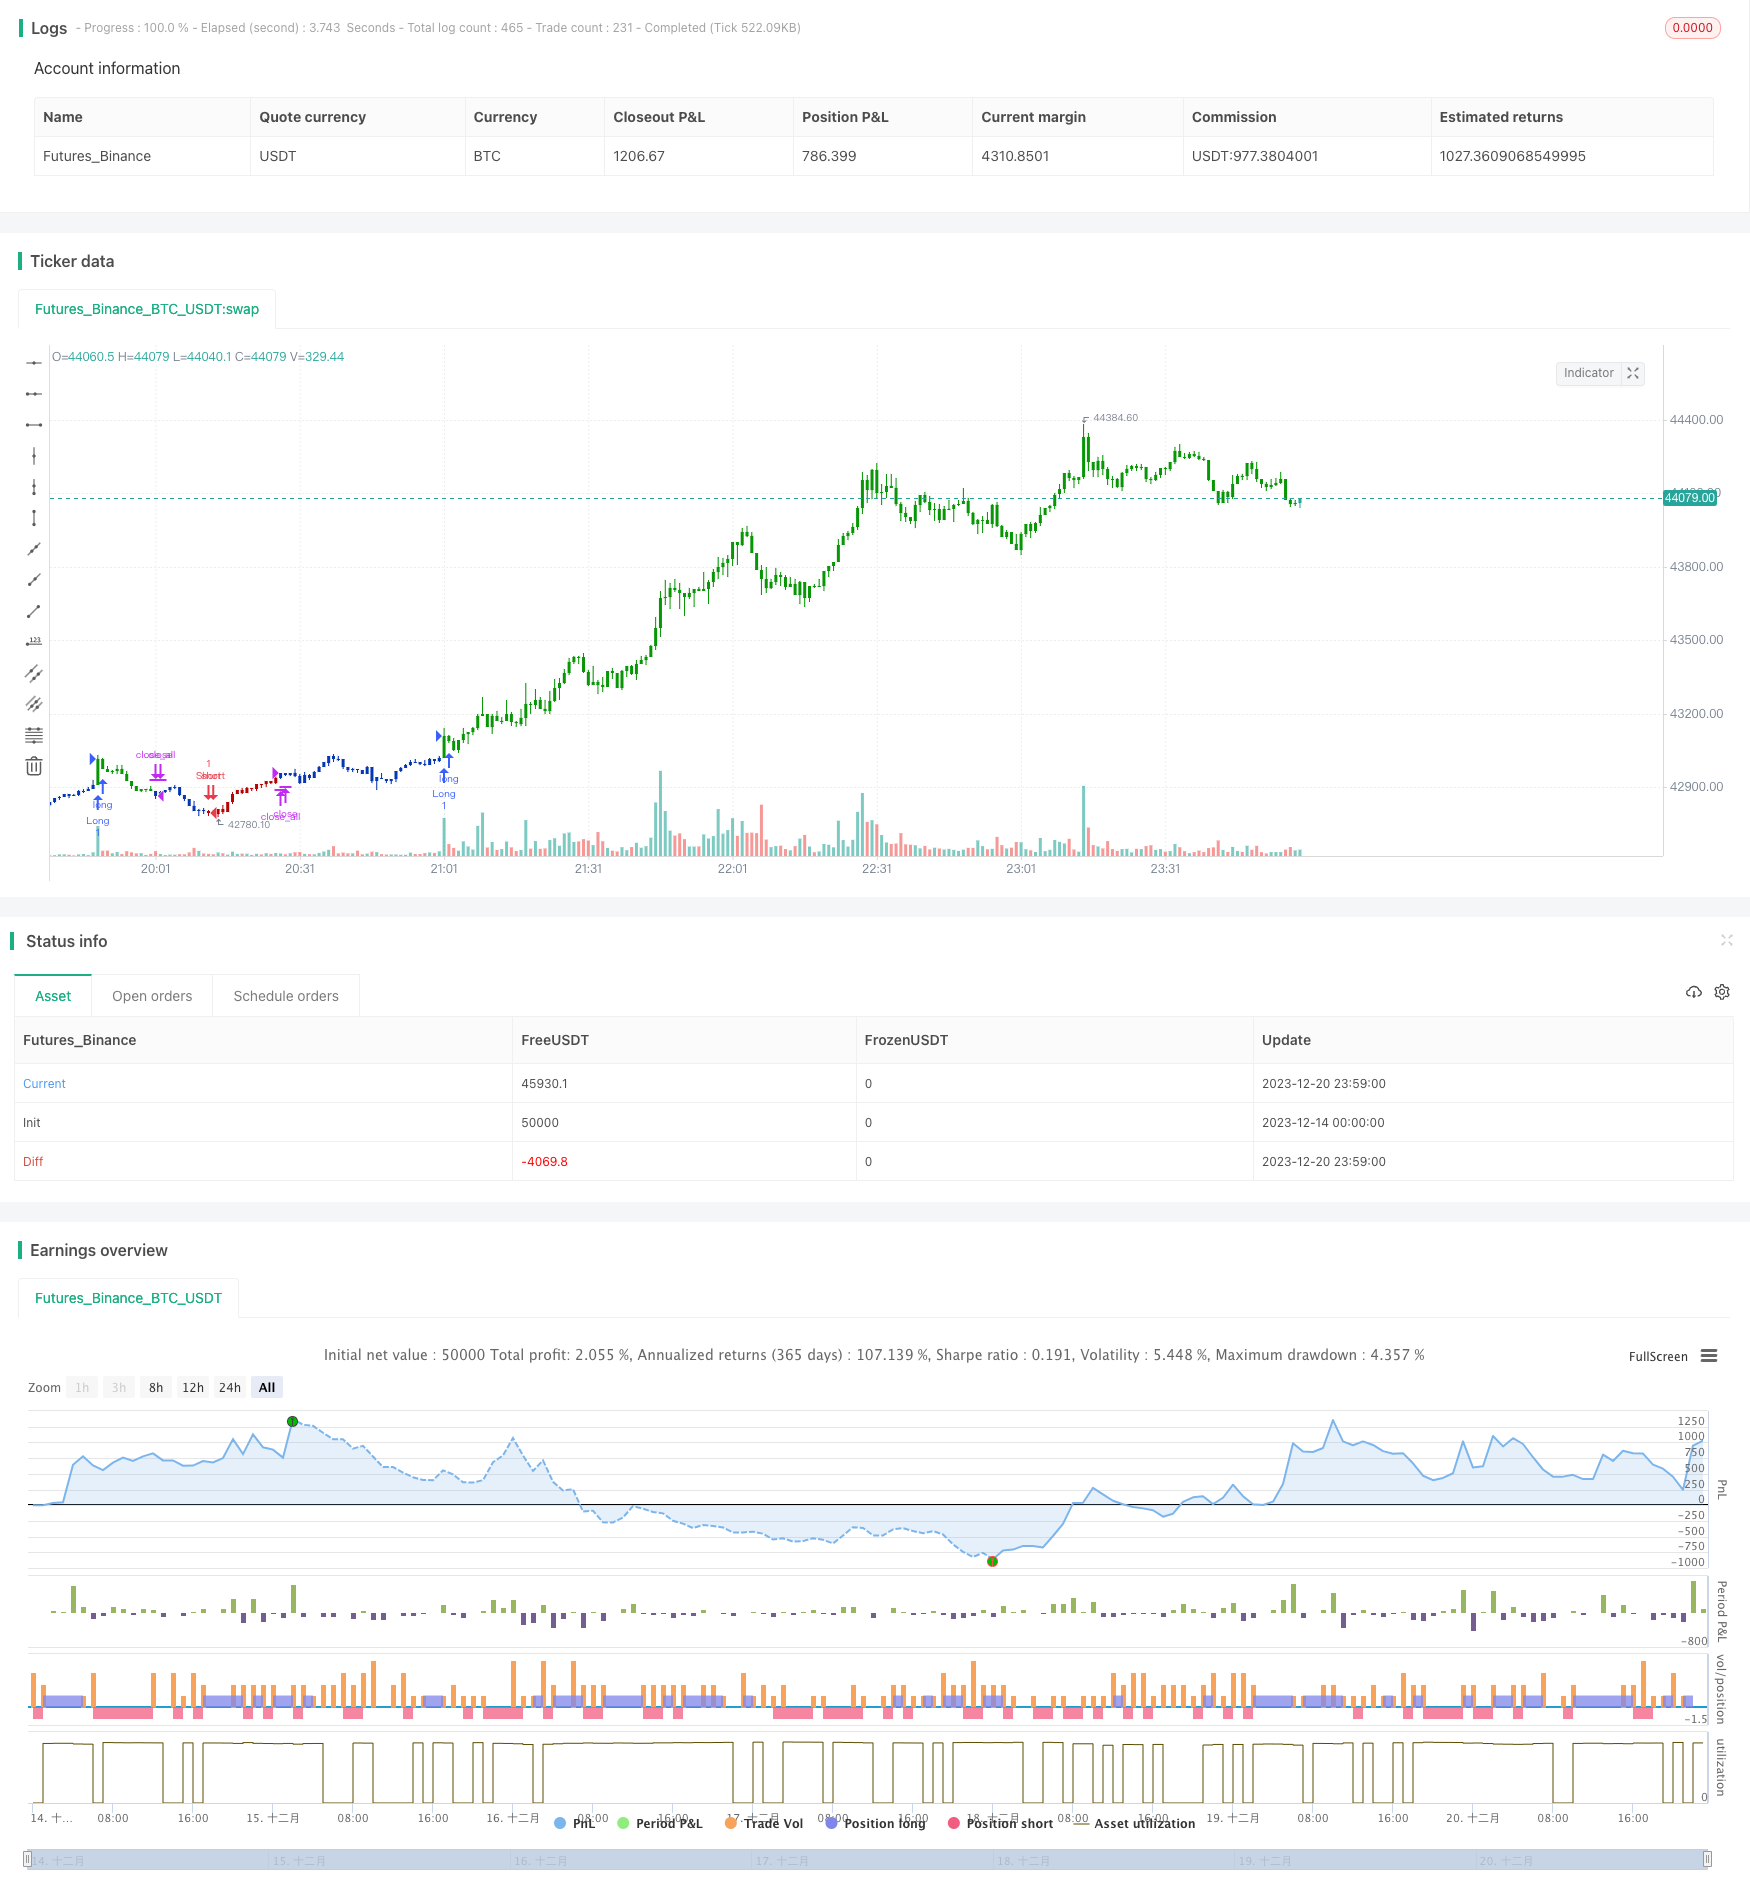
/*backtest
start: 2023-12-14 00:00:00
end: 2023-12-21 00:00:00
period: 1m
basePeriod: 1m
exchanges: [{"eid":"Futures_Binance","currency":"BTC_USDT"}]
*/

//@version=4
////////////////////////////////////////////////////////////
//  Copyright by HPotter v1.0 16/08/2021
// This is combo strategies for get a cumulative signal.
//
// First strategy
// This System was created from the Book "How I Tripled My Money In The
// Futures Market" by Ulf Jensen, Page 183. This is reverse type of strategies.
// The strategy buys at market, if close price is higher than the previous close
// during 2 days and the meaning of 9-days Stochastic Slow Oscillator is lower than 50.
// The strategy sells at market, if close price is lower than the previous close price
// during 2 days and the meaning of 9-days Stochastic Fast Oscillator is higher than 50.
//
// Second strategy
// The RSI is a very popular indicator that follows price activity.
// It calculates an average of the positive net changes, and an average
// of the negative net changes in the most recent bars, and it determines
// the ratio between these averages. The result is expressed as a number
// between 0 and 100. Commonly it is said that if the RSI has a low value,
// for example 30 or under, the symbol is oversold. And if the RSI has a
// high value, 70 for example, the symbol is overbought.
//
// WARNING:
// - For purpose educate only
// - This script to change bars colors.
////////////////////////////////////////////////////////////
Reversal123(Length, KSmoothing, DLength, Level) =>
    vFast = sma(stoch(close, high, low, Length), KSmoothing)
    vSlow = sma(vFast, DLength)
    pos = 0.0
    pos := iff(close[2] < close[1] and close > close[1] and vFast < vSlow and vFast > Level, 1,
	         iff(close[2] > close[1] and close < close[1] and vFast > vSlow and vFast < Level, -1, nz(pos[1], 0)))
	pos


mRSI(Length,Oversold,Overbought) =>
    pos = 0.0
    xRSI = rsi(close, Length)
    pos:=iff(xRSI > Overbought, 1,
	       iff(xRSI < Oversold, -1, nz(pos[1], 0)))
    pos

strategy(title="Combo Backtest 123 Reversal & RSI", shorttitle="Combo", overlay = true)
line1 = input(true, "---- 123 Reversal ----")
Length = input(14, minval=1)
KSmoothing = input(1, minval=1)
DLength = input(3, minval=1)
Level = input(50, minval=1)
//-------------------------
line2 = input(true, "---- RSI ----")
LengthRSI = input(12, minval=1)
Oversold = input(30, minval=1)
Overbought = input(70, minval=1)
reverse = input(false, title="Trade reverse")
posReversal123 = Reversal123(Length, KSmoothing, DLength, Level)
posmRSI = mRSI(LengthRSI,Oversold,Overbought)
pos = iff(posReversal123 == 1 and posmRSI == 1 , 1,
	   iff(posReversal123 == -1 and posmRSI == -1, -1, 0))
possig = iff(reverse and pos == 1, -1,
          iff(reverse and pos == -1 , 1, pos))
if (possig == 1 )
    strategy.entry("Long", strategy.long)
if (possig == -1 )
    strategy.entry("Short", strategy.short)
if (possig == 0)
    strategy.close_all()
barcolor(possig == -1 ? #b50404: possig == 1 ? #079605 : #0536b3 )
Detail
https://www.fmz.com/strategy/436215
Last Modified
2023-12-22 11:53:11