Name
偏反指标回测策略Key-Reversal-Backtest-Strategy
Author
ChaoZhang
Strategy Description
[trans]
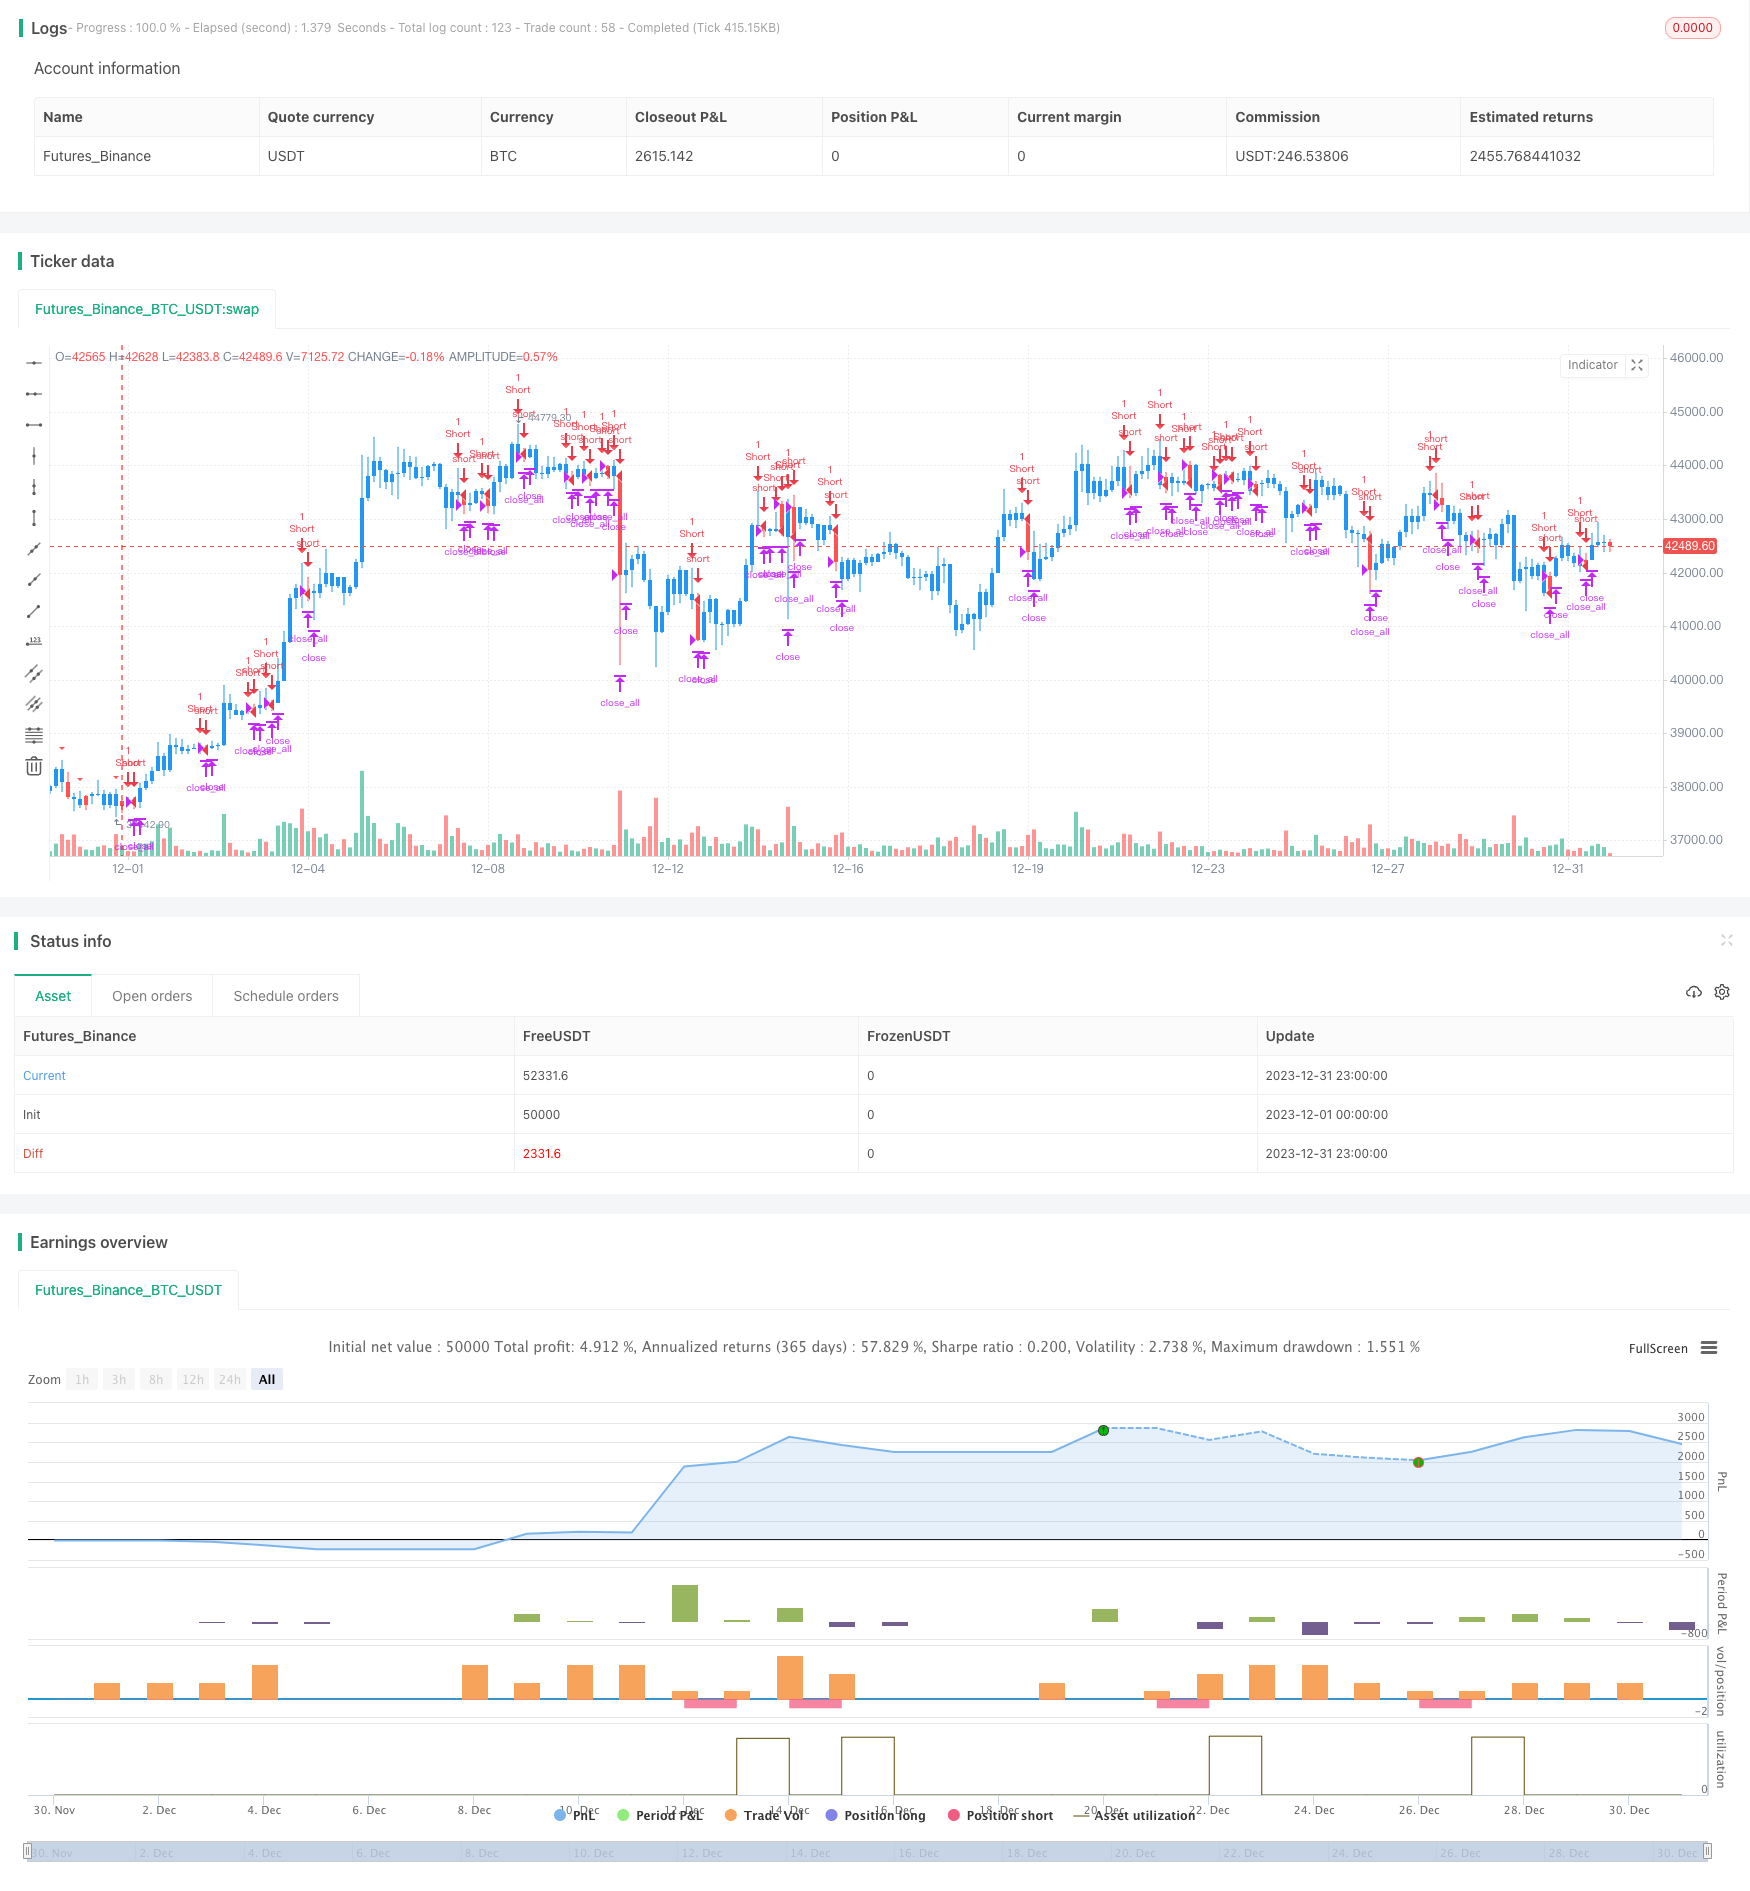
偏反指标回测策略通过检测股票价格是否创出新的高点后关闭价格回落,来判断市场潜在空头机会,属于短线交易策略。该策略结合视觉形态进行形态识别,辅助判断价格反转信号,然后进行回测验证策略的可行性。
该策略的核心逻辑是基于“偏反指标”理论,通过判断价格创出新高后是否有明显回落迹象,来识别潜在的空头机会。具体实现原理如下:
-
定义参数nLength,表示回朔周期,用来判断价格创不创新高;
-
定义变量xHH,存储过去nLength周期内的最高价;
-
定义变量C1,判断当天最高价是否超过xHH,即是否创新高,同时收盘价是否低于前一日收盘价,符合该条件则可能为偏反形态;
-
绘制三角形指示当天可能为偏反形态的K线;
-
当识别到偏反形态时,进行短线空头交易,设置止盈止损逻辑。
通过上述流程,可以有效识别偏反形态,判断价格反转信号,进行短线空头交易。
该策略具有以下几个优势:
-
基于实际价格形态,判断反转信号更加可靠;
-
结合图形化指标,交易信号更直观;
-
实现止盈止损逻辑,有利于风险控制;
-
回测验证策略的可行性,更有说服力。
总体来说,该策略结合多个因素判断交易信号,并进行回测验证,判断价格反转的准确性较高,具有很好的实战价值。
尽管该策略有明显的优势,但是也存在一些风险需要注意:
-
偏反形态不一定会引发趋势反转,存在一定的假信号风险;
-
单一股票样本量可能较小,不能完全代表整体市场;
-
止损点设置不当可能带来更大的资金损失。
为规避上述风险,可以考虑以下几点:
-
结合更多因素验证交易信号,如成交量异动等;
-
增大回测样本量,不同品种组合回测;
-
优化和测试不同的止损点,寻找最优参数。
该策略还存在一些可以优化的方向:
-
增加机器学习算法,训练模型判断偏反形态的可能性,提高准确率;
-
优化止损算法,如追踪止损、平均止损等,降低单笔止损;
-
结合情绪分析等更多因素判断市场反转概率,设定动态交易信号;
-
丰富策略类型,如结合量能指标、波动指标等判断反转信号;
-
使用更复杂交易系统的回测和优化功能,提高策略的灵活性。
通过上述几个方面的优化,可以使该交易策略的准确性和实战水平进一步提升。
偏反指标回测策略通过判断价格形态识别短期反转信号,并进行回测验证,能够有效捕捉反转机会。该策略图形化指标直观,止盈止损逻辑完备,具有良好的实战价值。当然,仍需要注意一定的假信号风险,通过不断优化判断模型和止损算法可以使策略效果更好。总体上,该策略为判断市场反转提供了新的思路,是一种非常有前景的量化交易方法。
||
The key reversal backtest strategy detects potential short opportunities in the market by checking if stock prices hit new highs and then close lower. It is a short-term trading strategy. This strategy combines visual pattern recognition to assist in identifying price reversal signals, and then backtests to verify the feasibility of the strategy.
The core logic of this strategy is based on the "key reversal indicator" theory, by judging whether there are obvious signs of decline after the price hits a new high, to identify potential short opportunities. The specific implementation principles are as follows:
-
Define the parameter nLength, which represents the lookback period, to determine whether the price is hitting a new high or not;
-
Define the variable xHH to store the highest price in the past nLength cycles;
-
Define the variable C1 to determine if today's highest price exceeds xHH, i.e. hitting a new high, while the closing price is lower than the previous day's closing price, which meets the conditions that may be a key reversal pattern;
-
Draw triangle to indicate the potential key reversal K-line today;
-
When identifying the key reversal pattern, make short-term short trades and set stop profit and stop loss logic.
Through the above process, potential key reversal patterns can be effectively identified, price reversal signals can be judged, and short-term short trades can be made.
The strategy has the following advantages:
-
Identifying reversal signals based on actual price patterns is more reliable;
-
Visual graphical indicators make trading signals more intuitive;
-
Implementing stop profit and stop loss logic is conducive to risk control;
-
Backtesting to verify the feasibility of the strategy is more convincing.
Overall, the strategy combines multiple factors to determine trading signals and backtesting to verify the accuracy of price reversals is relatively high, with good practical value.
Although the strategy has obvious advantages, there are still some risks to note:
-
Key reversal patterns do not necessarily lead to trend reversals, there is a certain risk of false signals;
-
The sample size of a single stock may be small and may not fully represent the overall market;
-
Improper stop loss point settings can lead to greater capital losses.
To avoid the above risks, the following points can be considered:
-
Verify trading signals with more factors, such as abnormal trading volume;
-
Increase backtest sample size, combination backtest of different varieties;
-
Optimize and test different stop loss points to find the optimal parameters.
There are still some directions that can be optimized in this strategy:
-
Increase machine learning algorithms to train models to determine the probability of key reversal patterns to improve accuracy;
-
Optimize stop loss algorithms, such as trailing stop loss, average stop loss, etc., to reduce single stop loss;
-
Incorporate more factors such as sentiment analysis to determine the probability of market reversal and set dynamic trading signals;
-
Enrich strategy types, such as combining momentum indicators, volatility indicators, etc. to determine reversal signals;
-
Use backtesting and optimization functions of more complex trading systems to improve strategy flexibility.
Through the above aspects of optimization, the accuracy and practical level of this trading strategy can be further improved.
The key reversal backtest strategy identifies short-term reversal signals by judging price patterns, and verifies them through backtesting. It can effectively capture reversal opportunities. This strategy has intuitive graphical indicators and complete stop profit and stop loss logic, with good practical value. Of course, certain false signal risks still need to be noted. By continuously optimizing the judgment model and stop loss algorithm, the effect of the strategy can be better. Overall, this strategy provides new ideas for judging market reversals and is a very promising quantitative trading method.
[/trans]
Strategy Arguments
| Argument | Default | Description |
|---|---|---|
| v_input_1 | 20 | Take Profit pip |
| v_input_2 | 10 | Stop Loss pip |
| v_input_3 | true | Enter the number of bars over which to look for a new high in prices. |
Source (PineScript)
/*backtest
start: 2023-12-01 00:00:00
end: 2023-12-31 23:59:59
period: 3h
basePeriod: 15m
exchanges: [{"eid":"Futures_Binance","currency":"BTC_USDT"}]
*/

//@version=4
////////////////////////////////////////////////////////////
//  Copyright by HPotter v1.0 20/01/2020
//
// A key reversal is a one-day trading pattern that may signal the reversal of a trend.
// Other frequently-used names for key reversal include "one-day reversal" and "reversal day."
// How Does a Key Reversal Work?
// Depending on which way the stock is trending, a key reversal day occurs when:
// In an uptrend -- prices hit a new high and then close near the previous day's lows.
// In a downtrend -- prices hit a new low, but close near the previous day's highs
// WARNING:
// - For purpose educate only
// - This script to change bars colors.
////////////////////////////////////////////////////////////
strategy(title="Key Reversal Down Backtest", shorttitle="KRD Backtest", overlay = true)
input_takeprofit = input(20, title="Take Profit pip", step=0.01)
input_stoploss = input(10, title="Stop Loss pip", step=0.01)
nLength = input(1, minval=1, title="Enter the number of bars over which to look for a new high in prices.")
xHH = highest(high[1], nLength)
C1 = iff(high > xHH and close < close[1], true, false)
plotshape(C1, style=shape.triangledown, size = size.small, color=color.red)
posprice = 0.0
pos = 0
barcolor(nz(pos[1], 0) == -1 ? color.red: nz(pos[1], 0) == 1 ? color.green : color.blue )
posprice := iff(C1== true, close, nz(posprice[1], 0))
pos := iff(posprice > 0, -1, 0)
if (pos == 0)
    strategy.close_all()
if (pos == -1)
    strategy.entry("Short", strategy.short)
posprice := iff(low <= posprice - input_takeprofit and posprice > 0, 0 ,  nz(posprice, 0))
posprice := iff(high >= posprice + input_stoploss and posprice > 0, 0 ,  nz(posprice, 0))
Detail
https://www.fmz.com/strategy/439036
Last Modified
2024-01-17 10:56:52