Name
动向指数双向交易策略Directional-Movement-Index-Dual-direction-Trading-Strategy
Author
ChaoZhang
Strategy Description
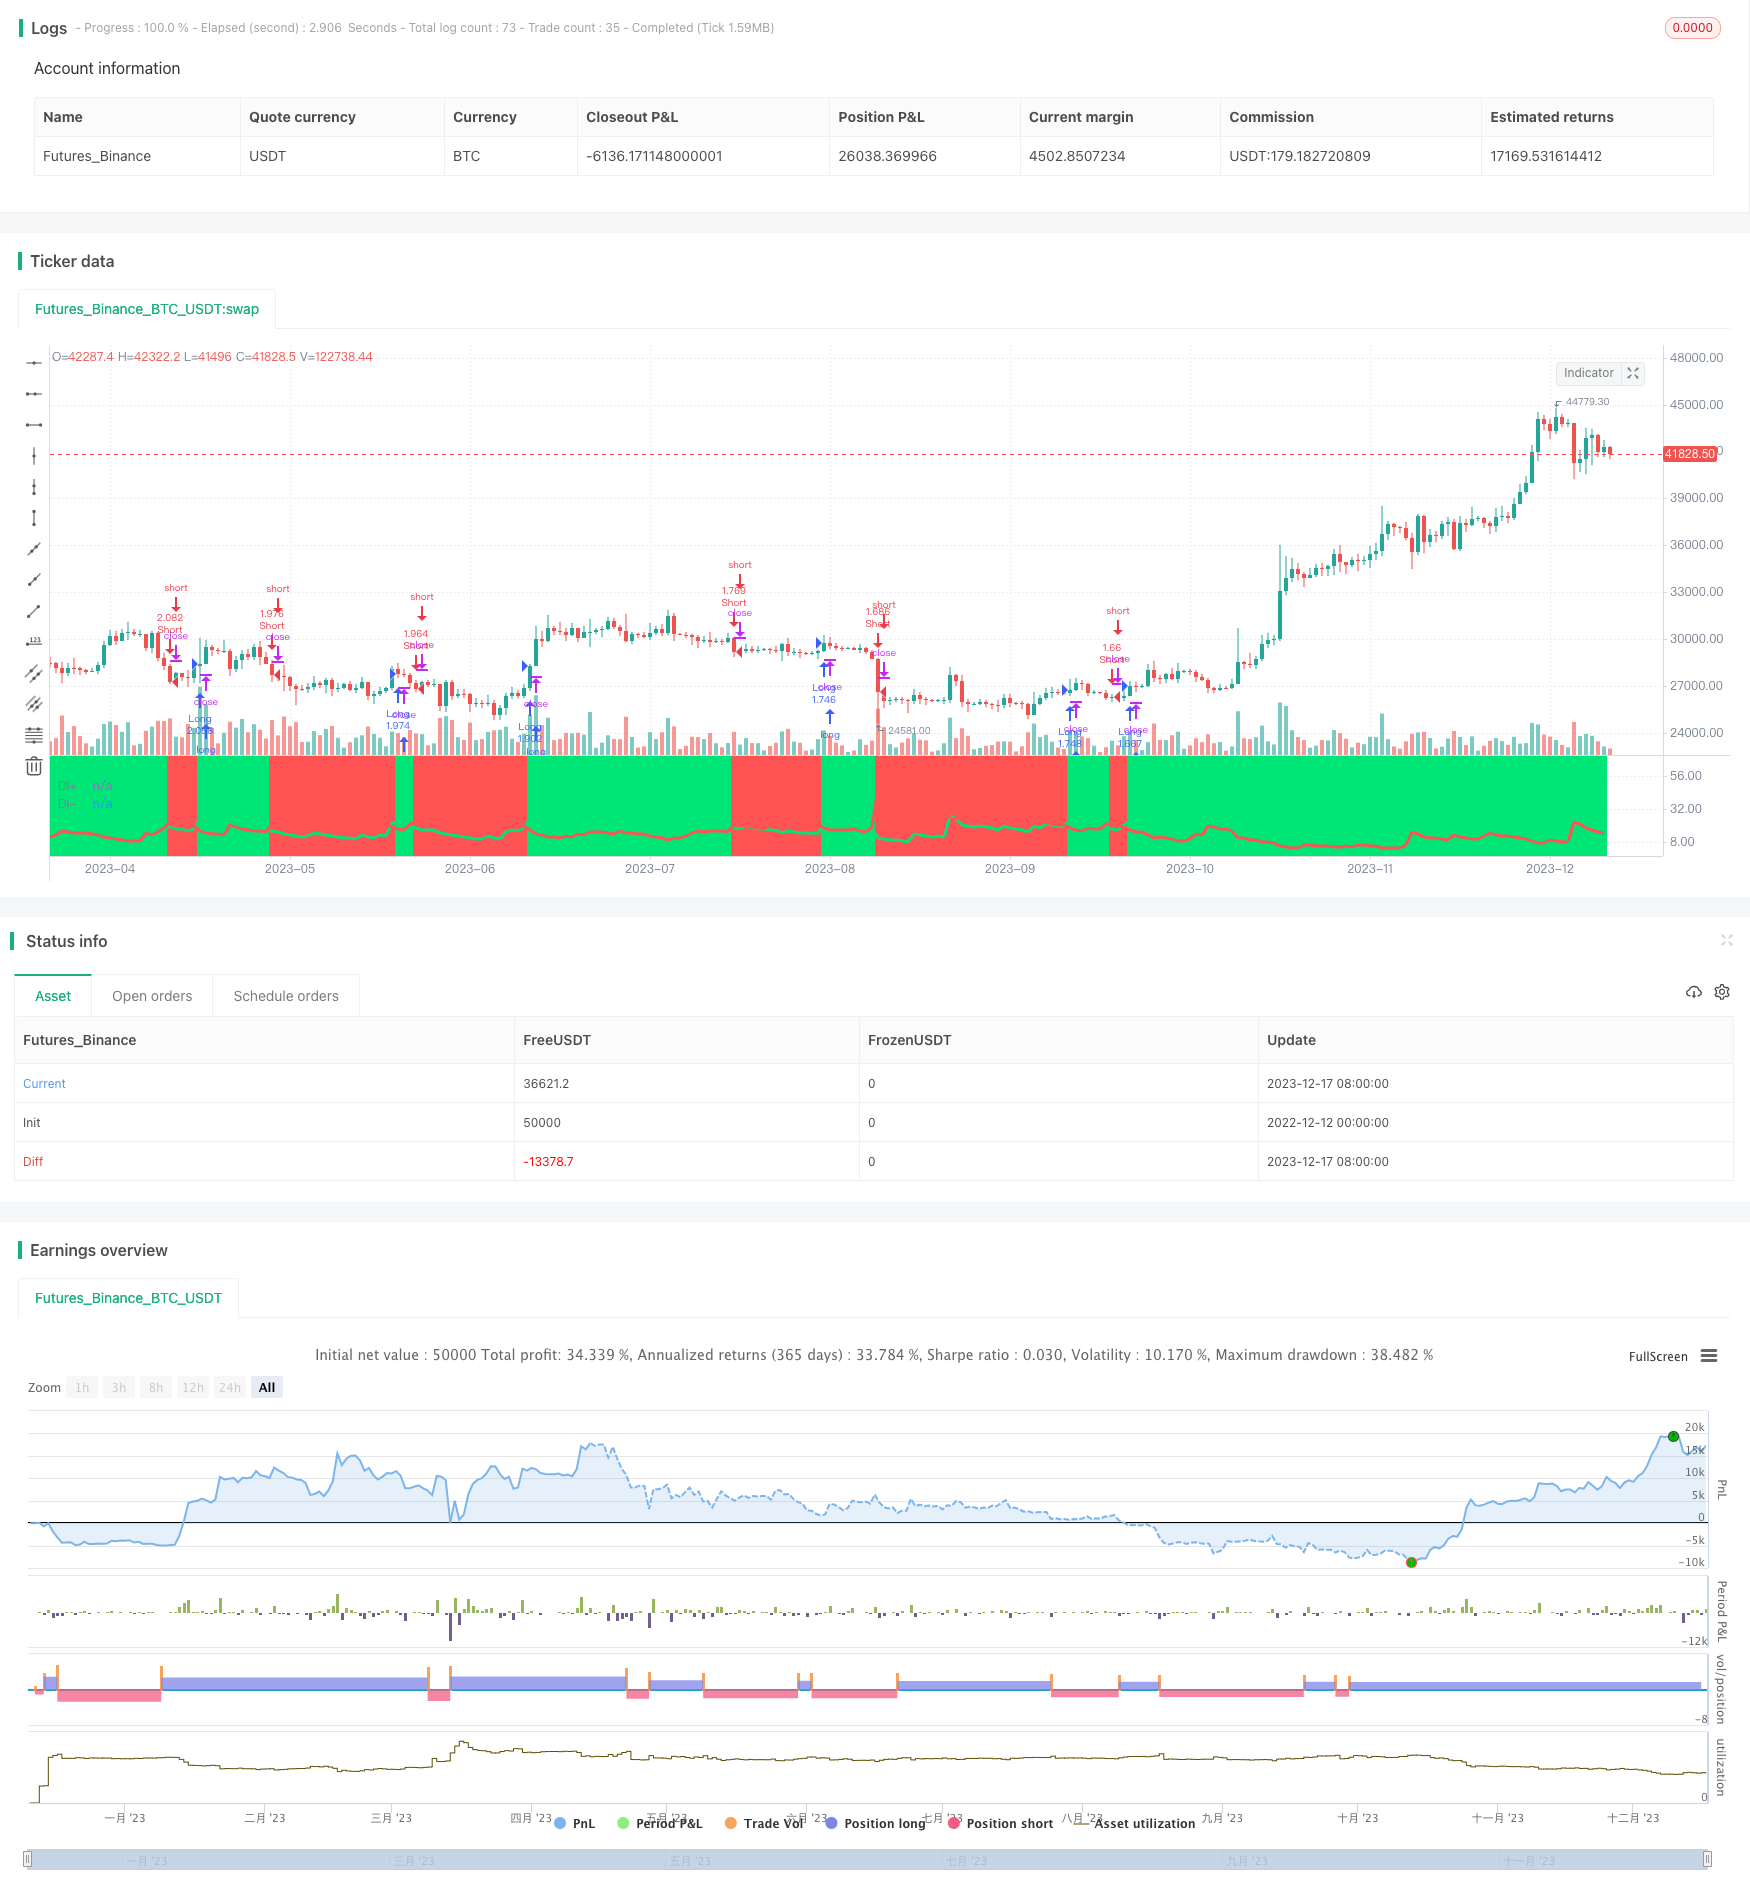
该策略通过计算商品的动向指数(DI)并结合限制参数,实现商品双向交易。当DI+大于DI-一个限制参数时做多,当DI-大于DI+一个限制参数时做空。
该策略的核心指标是动向指数(DI)。DI由以下公式计算:
DI+ = (DM+ / 真实范围)×100 DI- = (DM- / 真实范围)×100
其中DM+代表多头动向,DM-代表空头动向。真实范围则通过最大值计算三天最高价、最低价和昨收价的波动来代表近期的波动幅度。
根据DI的定义,当DI+ > DI-时,说明目前行情中多头力量大于空头力量,属于多头市场;当DI- > DI+时,说明空头力量强于多头力量,属于空头市场。
该策略利用这个特性,设定一个限制参数。当DI+大于DI-一个限制参数时,判断目前为多头市场,做多;当DI-大于DI+一个限制参数时,判断目前为空头市场,做空。
例如限制参数设置为3,那么具体交易规则为:
- 当DI+ - DI- > 3时,做多
- 当DI- - DI+ > 3时,做空
由于DI+和DI-之间经常有较小的差值波动,设置限制参数可以过滤掉一些没有明显方向性的交易信号,减少不必要的交易,这是该策略的一个优势。
该策略主要有以下优势:
-
使用DI判断行情方向性强,可靠性高
DI通过计算多空双方力量比较直接判断行情走势,没有曲线拟合等复杂算法,理论简单可靠。
-
设置限制参数可有效过滤信号
通过限制参数过滤没有明显方向性的小幅度波动,只选择行情明显的方向性较强段进行交易,避免被套。
-
实现自动双向交易
多空仓位可根据DI指标自动切换,无需人工判断,降低交易难度。
-
可自定义交易时间段
支持设置只在自定义的日期范围内交易,结束后自动平仓,灵活方便。
-
可根据情况选择只做多或只做空
通过多空开关可只选取单向信号,实现只做多或只做空,适应不同市场环境。
该策略也存在一些风险:
-
DI发出错误信号的可能
当行情出现剧烈波动时,DI可能会短期发出错误信号,导致交易失败。需要组合其他指标进行校验。
-
限制参数设置不当
限制参数设置过大过小都可能导致交易信号过少或过多,需要根据市场调整参数。
-
无法判断趋势末端
DI只能判断当前趋势方向,无法判断趋势是否结束或反转,需要其他指标结合。
对应风险的解决方法包括:
-
结合移动平均线等指标过滤DI信号
-
根据回测结果调整限制参数
-
结合Volumes,MACD等判断是否趋势反转
该策略可以从以下方面继续优化:
-
结合民意晴雨图等其他趋势判断指标
民意晴雨图等更直观判断多空力量的指标与DI结合,可以提高判断准确率。
-
加入止盈止损策略
设定移动止盈、时间或比率止损止损点,可以锁定利润,降低亏损。
-
针对特定品种进行参数调整
根据不同品种的交易特性调整限制参数和交易时间可以提高策略效果。
-
利用机器学习技术动态优化
应用强化学习等技术根据实盘信号优化参数设置。
该策略整体来说较为简单实用。它利用DI的计算方法判断行情方向;通过限制参数过滤信号;可以双向交易,也可以仅做多或空;支持设置交易时间段。主要优势是可靠性较高,有效过滤信号。同时也存在发出错误信号、参数设置等问题。我们可以通过与其它指标组合、设置止损止盈、调整参数等方式提高策略效果,也可以利用机器学习进行动态优化。总体来说,该策略适合作为判断行情方向的组合指标之一,与其他策略相配合可以取得不错的效果。
||
This strategy calculates the Directional Movement Index (DI) of commodities and combines it with limit parameters to implement dual-direction trading. It goes long when DI+ is greater than DI- by a limit parameter and goes short when DI- is greater than DI+ by a limit parameter.
The core indicator of this strategy is the Directional Movement Index (DI). DI is calculated by the following formulas:
DI+ = (DM+ / True Range) × 100 DI- = (DM- / True Range) × 100
Where DM+ represents the Directional Movement Positive, DM- represents the Directional Movement Negative. The True Range represents the recent volatility by calculating the maximum value of the highest price, the lowest price and the closing price of the previous day over three days.
According to the definition of DI, when DI+ > DI-, it means the current market momentum is stronger, belonging to a bull market; when DI- > DI+, it means the bear momentum is stronger than the bull momentum, belonging to a bear market.
This strategy utilizes this feature and sets a limit parameter. When DI+ is greater than DI- by a limit parameter, it determines that the current market is a bull market and goes long. When DI- is greater than DI+ by a limit parameter, it determines that the current market is a bear market and goes short.
For example, if the limit parameter is set to 3, the specific trading rules are:
- When DI+ - DI- > 3, go long
- When DI- - DI+ > 3, go short
Since there are often small fluctuating differences between DI+ and DI-, setting a limit parameter can filter out some trades without significant directionality and reduce unnecessary trades. This is an advantage of this strategy.
The main advantages of this strategy are:
-
DI is reliable in judging market directionality
DI directly judges market trends by calculating the power of bulls and bears. The theory is simple and reliable without complex algorithms like curve fitting.
-
The limit parameter can effectively filter signals
The limit parameter filters small fluctuations without significant directionality, only selecting sections with significant directionality to trade, avoiding being trapped.
-
Achieve automated dual-direction trading
Long and short positions can be automatically switched based on the DI indicator without manual judgment, reducing trading difficulty.
-
Customizable trading time frame
Supports setting to only trade within a customizable date range and close all positions automatically afterwards, flexible and convenient.
-
Selectable long or short only
Through the long and short switches, only single-direction signals can be selected to implement long or short only strategies suitable for different market environments.
There are also some risks with this strategy:
-
Possibility of DI giving wrong signals
DI may give short-term wrong signals when drastic market fluctuations occur, leading to failed trades. Other indicators need to be combined for verification.
-
Improper limit parameter settings
Improper high or low limit parameter settings can lead to too few or too many trading signals. The parameters need to be adjusted according to the market.
-
Unable to determine trend endpoint
DI can only determine the current trend direction and cannot judge whether the trend has ended or reversed. Other indicators need to be combined.
The solutions for the risks include:
-
Combine moving average and other indicators to filter DI signals
-
Adjust limit parameters based on backtest results
-
Combine Volume, MACD etc. to determine if trend reversal
The strategy can be further optimized in the following ways:
-
Combine other trend judgment indicators like Market Profile
Combining indicators like Market Profile which also intuitively judge long-short power with DI can improve judgment accuracy.
-
Add stop-profit and stop-loss strategies
Setting trailing stop-profit, time or percentage stop-losses can lock in profits and reduce losses.
-
Adjust parameters for specific products
Adjusting limit parameters and trading times according to different product characteristics can improve strategy performance.
-
Dynamic optimization using machine learning
Applying reinforcement learning algorithms to dynamically optimize parameter settings based on live signals.
In summary, this strategy is relatively simple and practical. It utilizes DI’s calculation to determine market direction; filters signals via limit parameters; supports dual-direction trading or long/short only; allows setting trading time frame. The main advantages are high reliability and effective signal filtering. It also has issues like wrong signals and parameter settings. We can improve it by combining other indicators, setting stop-loss/profit, adjusting parameters etc, or dynamically optimizing it with machine learning. Overall it is suitable as a directional indicator to combine with other strategies for decent results.
[/trans]
Strategy Arguments
| Argument | Default | Description |
|---|---|---|
| v_input_1 | true | Long |
| v_input_2 | true | Short |
| v_input_3 | 100 | Capital, % |
| v_input_4 | 14 | Length |
| v_input_5 | 3 | limit, % |
| v_input_6 | 1900 | From Year |
| v_input_7 | 2100 | To Year |
| v_input_8 | true | From Month |
| v_input_9 | 12 | To Month |
| v_input_10 | true | From day |
| v_input_11 | 31 | To day |
Source (PineScript)
/*backtest
start: 2022-12-12 00:00:00
end: 2023-12-18 00:00:00
period: 1d
basePeriod: 1h
exchanges: [{"eid":"Futures_Binance","currency":"BTC_USDT"}]
*/

//@version=3
strategy("Noro's DI Strategy", overlay = false, default_qty_type = strategy.percent_of_equity, default_qty_value = 100, pyramiding = 0)

//Settings
needlong = input(true, defval = true, title = "Long")
needshort = input(true, defval = true, title = "Short")
capital = input(100, defval = 100, minval = 1, maxval = 10000, title = "Capital, %")
len = input(title="Length", defval=14)
limit = input(3, title = "limit, %")
fromyear = input(1900, defval = 1900, minval = 1900, maxval = 2100, title = "From Year")
toyear = input(2100, defval = 2100, minval = 1900, maxval = 2100, title = "To Year")
frommonth = input(01, defval = 01, minval = 01, maxval = 12, title = "From Month")
tomonth = input(12, defval = 12, minval = 01, maxval = 12, title = "To Month")
fromday = input(01, defval = 01, minval = 01, maxval = 31, title = "From day")
today = input(31, defval = 31, minval = 01, maxval = 31, title = "To day")

//DI
TrueRange = max(max(high-low, abs(high-nz(close[1]))), abs(low-nz(close[1])))
DirectionalMovementPlus = high-nz(high[1]) > nz(low[1])-low ? max(high-nz(high[1]), 0): 0
DirectionalMovementMinus = nz(low[1])-low > high-nz(high[1]) ? max(nz(low[1])-low, 0): 0
SmoothedTrueRange = 0.0
SmoothedDirectionalMovementPlus = 0.0
SmoothedDirectionalMovementMinus = 0.0
SmoothedTrueRange := nz(SmoothedTrueRange[1]) - (nz(SmoothedTrueRange[1])/len) + TrueRange
SmoothedDirectionalMovementPlus := nz(SmoothedDirectionalMovementPlus[1]) - (nz(SmoothedDirectionalMovementPlus[1])/len) + DirectionalMovementPlus
SmoothedDirectionalMovementMinus := nz(SmoothedDirectionalMovementMinus[1]) - (nz(SmoothedDirectionalMovementMinus[1])/len) + DirectionalMovementMinus
DIPlus = SmoothedDirectionalMovementPlus / SmoothedTrueRange * 100
DIMinus = SmoothedDirectionalMovementMinus / SmoothedTrueRange * 100

//Trend
trend = 0
trend := DIPlus > DIMinus + limit ? 1 : DIPlus < DIMinus - limit ? -1 : trend[1]

//Background
col = trend == 1 ? lime : red
bgcolor(col, transp = 80)

//Lines
plot(DIPlus, color=lime, title="DI+", linewidth = 3)
plot(DIMinus, color=red, title="DI-", linewidth = 3)

//Trading
size = strategy.position_size
lot = 0.0
lot := size != size[1] ? strategy.equity / close * capital / 100 : lot[1]
if trend == 1
    strategy.entry("Long", strategy.long, needlong == false ? 0 : lot, when=(time > timestamp(fromyear, frommonth, fromday, 00, 00) and time < timestamp(toyear, tomonth, today, 23, 59)))
if trend == -1
    strategy.entry("Short", strategy.short, needshort == false ? 0 : lot, when=(time > timestamp(fromyear, frommonth, fromday, 00, 00) and time < timestamp(toyear, tomonth, today, 23, 59)))
if time > timestamp(toyear, tomonth, today, 23, 59)
    strategy.close_all()
Detail
https://www.fmz.com/strategy/435871
Last Modified
2023-12-19 14:13:52