Name
动向指数多空平衡买卖策略DMI-Balance-Buy-Sell-Strategy
Author
ChaoZhang
Strategy Description
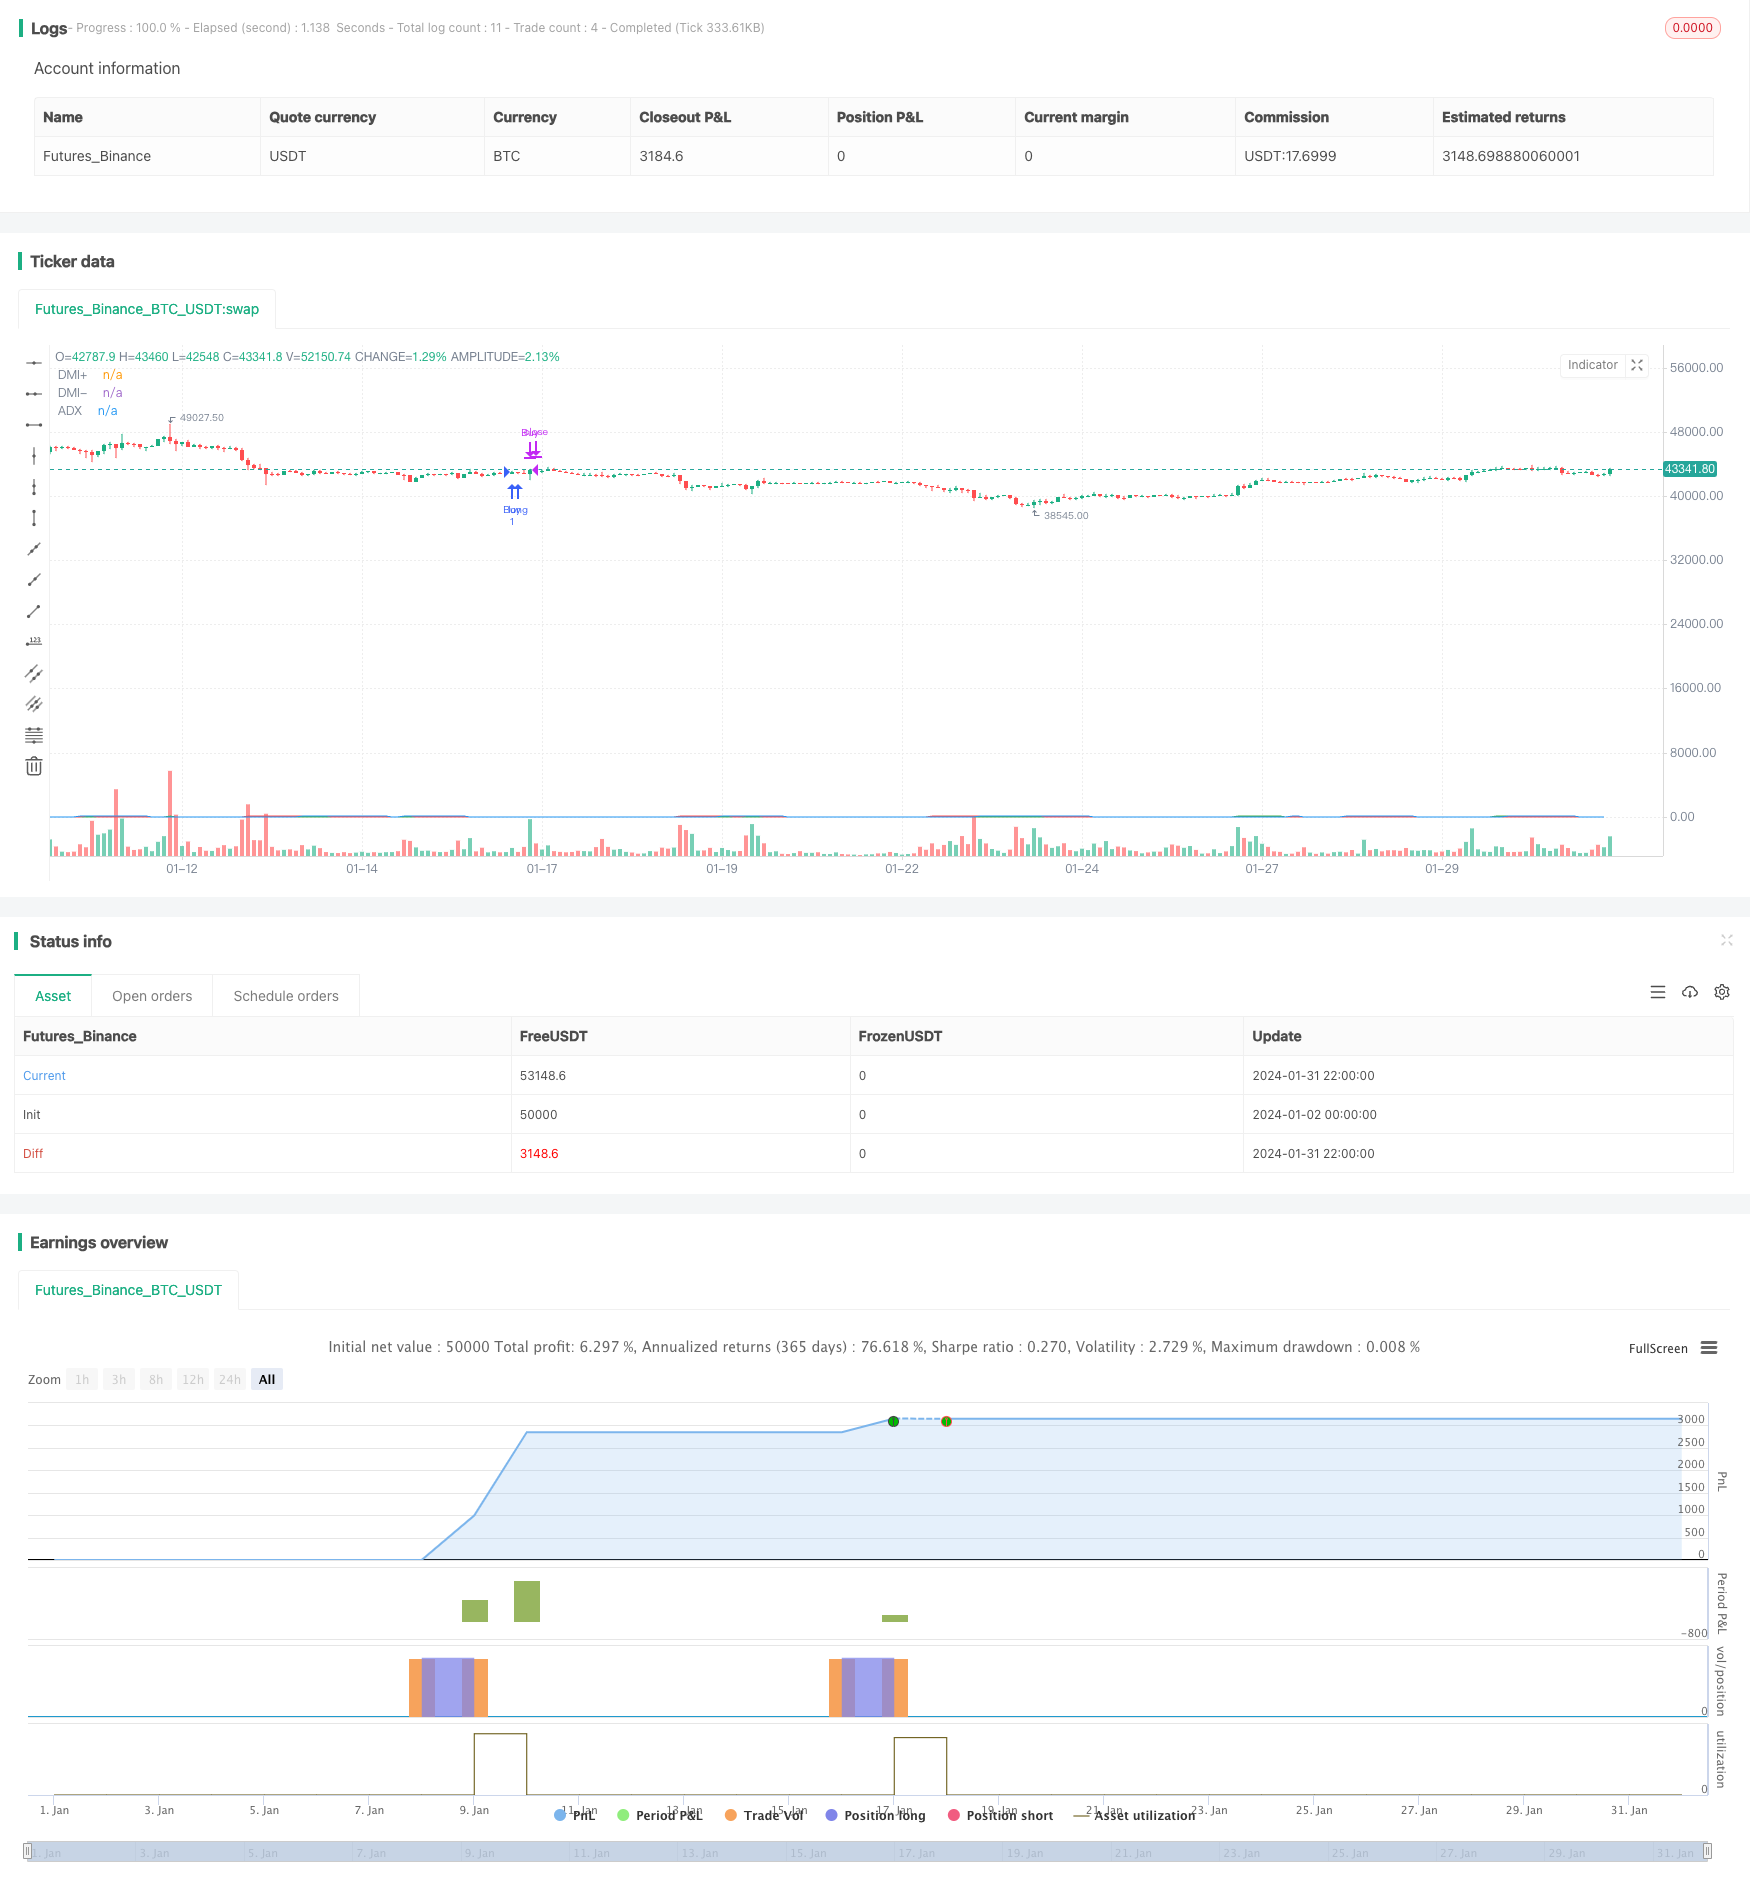
本策略是基于动向指数(DMI)的多空指标进行买卖信号生成的策略。其利用DMI的两个指标DMI+和DMI-的交叉以及和ADX的交叉来判断行情的多空和趋势,从而产生买入和卖出的信号。
该策略主要使用了DMI中的三个指标:DMI+、DMI-和ADX。其中,DMI+反映多头行情的力量,DMI-反映空头行情的力量,ADX则反映市场趋势的力度。
策略的买入信号是:当DMI+上穿DMI-并且上穿ADX时,则产生买入信号,即认为行情由空头转为多头,且趋势开始形成。
策略的卖出信号是:当DMI+下穿DMI-或ADX时,则产生卖出信号,即认为多头力量减弱,应当止损了结。
因此,该策略通过DMI多空指标的交叉情况判断市场的多空和趋势变化,动态调整仓位。
该策略主要有以下几个优势:
-
使用DMI指标判断多空和趋势,可靠性较高,避免错过主要趋势的机会。
-
结合ADX判断趋势力度,可以更准确判断行情的转折点。
-
采用DMI指标的交叉形态作为交易信号,简单明确,容易实现。
-
按照趋势运行,较好控制风险,适合中长线持有。
该策略也存在一些风险:
-
DMI指标存在滞后性,可能导致买点偏后、卖点偏早。
-
ADX指标在判断趋势和盘整的效果一般,可能错过短线机会。
-
存在一定的空仓风险,行情可能出现一直持续上涨或下跌的情况。
-
参数设置可能存在过优化风险,实际运行效果会有折扣。
该策略还可以从以下几个方面进行优化:
-
结合其他指标判断背离,提高买卖点选择的准确性。
-
加入止损机制,避免亏损扩大的风险。
-
调整参数或引入自适应参数设置,减少过优化风险。
-
增加仓位管理,根据趋势阶段动态调整仓位。
本策略基于DMI指标判断多空和趋势,简单实用,在中长线上捕捉主要趋势上具有较好的效果。但也存在一定的滞后性、空仓及参数优化风险。可通过多指标组合、止损机制、自适应参数等手段进行优化,从而获得更好的实盘效果。
||
This strategy generates buy and sell signals based on the Direction Movement Index (DMI) indicators for trend direction. It utilizes the crossover of DMI's two indicators, DMI+ and DMI-, as well as their crossover with ADX to determine the bullish/bearish state and trend of the market, thereby producing entry and exit signals.
The strategy mainly uses three indicators from DMI: DMI+, DMI- and ADX. DMI+ reflects the strength of an uptrend, DMI- reflects the strength of a downtrend, while ADX reflects the trend intensity.
The buy signal is triggered when DMI+ crosses over DMI- and also crosses over ADX, indicating a switch from a bearish to bullish state and an emerging trend.
The sell signal is triggered when DMI+ crosses below either DMI- or ADX, indicating weakening bullish momentum and a need to take profit.
Therefore, the strategy dynamically adjusts positions by judging market sentiment and trend changes using the crossover patterns of the DMI indicators.
The main advantages of this strategy are:
-
Using DMI for trend and sentiment analysis provides reliability in capturing major trends.
-
Incorporating ADX to gauge trend strength allows more accurate identification of inflection points.
-
The simple, clear crossover signals of DMI indicators make this strategy easy to implement.
-
Running with the trend provides good risk control, suitable for medium- to long-term holding periods.
Several risks to note:
-
DMI indicators have some lag, which may result in late buys and premature sells.
-
ADX has mediocre performance in distinguishing between trends and consolidations, thus some short-term opportunities may be missed.
-
There is some risk of holding no positions, in case persistent uptrend or downtrend occurs.
-
Parameter optimization risks exist, which may lead to deteriorated performance in live trading.
Some ways to improve this strategy:
-
Incorporate other indicators to spot momentum divergence, enhancing accuracy of entries and exits.
-
Add stop-loss mechanisms to limit loss in adverse moves.
-
Adjust parameters or introduce adaptive settings to mitigate optimization bias.
-
Implement position sizing to dynamically adjust stakes according to trend stages.
This DMI trend-following strategy is simple and practical for catching major trends over medium- to long-term horizons. However, lags, empty positions, and parameter optimization risks exist. Enhancements through combining indicators, stop losses, adaptive parameters etc. can improve live performance.
[/trans]
Strategy Arguments
| Argument | Default | Description |
|---|---|---|
| v_input_1 | 14 | DMI Length |
Source (PineScript)
//@version=5
strategy("DMI Buy/Sell Strategy", overlay=true)

// Input for DMI
length = input(14, title="DMI Length")
adxsmoothing =14

// Calculate DMI
[diPlus, diMinus, adx] = ta.dmi(length,adxsmoothing)

// Condition for Buy Entry
buyCondition = ta.crossover(diPlus, diMinus) and ta.crossover(diPlus, adx)

// Condition for Sell Exit
sellCondition = ta.crossunder(diPlus,diMinus) or ta.crossunder(diPlus,adx)

// Execute Buy Entry on the next day's open
if buyCondition
    strategy.entry("Buy", strategy.long)

// Execute Sell Exit on the next day's open
if sellCondition
    strategy.close("Buy")

// Plotting DMI components
plot(diPlus, title="DMI+", color=color.green)
plot(diMinus, title="DMI-", color=color.red)

// Plotting ADX
plot(adx, title="ADX", color=color.blue)
Detail
https://www.fmz.com/strategy/440853
Last Modified
2024-02-02 17:07:03