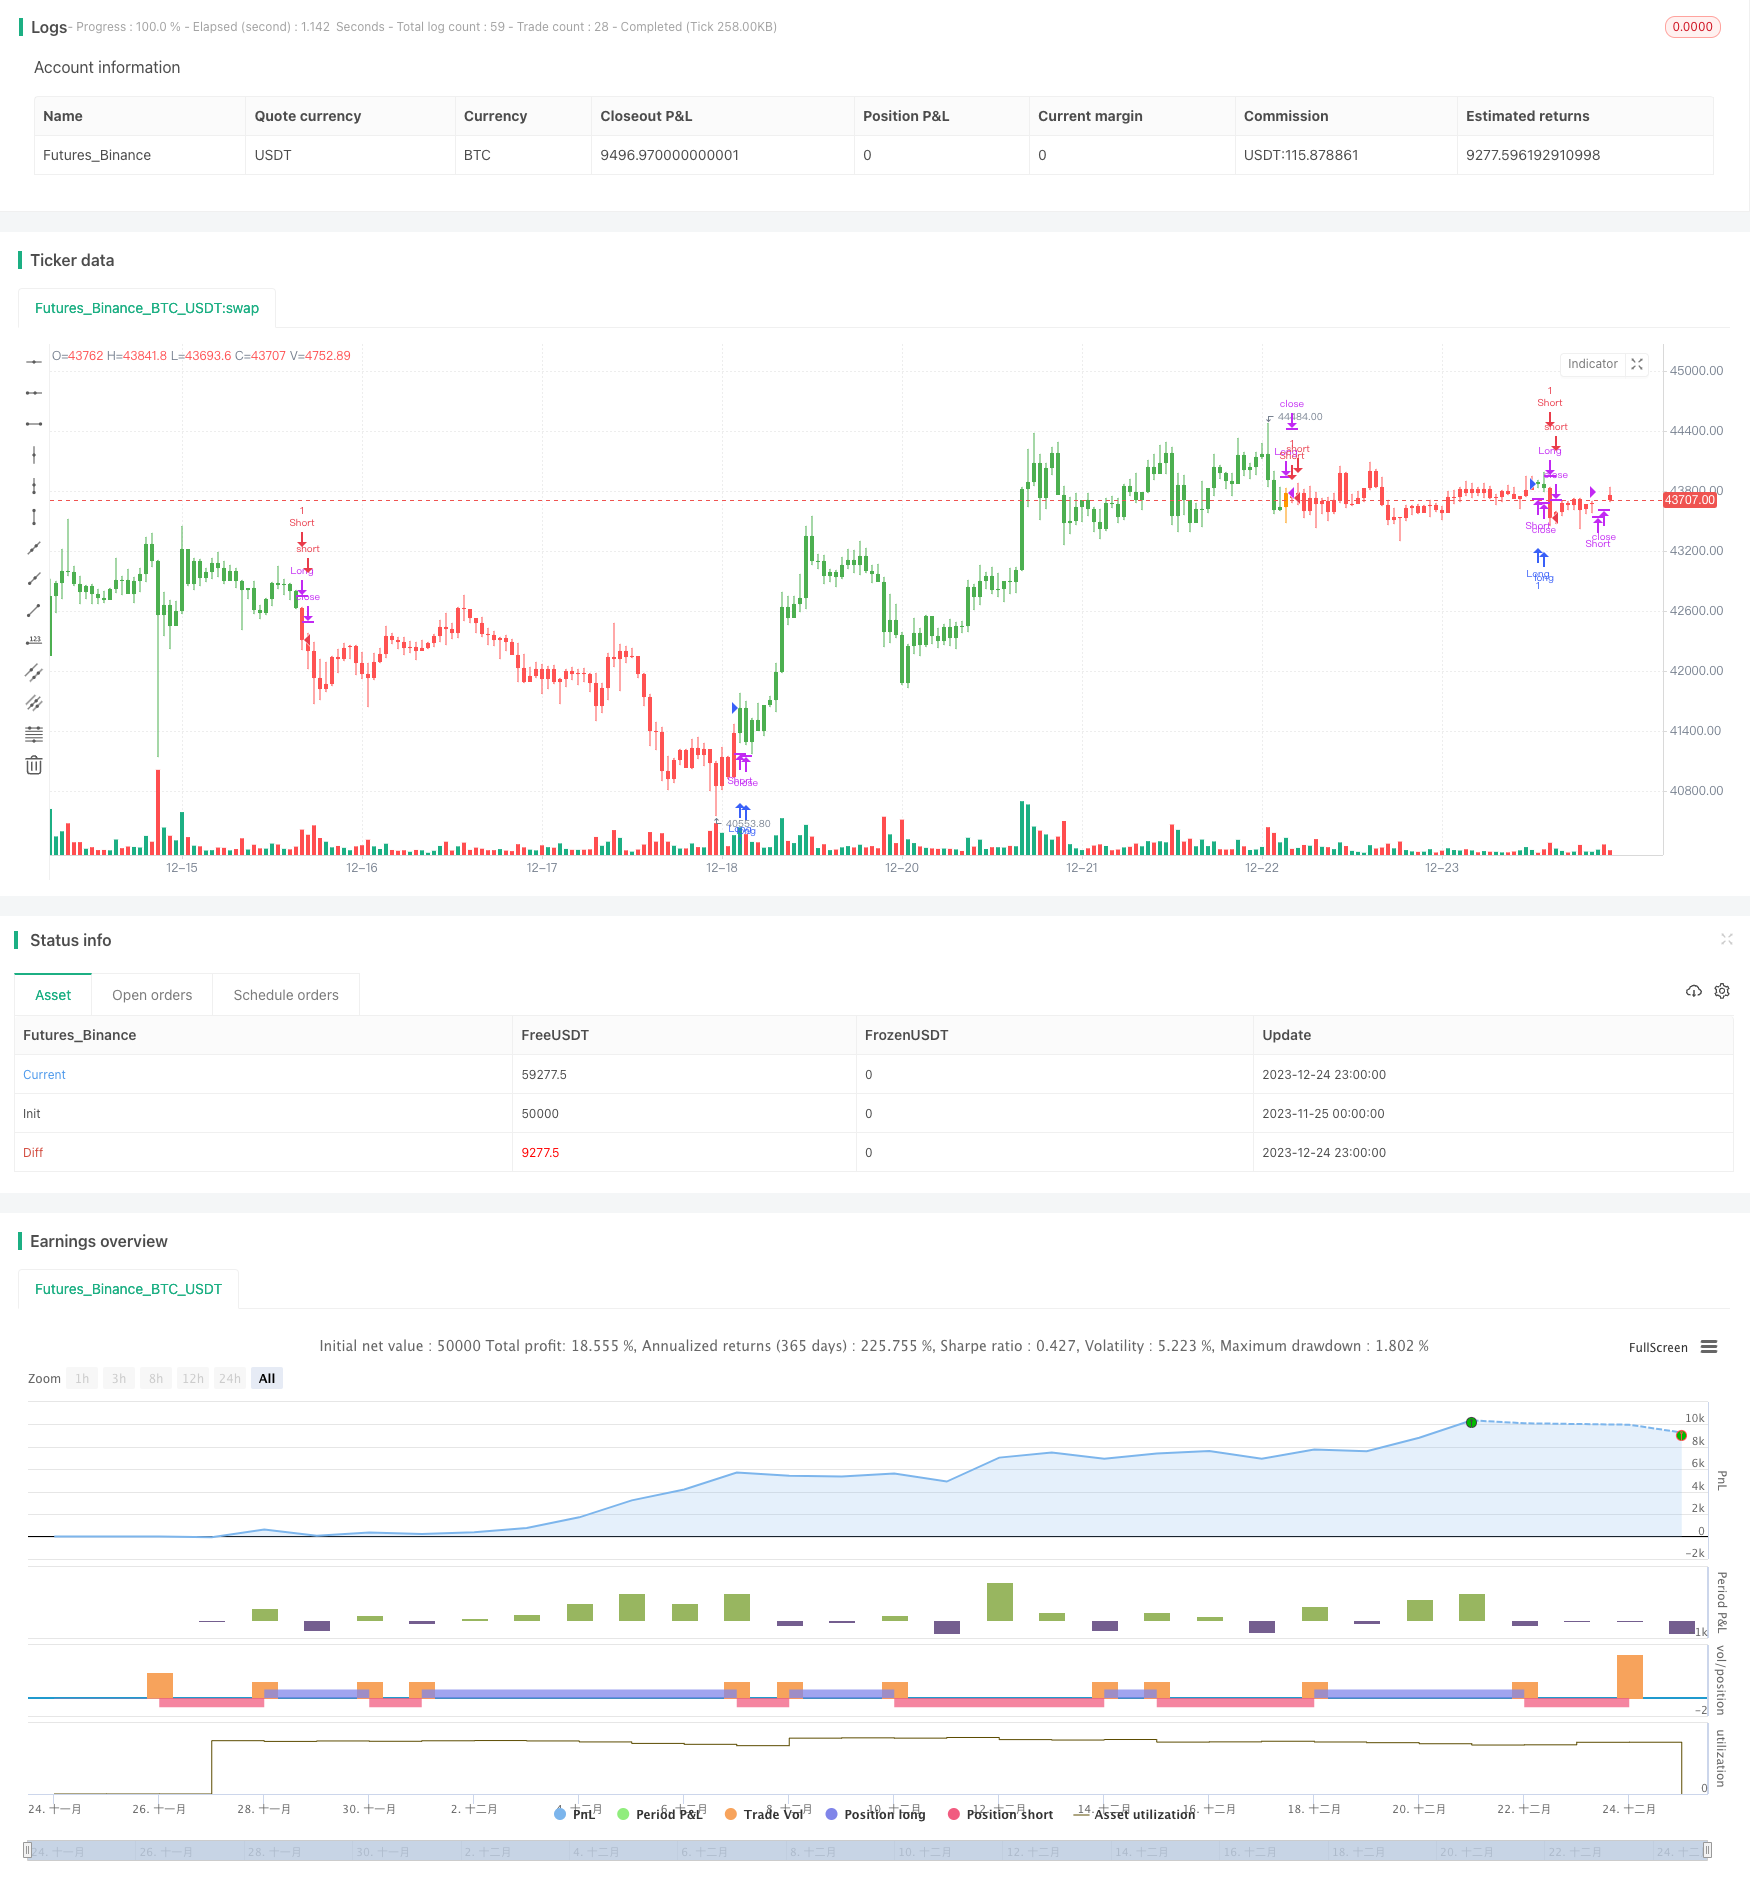
Name
动态支持阻力突破趋势策略Dynamic-Support-Resistance-Breakout-Trend-Strategy
Author
ChaoZhang
Strategy Description
该策略基于长期支持阻力的突破来判断趋势方向,以支持阻力的突破作为入场时机。它使用折线定义高点和低点,以2根K线确认高点/低点,因此有2根K线的滞后。它计算一定周期(默认21)内高点和低点的SMA差值,作为辅助支持阻力位。这一思想来源于synapticEx的Nebula-Advanced-Dynamic-Support-Resistance指标。当价格突破动态支持阻力时,做多做空。
该策略使用以下逻辑判断趋势和交易信号:
-
使用折线判断高低点:当前5根K线中,第5根K线低点低于第4根,第4根低于第3根,第3根高于第2根,第2根高于第1根时,确认第3根K线的低点为最低低点。判断高点同理。
-
计算一定周期(默认21)内高点个数hn和低点个数ln。如果hn>0和ln>0,则计算一定周期内高点的平均值hsum/hn和低点的平均值lsum/ln。它们之间的差额r作为辅助支持阻力位。
-
比较收盘价与动态阻力lvalr和支持位hvalr,判断趋势方向。收盘价超过两者之一则有效突破。
-
当有效突破动态阻力线时,做多;当有效突破动态支持线时,做空。
该策略具有以下优势:
-
使用折线判断支持阻力更为准确,可避免错误突破。
-
基于长期统计的支持阻力更有参考价值,可减少头寸风险。
-
引入辅助支持阻力提高突破的有效性。
-
策略逻辑简单清晰,容易理解实现,适合量化交易。
-
可自定义支持阻力统计周期,适应不同周期和品种。
该策略也存在一些风险:
-
折线确定支持阻力点有2根K线的滞后,可能错过最佳入场点。
-
预测的支持阻力仅供参考,价格仍可能出现无法解释的突破。
-
统计周期长度不当可能导致支持阻力失效。
-
突破后价格调整可能触发止损。
-
作多做空后价格可能产生剧烈波动,带来更大亏损。
对应的风险控制和优化手段有:
-
适当缩短统计周期,减少滞后。
-
结合更多因素预测支持阻力位。
-
测试不同周期参数的稳定性。
-
设置合理止损位。
-
利用仓位控制方法限制单笔亏损。
该策略可以从以下方面进行优化:
-
利用机器学习方法预测支持阻力。可以提高支持阻力突破的成功率。
-
结合交易量CONF指标判断突破的有效性。大量未平仓合约参与突破更有说服力。
-
根据不同周期分类统计支持阻力。例如按照日线、周线等分别统计,提高支持阻力位的有效性。
-
在盈利仓位加仓,设置游离停损平衡盈亏。这可以在保证利润的同时争取更大收益。
-
结合均线指标判断趋势,避免在无明确趋势时盲目做多做空。
该策略整体来说是一种较为稳健可靠的趋势跟踪策略。它正确判断趋势方向的概率较大,而且具有一定的风险控制措施。但由于存在一定滞后,无法百分之百确保每一次的做多做空都能够盈利。因此,它更适合有经验的量化交易者结合自己的策略进行应用。通过优化统计周期参数以及与其他指标或模型的组合,该策略可以成为高效的趋势跟踪策略。
||
This strategy judges the trend direction based on the long-term support/resistance breakout and enters the position when the support/resistance is broken. It uses zigzag to define peaks and valleys, confirming peaks/valleys with 2 bars, so there is 2 bars lag. It calculates the difference between SMA of peaks and valleys in a defined period (21 by default) as alternative SR level. This idea is from synapticEx's Nebula-Advanced-Dynamic-Support-Resistance indicator. It goes long when resistance broken and goes short when support broken.
The strategy uses the following logic to determine trends and trading signals:
-
Confirm peaks/valleys with zigzag: when in last 5 bars, bar 5 peak < bar 4 peak < bar 3 peak > bar 2 peak > bar 1 peak, bar 3 valley is confirmed as lowest valley. Confirm highest peak similarly.
-
Calculate number of peaks hn and valleys ln in defined period (default 21). If hn>0 and ln>0, calculate average level of peaks hsum/hn and average level of valleys lsum/ln. Their difference r is used as alternative SR level.
-
Compare close price with dynamic resistance lvalr and support hvalr to determine trend direction. Breakout of either resistance or support is regarded as valid breakout.
-
Go long when valid breakout of resistance happen. Go short when valid breakout of support happen.
The advantages of this strategy:
-
Using zigzag to confirm SR provides accuracy, avoiding false breakout.
-
SR based on long term statistics is more valuable to reduce risk.
-
Alternative SR improves validity of breakout signals.
-
The logic is simple and easy to understand, suitable for quant trading.
-
Customizable statistic period fits different cycles and products.
Risks of this strategy:
-
2 bars lag with zigzag may miss best entry point.
-
Predicted SR is just for reference, abnormal breakout can still happen.
-
Improper statistic period leads to invalid SR.
-
Price pullback after breakout may trigger stop loss.
-
Violent price swing after entry brings larger loss.
The solutions are:
-
Shorten statistic period properly to reduce lag.
-
Combine more factors to predict SR.
-
Test stability of different periods.
-
Set reasonable stop loss level.
-
Use position sizing to limit single loss.
The strategy can be optimized from aspects below:
-
Use machine learning to predict SR, improving success rate of breakout signals.
-
Combine CONF volume to confirm validity of breakout signals. High open interests makes breakout more convincing.
-
Classify statistic of SR based on different cycles, improving efficiency of SR.
-
Add position on profit, set trail stop to balance profit/loss. Earns more profit while locking gain.
-
Combine MA to determine trend, avoiding blindly long/short without trend.
In conclusion, this is a robust trend following strategy. It has high accuracy in determining trend direction and proper risk control. But the lag makes it impossible to profit from every long/short signal. So it fits experienced quant traders to combine with their own strategies. By optimizing statistic periods and integrating other indicators or models, it can become an efficient trend following strategy.
[/trans]
Strategy Arguments
| Argument | Default | Description |
|---|---|---|
| v_input_1 | 21 | SR lookbak length |
Source (PineScript)
/*backtest
start: 2023-11-25 00:00:00
end: 2023-12-25 00:00:00
period: 1h
basePeriod: 15m
exchanges: [{"eid":"Futures_Binance","currency":"BTC_USDT"}]
*/

//@version=4
strategy("SR TREND STRATEGY", shorttitle="SR TREND", overlay=true, calc_on_order_fills=true)
//based on by synapticEx SR indicator https://www.tradingview.com/script/O0F675Kv-Nebula-Advanced-Dynamic-Support-Resistance/
length = input(title="SR lookbak length", type=input.integer, defval=21)
h = bar_index>5 and high[5]<high[4] and high[4]<high[3] and high[3]>high[2] and high[2]>high[1] ? 1 : 0
l = bar_index>5 and low[5]>low[4]   and low[4]>low[3]   and low[3]<low[2]   and low[2]<low[1]   ? 1 : 0
ln = sum(l, length)
hn = sum(h, length)
hval =  h>0 ? high[3] : 0
lval =  l>0 ? low[3]  : 0
lsum = sum(lval, length)
hsum = sum(hval, length)
r = ln>0 and hn>0 ? abs((hsum/hn) - (lsum/ln)): 0
float lvalc = na
float lvalr = na
float hvalc = na
float hvalr = na
lvalc := lval and r>0 ? lval   : lvalc[1]
lvalr := lval and r>0 ? lval+r : lvalr[1]
hvalc := hval and r>0 ? hval   : hvalc[1]
hvalr := hval and r>0 ? hval-r : hvalr[1]
int trend=0
trend:=close > lvalr and close > hvalr ? 1 : close < lvalr and close < hvalr ? -1 : trend[1]
strategy.close("Long", when=trend==-1)
strategy.close("Short", when=trend==1)
strategy.entry("Long", strategy.long, when=trend==1 and close>hvalc)
strategy.entry("Short", strategy.short, when=trend==-1 and close<lvalc)
int long=0
int short=0
long:= trend==1 and close>hvalc ? 1 : trend==-1 ? -1 : long[1]
short:= trend==-1 and close<lvalc ? 1 : trend==1 ? -1 : short[1]
barcolor(long>0? color.green : short>0? color.red : trend>0? color.white: trend<0 ? color.orange : color.blue)
Detail
https://www.fmz.com/strategy/436641
Last Modified
2023-12-26 15:21:45
