Name
动态止盈追趋策略Dynamic-Take-Profit-Following-Trend-Strategy
Author
ChaoZhang
Strategy Description
[trans]
动态止盈追趋策略通过检测长期趋势和短期回调,实现低买高卖,追捧上涨趋势的目的。该策略同时使用波动单位来检测盈亏大小,使其适用于所有币种而无需担心百分比变化。
该策略 buying的逻辑是:当出现长期上涨趋势(200日EMA上涨,200日RSI大于51)和短期下跌回调(最后2根K线收盘价下跌)时,进行买入开仓。
selling的逻辑是:当价格上涨超过1个波动单位时止盈;当价格下跌超过2个波动单位时止损。
波动单位的计算是:以50日内收盘价标准差的2倍作为基础波动单位。这样可以检测出不同币种自己的波动情况,无需人为设置百分比。
该策略最大的优势是可以动态检测不同币种的波动大小,根据币种本身的波动设置止盈止损单位。这避免了百分比止盈固定设置的问题,可以自动适应更多币种。
另一个优势是结合长短期判断,可以有效过滤假突破。利用长期趋势判断未来可能上涨的币,再结合短期回调信号,可以有效避免布林带squeeze等假信号。
该策略最大的风险在于止盈止损单位的设定。如果波动过大,止盈距离可能过近,无法持续追涨;如果波动过小,则可能止损过快。这需要通过更长周期EMA作为辅助,来避免波动单位判断失误。
另一个风险是策略对短期趋势判断的依赖。如果出现长期上涨但短期不回调的情况,会错过入场时机。这可能需要加入其他辅助判断指标。
该策略可以从以下几个方向进行优化:
-
增加更长周期EMA判断,避免波动单位失误
-
增加交易量等指标来判断趋势,减少对短期k线的依赖
-
优化开仓和平仓条件,设置更严格的入场规则
-
结合机器学习算法判断趋势方向,实现更高胜率
动态止盈追趋策略整体思路清晰,核心在于动态波动单位的设定。该策略可以自动适应不同币种设置盈亏单位,无需人工设置百分比。同时结合长短期双重判断,可以有效滤除假信号。通过进一步优化,该策略可以成为高效率的趋势追踪策略。
||
The Dynamic Take Profit Following Trend strategy detects long-term trends and short-term pullbacks to achieve buying low and selling high, with the goal of chasing uptrends. The strategy also uses volatility units to detect the size of wins and losses so that it can be applied to all coins without worrying about percentage changes.
The buying logic of this strategy is: when a long-term uptrend appears (200-day EMA goes up, 200-day RSI greater than 51) and a short-term pullback happens (last 2 candlesticks show decreased closing prices), long positions are opened.
The selling logic is: take profit when price increases more than 1 volatility unit; stop loss when price decreases more than 2 volatility units.
The volatility unit is calculated as: 2 times the standard deviation of closing prices in the last 50 days. This can detect volatility conditions of different coins automatically without needing manual percentage settings.
The biggest advantage of this strategy is that it can dynamically detect volatility sizes of different coins and set stop loss/take profit levels accordingly. This avoids the problem of fixed percentage settings and can automatically adapt to more coins.
Another advantage is combining long-term and short-term judgments can effectively filter out false breakouts. Using the long-term trend to judge potentially uptrending coins and combining it with short-term pullback signals can avoid false signals like Bollinger squeezes.
The biggest risk of this strategy is the stop loss/take profit unit settings. If volatility is too high, take profit distances may be too close to keep chasing the uptrend; if volatility is too low, stop loss may trigger too fast. This needs longer period EMAs as an assist to avoid errors in volatility unit judgments.
Another risk is the strategy's reliance on short-term trends. If there is a long-term uptrend without a short-term pullback, the entry timing would be missed. This may need additional assist indicators.
The strategy can be optimized in the following directions:
-
Add longer-period EMA judgments to avoid volatility unit errors
-
Add indicators like trading volumes to judge trends, reduce reliance on short-term candlesticks
-
Optimize entry and exit conditions, set stricter entry rules
-
Combine machine learning algorithms to determine trend direction, achieve higher win rate
The Dynamic Take Profit Following Trend Strategy has clear logic at its core—dynamically setting stop loss/take profit units. This strategy can automatically adapt settings across coins without needing manual percentage inputs. Meanwhile, combining double confirmation of long-term and short-term trends can effectively filter out false signals. With further optimizations, this strategy can become a highly efficient trend chasing strategy.
[/trans]
Source (PineScript)
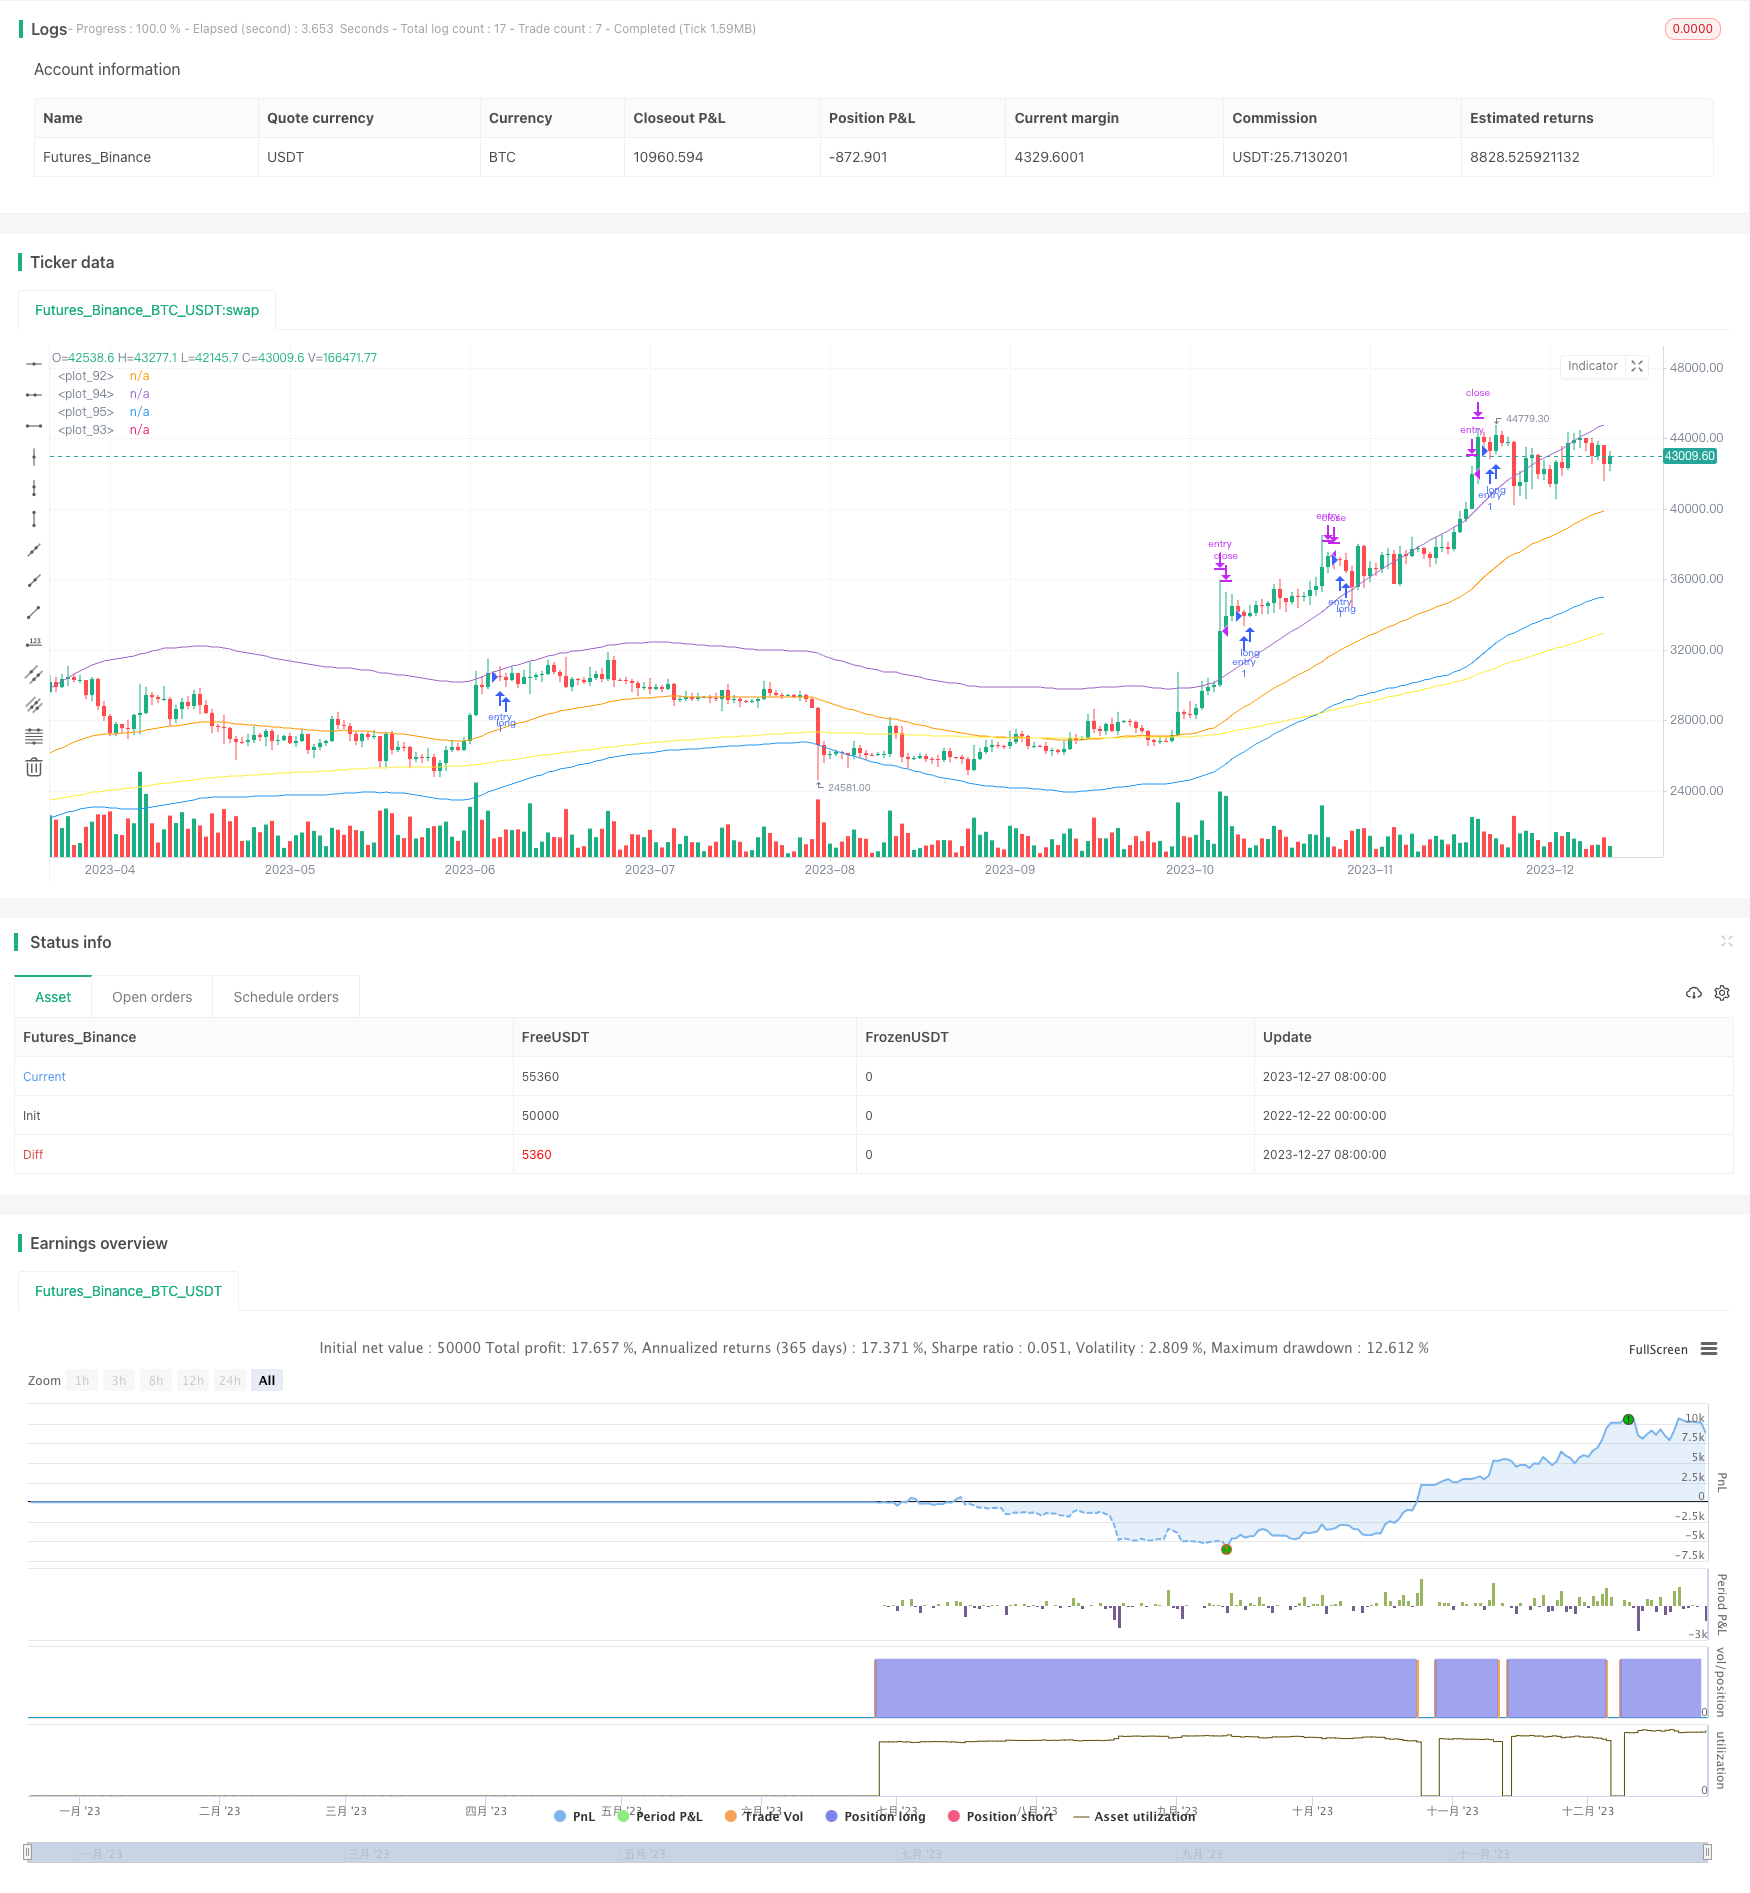
/*backtest
start: 2022-12-22 00:00:00
end: 2023-12-28 00:00:00
period: 1d
basePeriod: 1h
exchanges: [{"eid":"Futures_Binance","currency":"BTC_USDT"}]
*/

// @version=4
// This source code is subject to the terms of the Mozilla Public License 2.0 at https://mozilla.org/MPL/2.0/
// © BHD_Trade_Bot

strategy(shorttitle='Take Profit On Trend',
 title='Take Profit On Trend (by BHD_Trade_Bot)',
 overlay=true,
 initial_capital = 15,
 default_qty_type = strategy.cash,
 default_qty_value = 15,
 commission_type=strategy.commission.percent,
 commission_value=0.1)


//Backtest Time
start_day = 1
start_month = 1
start_year = 2021
end_day = 1
end_month = 1
end_year = 2050
start_time = timestamp(start_year, start_month, start_day, 00, 00)
end_time = timestamp(end_year, end_month, end_day, 23, 59)
is_back_test_time() =>
    time >= start_time and time <= end_time ? true : false

// Last bar
h1_last_bar = (timenow - time)/1000/60/60 < 2


// EMA
ema50 = ema(close, 50)
ema200 = ema(close, 200)

// RSI length 200
rsi200 = rsi(close, 200)

// Bollinger Bands length 50
bb50 = 2 * stdev(close, 50)

// BHD Unit
bhd_unit = sma(bb50, 100)
bb50_upper = ema50 + bhd_unit
bb50_lower = ema50 - bhd_unit


// All n candles is going down
all_body_decrease(n) =>
    isValid = true
    for i = 0 to (n - 1)
        if (close[i] > close[i + 1])
            isValid := false
            break
    isValid


// ENTRY

// Long-term uptrend
entry_condition1 = rsi200 > 51

// Short-term downtrend
entry_condition2 = all_body_decrease(2)

ENTRY_CONDITION = entry_condition1 and entry_condition2

if (ENTRY_CONDITION and is_back_test_time())
    strategy.entry("entry", strategy.long)


// CLOSE CONDITIONS

// Price increase 1 BHD unit
TAKE_PROFIT = close > strategy.position_avg_price + bhd_unit

// Price decrease 2 BHD unit
STOP_LOSS = close < strategy.position_avg_price - bhd_unit * 2

CLOSE_CONDITION = TAKE_PROFIT or STOP_LOSS

if (CLOSE_CONDITION or h1_last_bar)
    strategy.close("entry")


// Draw
plot(ema50)
plot(ema200, color=color.yellow)
plot(bb50_upper)
plot(bb50_lower)
Detail
https://www.fmz.com/strategy/437022
Last Modified
2023-12-29 16:06:54