Name
动态网格交易策略Assassins-Grid-B-A-Dynamic-Grid-Trading-Strategy
Author
ChaoZhang
Strategy Description
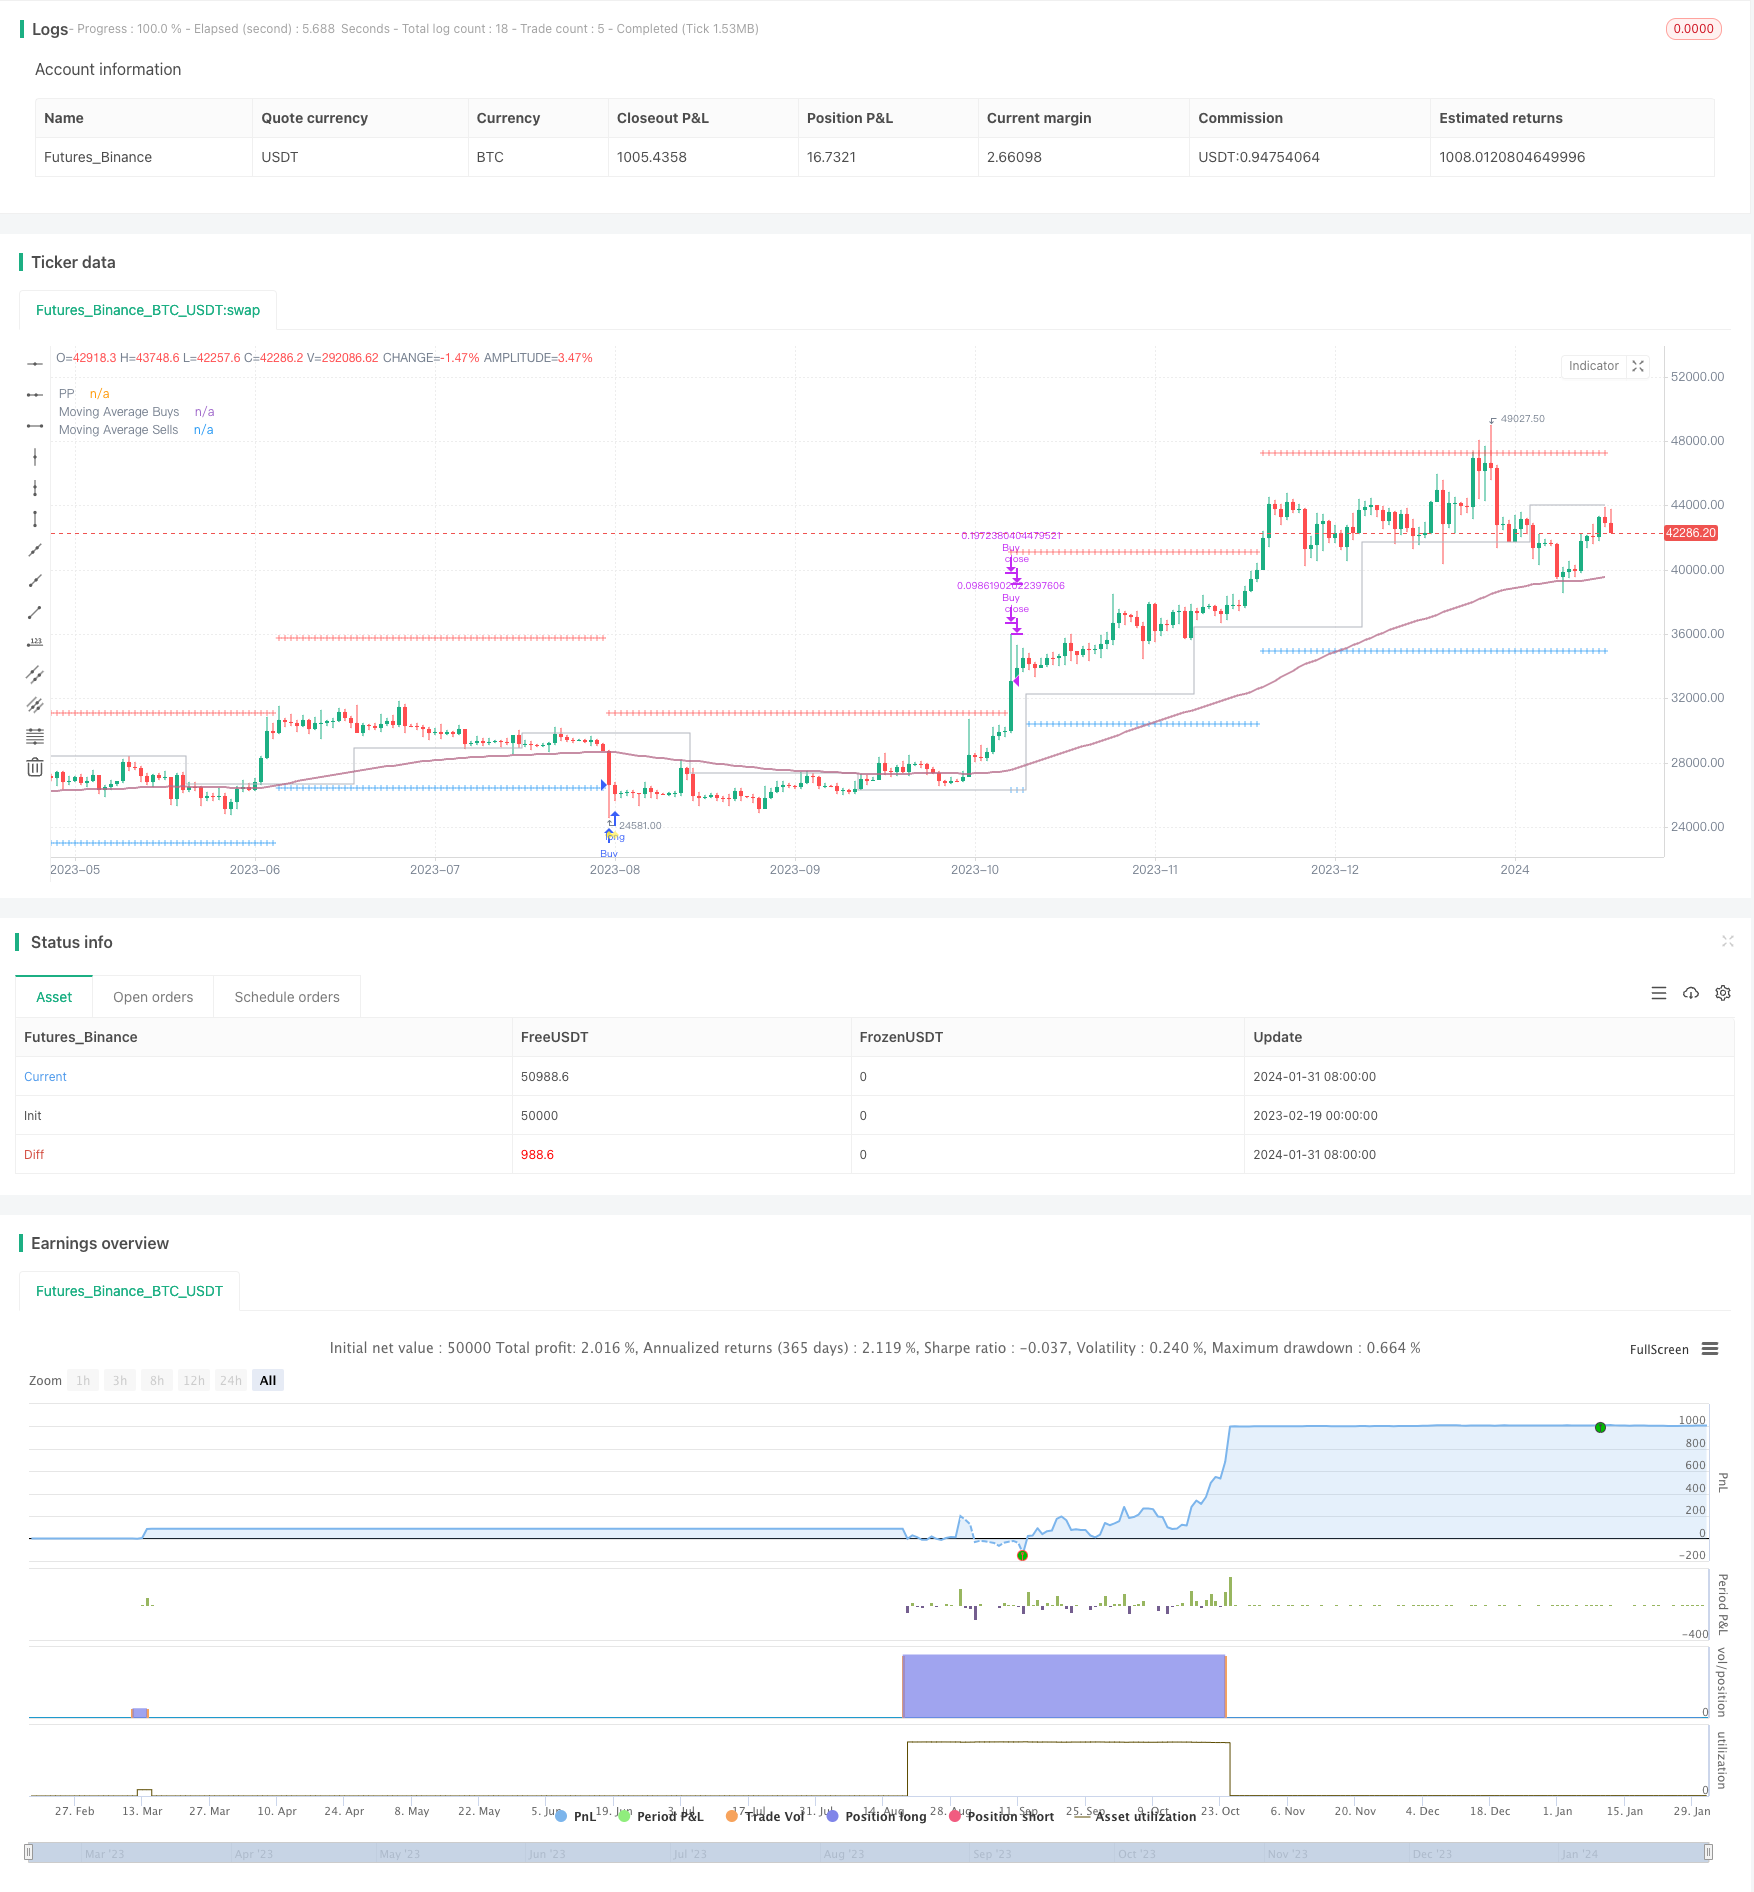
这个Pine脚本提供了一个强大的框架,用于在TradingView中测试和优化网格交易策略。它利用strategy.orders()功能实现自动化网格交易并进行回测。
该策略的核心原理基于动态网格。网格由一系列价格级别组成,用于导引买入和卖出位置。当价格突破每个级别时,会触发相关交易行为。
具体来说,在跌势中,会在支撑位进入更多买单。在涨势中,会在关键的抵抗位平仓以获取收益。网格的宽度和比例会根据市场波动性和交易模式进行调整。
通过这种自动化的网格交易机制,可以有效把握市场双向波动的机会,获取稳定的正收益。
该策略具有以下几大优势:
-
动态网格:可以自定义网格类型、宽度参数和支点分辨率,适应市场动态。
-
智能买入策略:提供多种买入方式,可调整买入数量,控制买单位置。
-
策略性卖出:通过设置数量、控制卖出位置、设定止损条件等方式优化获利。
-
全能交易:可选择现货和保证金交易,满足不同交易偏好。
-
可定制程度高:可调整初始资金、手续费率、保证金率等参数进行优化。
-
信息化面板:直观展示关键交易数据,优化决策。
尽管该策略功能强大,在实盘中使用需谨记一定的风险:
-
回测局限性:过往表现无法完全预测未来结果,盈利不能保证。
-
市场波动:价格可能出现意外变化,影响策略。
-
交易所问题:交易所系统故障可能造成下单失败、执行延迟等。
-
系统故障:用于生成订单、沟通和接收结果的系统可能失效,中断交易流程。
-
时间滞后:实盘交易中时间滞后可能导致异常结果。
需要充分认知这些风险,谨慎操作,适当调整策略,从而进行安全的算法交易。
该策略可在以下方面继续优化:
1.加入止损逻辑,降低极端行情的亏损。
2.结合机器学习算法,实现网格参数的动态调整。
3.引入量化指标,识别趋势和关键价位,提升决策质量。
4.增加风控模块,防止保证金交易的追缴风险。
5.引入跨时间周期分析,提高交易决策的时间效率。
这些优化将使策略在回测和实盘中表现更加卓越。
该Pine脚本提供了测试和优化网格策略的强大框架。虽然功能强大,但实盘执行会略有延迟。如果足够谨慎并做好风险评估,该策略将成为进行自动化网格交易的有效工具,助你在金融市场获取稳定收益。
||
This Pine script offers a robust framework for testing and optimizing grid trading strategies on TradingView using the strategy.orders() functionality for automated execution and backtesting.
The core principle behind this strategy lies in the concept of a dynamic grid system comprising tiers of price levels that guide entries and exits. Trades are triggered when prices breach each grid line.
Specifically, more long positions are entered near support in downtrends. Profits are captured by flattening positions at key resistance levels in uptrends. The grid width and ratios adapt based on market volatility and trading profile.
Through this automated grid mechanism, the strategy aims to capitalize on opportunities from two-way price oscillations to garner consistent positive returns.
The key advantages of this strategy include:
-
Dynamic Grid: Customizable grid type, width settings and pivot resolution to suit market dynamics.
-
Smart Entry Rules: Flexible buy options, position sizing configurations and buy quantity controls based on trends.
-
Tactical Exits: Optimized take-profit approaches via position sizing, sell quantity settings and loss limits.
-
Versatile Setup: Spot or margin trading modes to match assorted trading requirements.
-
Extensive Configurability: Fine-tuned using parameters like initial capital, commissions, margin rates etc.
-
Informative Panel: Intuitive visualizations of vital data to enhance decisions.
Despite the capabilities, real-world usage requires awareness regarding:
-
Backtest Limitations: Past results may not predict future performance accurately.
-
Market Uncertainty: Prices can fluctuate unexpectedly, impacting strategies.
-
Exchange Issues: Failures in broker systems can cause order delays or rejections.
-
System Failures: Disruption in processes for order generation, communication or reception.
-
Time Lag: Delays during live trading may cause unanticipated outcomes.
These inherent risks should be evaluated before engaging in live automated trading using this strategy to enable prudent, measured execution.
Possible optimizations include:
-
Incorporate stop-loss logic to restrict losses in extreme moves.
-
Implement machine learning to dynamically calibrate grid settings.
-
Integrate quant indicators for trend forecasts and key levels to augment decisions.
-
Introduce risk controls to prevent margin call risks.
-
Analyze across timeframes for efficient timing of trade entries and exits.
Such improvements can unlock greater performance both in backtests and live environments.
This Pine script delivers a powerful basis to test and refine grid methodologies. Despite some execution lag, cautious application with informed risk adjustment will enable this strategy to serve as an effective automated grid trading system across financial markets. [/trans]
Strategy Arguments
| Argument | Default | Description |
|---|---|---|
| v_input_string_1 | Geometric (% Fall) | (?GRID)Width Type |
| v_input_float_1 | 75 | Width Parameter |
| v_input_string_2 | 4W | Pivot Point Resolution |
| v_input_timeframe_1 | D | EMA Resolution |
| v_input_int_1 | 100 | MA Length |
| v_input_string_3 | Cash / n Buys | (?BUY)Buy Type |
| v_input_float_2 | 10 | Contracts / Cash / % Cash |
| v_input_int_2 | 4 | N Buys over MA |
| v_input_int_3 | 5 | N Buys under MA (Max.) |
| v_input_int_4 | 2 | Buy all in last Trades |
| v_input_string_4 | Position / n Sells + | (?SELL)Sell Type |
| v_input_float_3 | 5 | Contracts / Cash / % Position |
| v_input_int_5 | 20 | N Sells over MA (Max.) |
| v_input_int_6 | 4 | N Sells under MA |
| v_input_string_5 | Never | Loss Allowed |
| v_input_string_6 | Spot | (?TRADING)Trading Type |
| v_input_float_4 | 10 | % Initial Capital 1st Trade |
| v_input_float_5 | 0.1 | % Commission Value |
| v_input_float_6 | true | % Margin Rate |
| v_input_1 | StartDate | Start of Trading |
| v_input_string_7 | Small | (?PLOTTING)Table Size |
| v_input_2 | true | Level Grid |
| v_input_3 | false | Information Panel |
| v_input_4 | false | Liquidation Price |
Source (PineScript)
/*backtest
start: 2023-02-19 00:00:00
end: 2024-02-01 05:20:00
period: 1d
basePeriod: 1h
exchanges: [{"eid":"Futures_Binance","currency":"BTC_USDT"}]
*/
// This source code is subject to the terms of the Mozilla Public License 2.0 at https://mozilla.org/MPL/2.0/
// © AssassinsGrid
// Embark on an automated grid-based trading journey with this Pine script tailored for backtesting in TradingView using strategy.orders().
// Whether you're a seasoned trader or new to the world of financial markets, this script is designed to enhance your trading experience across various assets.
// It's essential to note that while powerful, this script may have a slightly delayed execution compared to the original Assassin's Grid due to the nature of strategy.orders() and strategy.close() functions,
// which execute on the following bar after the price crosses the grid.
//
// Key Features:
//
// ? Dynamic Grid Configuration: Define the grid type, width, and pivot point resolution to adapt to market dynamics.
//
// ? Smart Buy Strategies: Choose from various buy types, set quantities, and control the number of buy positions based on market trends.
//
// ? Strategic Selling: Optimize sell strategies with flexible options, including setting quantities, controlling sell positions, and defining loss thresholds.
//
// ? Versatile Trading: Select between spot and margin trading modes, offering flexibility for diverse trading preferences.
//
// ⚙️ Detailed Configuration: Fine-tune your strategy with parameters like initial capital, commission values, margin rates, and more.
//
// ? Informative Chart Elements: Visualize critical information with adjustable labels, table size, grid visibility, and an insightful information panel.
//
// Conclusion:
//
// Whether you're a seasoned trader or a trading enthusiast exploring markets beyond cryptocurrencies, this Pine script provides a robust framework for testing and refining your strategies.
// While powerful, be aware that the execution may have a slight delay compared to the original Assassin's Grid.
// Dive into the dynamic world of grid-based trading, explore various configurations, and refine your approach across a spectrum of financial assets. Happy trading! ??
//@version=5
strategy("Assassin's Grid B", shorttitle = "AAGG?", overlay = true, max_labels_count = 500, initial_capital = 10000, default_qty_value = 0, process_orders_on_close = true)
// INPUTS
// Grid parameters
WOption = input.string('Geometric (% Fall)', 'Width Type', ['Arithmetic (Price)', 'Geometric (% Sell)', 'Geometric (% Fall)'], group = "GRID", tooltip = "Select the type of width for the grid:\n\n- Arithmetic (Price): Fixed width in price units, maintaining constant separation on the chart.\n\n- Geometric (% Sell): Width based on a percentage of the sell price, dynamically adjusting grid lines. (Typically between 5-15%)\n\n- Geometric (% Fall): Width based on a percentage of potential market decline from the last sale, helping visualize potential drops. (Usually between 40-80%)")
Width = input.float(75, 'Width Parameter', minval = 0, step = 0.5, group = "GRID", tooltip = "Set the width parameter for the grid. Larger values result in wider grid lines.")
ppPeriod = input.string('4W', 'Pivot Point Resolution', group = "GRID", tooltip = "Set the resolution for the Pivot Point. Type a timeframe that suits your trading style: 'H, D, W, M'")
MARes = input.timeframe('D', 'EMA Resolution', group = "GRID", tooltip = "Set the resolution for the Exponential Moving Average (EMA). Choose a timeframe that suits your analysis.")
MALength = input.int(100, 'MA Length', minval = 1, group = "GRID", tooltip = "Set the length for the Moving Average (MA). This affects the responsiveness of the MA to price changes.")
// Buy
BuyType = input.string('Cash / n Buys', 'Buy Type', ['Contracts', 'Cash', '% Cash', 'Cash / n Buys', 'Cash / n Buys +'], group = "BUY", tooltip = "Select the type of buy: \n- Contracts: Specify the number of contracts to buy. \n- Cash: Specify the amount of cash to invest. \n- % Cash: Specify the percentage of available cash to invest. \n- Cash / n Buys: Distribute available cash equally across n buy positions. \n- Cash / n Buys +: Similar to Cash / n Buys, but the quantity on each buy increases proportionally with the buy number.")
BuyQ = input.float(10.0, 'Contracts / Cash / % Cash', minval = 0, group = "BUY", tooltip = "Set the quantity for buy. For 'Contracts' mode, it represents the number of contracts to buy. For 'Cash' and '% Cash' modes, it represents the amount to invest or the percentage of cash to invest, respectively.")
NBuysUp = input.int(4, 'N Buys over MA', minval = 1, maxval = 30, group = "BUY", tooltip = "Set the maximum number of buy positions allowed above the Moving Average (MA). This helps control the number of buys in an uptrend.")
NBuysDown = input.int(5, 'N Buys under MA (Max.)', minval = 1, maxval = 30, group = "BUY", tooltip = "Set the maximum number of buy positions allowed below the Moving Average (MA). This helps control the number of buys in a downtrend.")
LastXtrades = input.int(2, 'Buy all in last Trades', minval = 0, maxval = 10, group = "BUY", tooltip = "Set the number of the most recent buy trades to consider for making a buy decision. For the '% Cash' option only, this setting enables buying all available cash in the last specified number of trades.")
// Sel
SellType = input.string('Position / n Sells +', 'Sell Type', ['Contracts', 'Cash', '% Position', 'Position / n Sells', 'Position / n Sells +'], group = "SELL", tooltip = "Select the type of sell: \n- Contracts: Specify the number of contracts to sell. \n- Cash: Specify the amount of cash to disinvest. \n- % Position: Specify the percentage of the position to sell. \n- Position / n Sells: Distribute the position equally across n sell positions. \n- Position / n Sells +: Similar to Position / n Sells, but the quantity on each sell increases proportionally with the sell number.")
SellQ = input.float(5.0, 'Contracts / Cash / % Position', minval = 0, group = "SELL", tooltip = "Set the quantity for sell. For 'Contracts' mode, it represents the number of contracts to sell. For 'Cash' and '% Position' modes, it represents the amount to disinvest or the percentage of the position to sell, respectively.")
NSellsUp = input.int(20, 'N Sells over MA (Max.)', minval = 1, maxval = 30, group = "SELL", tooltip = "Set the maximum number of sell positions allowed above the Moving Average (MA). This helps control the number of sells in an uptrend.")
NSellsDown = input.int(4, 'N Sells under MA', minval = 1, maxval = 30, group = "SELL", tooltip = "Set the maximum number of sell positions allowed below the Moving Average (MA). This helps control the number of sells in a downtrend.")
LossAllowed = input.string('Never', 'Loss Allowed', ['Never', 'Last buy', 'Always'], group = "SELL", tooltip = "Set the loss allowed criteria: \n- Never: No loss allowed for selling. \n- Last buy: Allow selling if the current price is above the price of the last buy. \n- Always: Allow selling at any price.")
// Trading
TradingType = input.string('Spot', 'Trading Type', ['Spot', 'Margin'], group = "TRADING", tooltip = "Select the type of trading: \n- Spot: Regular trading without margin. \n- Margin: Trading with margin, allowing for leveraged positions.")
InitialContracts = input.float(10.0, '% Initial Capital 1st Trade', minval = 1, maxval = 100, group = "TRADING", tooltip = "Set the percentage of the initial capital to be used for the first trade. This determines the position size for the first trade.") / 100
CommissionValue = input.float(0.1, '% Commission Value', minval = 0, maxval = 100, step = 0.1, group = "TRADING", tooltip = "Set the percentage of the trade value to be considered as a commission. This is deducted from the trading capital.") / 100
MarginRate = input.float(1.0, '% Margin Rate', minval = 0, maxval = 100, step = 0.5, group = "TRADING", tooltip = "Set the percentage of margin rate to be applied. This is relevant only in margin trading scenarios.") / 100
StartDate = timestamp('01 Jan 1970 00:00 +000')
testPeriodStart = input(StartDate, 'Start of Trading', group = "TRADING", tooltip = "Set the start date for trading. The strategy will start evaluating trades from this date onwards.")
TableSizeInput = input.string('Small', 'Table Size', ['Auto', 'Tiny', 'Small', 'Normal', 'Large', 'Huge'], group = "PLOTTING", tooltip = "Set the size of the information table. Choose a size that suits your preference.")
ShowGrid = input(true, 'Level Grid', group = "PLOTTING", tooltip = "Show or hide the level grid on the chart. The grid represents price levels.")
ShowPanel = input(false, 'Information Panel', group = "PLOTTING", tooltip = "Show or hide the information panel on the chart. The panel displays key information about the strategy and current market conditions.")
ShowLiquidationPrice = input(false, 'Liquidation Price', group = "PLOTTING", tooltip = "Show or hide the liquidation price on the chart. The liquidation price is the level at which liquidation may occur, if applicable.")
// VARIABLES
// Grid levels on buys
var float _ldown = na
bool _pb = false
bool _buy = false
// Grid levels on sells
var float _lup = na
bool _ps = false
bool _sell = false
// First Buy
CloseFirstBar = ta.valuewhen(bar_index == 0, open, 0)
TimeFirstBar = ta.valuewhen(bar_index == 0, time, 0)
CloseStart = ta.valuewhen(time <= testPeriodStart, open, 0)
FirstClose = testPeriodStart > TimeFirstBar ? CloseStart : CloseFirstBar
TimeFirstClose = testPeriodStart > TimeFirstBar ? testPeriodStart : TimeFirstBar
// Buy and Sell prices
var float FinalBuyPrice = na
var float FinalSellPrice = na
var float FinalOpenPrice = na
var float BuyLimitPrice = na
var float SellLimitPrice = na
// Number of trades
var int nBuys = na
nBuys := nz(nBuys[1])
var int nSells = na
nSells := nz(nSells[1])
var int NBuys = NBuysDown
var int NSells = NSellsDown
// Quantities
var float BuyQuantity = 0
var float BuyAmount = 0
var float SellQuantity = 0
var float SellAmount = 0
var float Commission = 0
var float Gains = 0
var float Losses = 0
// Position calculation
var float PositionCash = 0
var float PositionSize = 0
var int BarIndex = 0
// Average Price Calculation
var float AvgPrice = 0
var float hl2Bar = 0
// Backtest information
var float Balance = 500000
var float Equity = 0
var float RealizedPnL = 0
var float PRealizedPnL = 0
var float Floating = 0
var float PFloating = 0
var float URealizedPnL = 0
var float PURealizedPnL = 0
var float Cash = Balance
var float Margin = 0
var float BuyAndHold = 0
var float PBuyAndHold = 0
var float CLeverage = 0
var float LiquidationPrice = 0
var bool Liquidation = false
var float ProfitFactor = 0
var int TradingTime = 0
// Fibonacci Pivots level calculation
var float PP = open
// Information panel
label labelBalance = na
// Analyzing when the period changes
bool PeriodChange = false
// Grid with arrays
aDown = array.new_float(30)
aUp = array.new_float(30)
aBuy = array.new_bool(30)
aSell = array.new_bool(30)
// Labels size
fTextSize(_SizeInput)=>
if _SizeInput == 'Auto'
size.auto
else if _SizeInput == 'Tiny'
size.tiny
else if _SizeInput == 'Small'
size.small
else if _SizeInput == 'Normal'
size.normal
else if _SizeInput == 'Normal'
size.normal
else if _SizeInput == 'Large'
size.large
else if _SizeInput == 'Huge'
size.huge
// Variable reference
var float MaxFinalOpenPrice = FirstClose
// Value of the MA
var float sMAValue = na
// GRID
// Function to calculate the Width
fWidth(_Width) =>
// If price is constant
if WOption == 'Arithmetic (Price)'
_Width
// If price is the Max % of the next Sell
else if WOption == 'Geometric (% Sell)'
MaxFinalOpenPrice * (_Width / 100)
// If price is a part of the % of the maximum fall
else if WOption == 'Geometric (% Fall)'
MaxFinalOpenPrice / NBuysDown * (_Width / 100)
// Origin from Rounded Pivot Points or last Sell
fDownGrid(_GridWidth) =>
if na(FinalOpenPrice)
FirstClose
else
if FinalSellPrice <= PP
if PositionSize > 0
if na(FinalBuyPrice)
if WOption == 'Arithmetic (Price)'
(math.floor(FinalSellPrice / _GridWidth) * _GridWidth) - _GridWidth
else
FinalSellPrice - _GridWidth
else
FinalBuyPrice - _GridWidth
else if PositionSize == 0
if WOption == 'Arithmetic (Price)'
(math.floor(PP / _GridWidth) * _GridWidth) - _GridWidth
else
PP
else
if na(FinalBuyPrice)
if WOption == 'Arithmetic (Price)'
(math.floor(PP / _GridWidth) * _GridWidth) - _GridWidth
else
if (FinalSellPrice - _GridWidth) > PP
PP
else
(FinalSellPrice - _GridWidth)
else
FinalBuyPrice - _GridWidth
// Origin for sells from Rounded Position Price
fUpGrid(_GridWidth) =>
if na(FinalSellPrice)
if LossAllowed == 'Never'
if WOption == 'Arithmetic (Price)'
math.ceil(math.max(AvgPrice, (FinalBuyPrice + _GridWidth)) / _GridWidth) * _GridWidth
else
math.max(AvgPrice, (FinalBuyPrice + _GridWidth))
else if LossAllowed == 'Last buy'
if nBuys == NBuys
FinalBuyPrice + _GridWidth
else
if WOption == 'Arithmetic (Price)'
math.ceil(math.max(AvgPrice, (FinalBuyPrice + _GridWidth)) / _GridWidth) * _GridWidth
else
math.max(AvgPrice, (FinalBuyPrice + _GridWidth))
else if LossAllowed == 'Always'
FinalBuyPrice + _GridWidth
else
FinalSellPrice + _GridWidth
// FUNCTIONS
// Function to sum factorial
fSum(_Num)=>
(math.pow(_Num, 2) + _Num) / 2
// Function when "Cash / n Buys" or "Position / n Sells"
fCaPo_N(_N, _n) =>
1 / (_N - nz(_n))
// Function when "Cash / n Buys +" or "Position / n Sells +"
fCaPo_Nplus(_OnSells, _N, _n) =>
if TradingType == 'Spot' or _OnSells == 1
(nz(_n)+1) / (fSum(_N) - fSum(nz(_n)))
else
(nz(_n)+1) / fSum(_N)
// One of the correct ways to use security
f_security(_sym, _res, _src, _rep) =>
request.security(_sym, _res, _src[not _rep and barstate.isrealtime ? 1 : 0])[_rep or barstate.isrealtime ? 0 : 1]
// Pivot points
PP := f_security(syminfo.tickerid, ppPeriod, hlc3, false)
// Moving Average
MA = ta.ema(close, MALength)
sMA = f_security(syminfo.tickerid, MARes, MA, false)
// Analyzing when the period changes
PeriodChange := ta.change(time(ppPeriod)) != 0
// On Bullish trend, less Number of Buys and more amounts per trade;
// on Bearish more Number of Buys and less amounts per trade
// Max. number of buys
NBuys := if (BuyType == "Cash / n Buys" or BuyType == "Cash / n Buys +")
if BuyLimitPrice >= sMAValue
NBuysUp
else
NBuysDown
else
NBuysDown
// On Bullish trend, more Number of Sells and less amounts per trade;
// on Bearish less Number of Sells and more amounts per trade
// Max. number of sells
NSells := if (SellType == "Position / n Sells" or SellType == "Position / n Sells +")
if SellLimitPrice < sMAValue
NSellsDown
else
NSellsUp
else
NSellsUp
// TRADING
// Start of trading
if time >= TimeFirstClose
// Final Trade Price, Average Price & Backtest
for _i = 1 to math.max(NBuys, NSells)
// Grid on Buys
array.insert(aDown, _i, fDownGrid(fWidth(Width)))
// Crossing between price and levels of grid
array.insert(aBuy, _i, (low <= array.get(aDown, _i) or open <= array.get(aDown, _i)) and nBuys <= NBuys-1)
// Grid on Sells
array.insert(aUp, _i, fUpGrid(fWidth(Width)))
// Crossing between price and levels of grid
array.insert(aSell, _i, (high >= array.get(aUp, _i) or open >= array.get(aUp, _i)) and nSells <= NSells-1)
strategy.initial_capital = 50000
// Financial Data
RealizedPnL := Balance - strategy.initial_capital
PRealizedPnL := (RealizedPnL / strategy.initial_capital) * 100
Floating := ((close - AvgPrice) / AvgPrice) * PositionSize * AvgPrice
PFloating := (Floating / Balance) * 100
URealizedPnL := RealizedPnL + Floating
PURealizedPnL := (URealizedPnL / strategy.initial_capital) * 100
Equity := Balance + Floating
Margin := TradingType == 'Spot' ? 0 : (PositionSize * AvgPrice * MarginRate)
Cash := TradingType == 'Spot' ? math.max(0, Balance - (PositionSize * AvgPrice)) : math.max(0, Balance - Margin)
BuyAndHold := ((close - FirstClose) / FirstClose) * strategy.initial_capital
PBuyAndHold := (BuyAndHold / strategy.initial_capital) * 100
CLeverage := (PositionSize * AvgPrice) / Balance
LiquidationPrice := TradingType == 'Spot' ? 0 : AvgPrice - ((Balance - (Margin * 1)) / PositionSize)
Liquidation := (ta.valuewhen(LiquidationPrice >= low, time , 0) <= timenow)
ProfitFactor := Gains / Losses
TradingTime := timenow - TimeFirstClose
// Quantities to buy according to inputs
if BuyType == "Contracts"
if na(FinalOpenPrice)
BuyQuantity := ((Cash * InitialContracts) / FirstClose)
else
BuyQuantity := math.min((Cash / AvgPrice), BuyQ)
else if BuyType == "Cash"
if na(FinalOpenPrice)
BuyQuantity := (Cash * InitialContracts)
else
BuyQuantity := math.min(Cash, BuyQ)
else if BuyType == "% Cash"
if na(FinalOpenPrice)
BuyQuantity := (Cash * InitialContracts)
else
if nBuys >= NBuys - LastXtrades
BuyQ := (1 / (NBuys - nz(nBuys))) * 100
BuyQuantity := math.min(Cash, (BuyQ / 100) * Cash)
else if BuyType == "Cash / n Buys"
if na(FinalOpenPrice)
BuyQuantity := (Cash * InitialContracts)
else
BuyQuantity := math.min(Cash, fCaPo_N(NBuys, nBuys) * Cash)
else if BuyType == "Cash / n Buys +"
if na(FinalOpenPrice)
BuyQuantity := (Cash * InitialContracts)
else
BuyQuantity := math.min(Cash, fCaPo_Nplus(0, NBuys, nBuys) * Cash)
// Quantities to sell according to inputs
if SellType == "Contracts"
SellQuantity := math.min(PositionSize, SellQ)
else if SellType == "Cash"
SellQuantity := math.min((PositionSize * AvgPrice), SellQ)
else if SellType == "% Position"
SellQuantity := math.min(PositionSize, (SellQ / 100) * PositionSize)
else if SellType == "Position / n Sells"
SellQuantity := math.min(PositionSize, fCaPo_N(NSells, nSells) * PositionSize)
else if SellType == "Position / n Sells +"
SellQuantity := math.min(PositionSize, fCaPo_Nplus(1, NSells, nSells) * PositionSize)
// First buy limit order from every change of the period
if (PP != PP[1]) and nz(nBuys) == 0 and not nz(nSells) == 0 and not na(nBuys) and not na(fDownGrid(fWidth(Width)))
// Value of the MA
sMAValue := sMA
// Buy price of the limit order
BuyLimitPrice := fDownGrid(fWidth(Width))
// Buying at better Price
if array.get(aBuy, _i) and BuyQuantity > 0
// Value of the MA
sMAValue := sMA
// Price of buy orders and resetting sales
FinalBuyPrice := math.min(open, array.get(aDown, _i))
FinalSellPrice := na
FinalOpenPrice := FinalBuyPrice
// Number of buys and resetting sales
nBuys += 1
nSells := na
// Redefining buy quantity
if BuyType == "Contracts"
BuyAmount := BuyQuantity
else
BuyAmount := (BuyQuantity / FinalBuyPrice)
// Calculating the priority and secondary price average
PositionCash += FinalBuyPrice * BuyAmount
PositionSize += BuyAmount
AvgPrice := PositionCash / PositionSize
// Calculating net profit
Balance -= (BuyAmount * FinalBuyPrice * CommissionValue)
// Comissions losses
Losses += (BuyAmount * FinalBuyPrice * CommissionValue)
// Fees paid
Commission += (BuyAmount * FinalBuyPrice * CommissionValue)
// Avoiding overlap
BarIndex := bar_index
// Variable reference
MaxFinalOpenPrice := math.max(FinalBuyPrice, nz(MaxFinalOpenPrice))
// Buy & Sell price of the limit orders
if nBuys <= NBuys-1
BuyLimitPrice := FinalBuyPrice - fWidth(Width)
else
BuyLimitPrice := na
SellLimitPrice := fUpGrid(fWidth(Width))
// Strategy orders
strategy.order("Buy", strategy.long, BuyAmount)
// Buy shapes
//string BuyText = str.tostring(BuyAmount,'#.####') + "\n" + str.tostring(((BuyAmount * FinalBuyPrice) / Cash) * 100, '#.##') + "%"
//c_BuyGrad = color.from_gradient(((NBuys - nBuys) / NBuys) * 100, 1, 100, color.lime, color.blue)
//label.new(bar_index, FinalBuyPrice, BuyText, textcolor = color.new(color.white, 50), color = c_BuyGrad, style = label.style_diamond, size = fTextSize(LabelSizeInput))
// Selling at better Price
else if array.get(aSell, _i) and SellQuantity > 0 and BarIndex != bar_index
// Value of the MA
sMAValue := sMA
// Price of sale orders and resetting buys
FinalBuyPrice := na
FinalSellPrice := math.max(open, array.get(aUp, _i))
FinalOpenPrice := FinalSellPrice
// Number of sales and resetting buys
nBuys := na
nSells += 1
// Redefining sell quantity
if SellType == "Cash"
SellAmount := SellQuantity / FinalSellPrice
else
SellAmount := SellQuantity
// Calculating the priority and resetting secondary price average
PositionCash -= AvgPrice * SellAmount
PositionSize -= SellAmount
// Calculating net profit
Balance += (FinalSellPrice - AvgPrice) * SellAmount
Balance -= (SellAmount * FinalSellPrice * CommissionValue)
// Gains and Losses
if FinalSellPrice >= AvgPrice
Gains += (FinalSellPrice - AvgPrice) * SellAmount
else
Losses += (AvgPrice - FinalSellPrice) * SellAmount
// Comission losses
Losses += (SellAmount * FinalSellPrice * CommissionValue)
// Fees paid
Commission += (SellAmount * FinalSellPrice * CommissionValue)
// Variable reference
MaxFinalOpenPrice := FinalSellPrice
// Buy & Sell price of the limit orders
BuyLimitPrice := fDownGrid(fWidth(Width))
if nSells <= NSells-1
SellLimitPrice := FinalSellPrice + fWidth(Width)
else
SellLimitPrice := na
// Strategy orders
strategy.close("Buy", comment = 'Sell', qty = SellAmount)
// Sell shapes
//string SellText = str.tostring(SellAmount,'#.####') + "\n" + str.tostring((SellAmount / (PositionSize + SellAmount)) * 100, '#.##') + "%"
//c_SellGrad = color.from_gradient(((NSells - nSells) / NSells) * 100, 1, 100, color.yellow, color.red)
//label.new(bar_index, FinalSellPrice, SellText, textcolor = color.new(color.white, 50), color = c_SellGrad, style = label.style_diamond, size = fTextSize(LabelSizeInput))
// PLOTTING
// Price of the limit orders
bool LastBar = (time >= timenow - (timeframe.multiplier * 1000 * 60))
plotshape(ShowGrid ? BuyLimitPrice : na, "Buy level", shape.cross, location.absolute, color.new(color.blue, 30), size = size.auto)
plotshape(ShowGrid ? SellLimitPrice : na, "Sell level", shape.cross, location.absolute, color.new(color.red, 30), size = size.auto)
// Table
var InfoPanel = table.new(position.middle_left, 2, 12, na, color.new(color.white, 80), 1, color.new(color.white, 80), 1)
ftable(_table_id, _column, _row, _text, _bgcolor) =>
table.cell(_table_id, _column, _row, _text, 0, 0, _bgcolor, text.align_left, text.align_center, fTextSize(TableSizeInput), na)
tfString(int timeInMs) =>
// @function Produces a string corresponding to the input time in days, hours, and minutes.
// @param (series int) A time value in milliseconds to be converted to a string variable.
// @returns (string) A string variable reflecting the amount of time from the input time.
float s = timeInMs / 1000
float m = s / 60
float h = m / 60
float d = h / 24
float mo = d / 30.416
int tm = math.floor(m % 60)
int th = math.floor(h % 24)
int td = math.floor(d % 30.416)
int tmo = math.floor(mo % 12)
int ys = math.floor(d / 365)
string result =
switch
d == 30 and th == 10 and tm == 30 => "1M"
d == 7 and th == 0 and tm == 0 => "1W"
=>
string yStr = ys ? str.tostring(ys) + "Y " : ""
string moStr = tmo ? str.tostring(tmo) + "M " : ""
string dStr = td ? str.tostring(td) + "D " : ""
string hStr = th ? str.tostring(th) + "H " : ""
string mStr = tm ? str.tostring(tm) + "min" : ""
yStr + moStr + dStr + hStr + mStr
if ShowPanel
ftable(InfoPanel, 0, 0, 'Equity: ' , color.new(color.white, 50))
ftable(InfoPanel, 0, 1, 'Position: ' , color.new(color.white, 50))
ftable(InfoPanel, 0, 2, 'Cash: ' , color.new(color.white, 50))
ftable(InfoPanel, 0, 3, 'Margin: ' , color.new(color.white, 50))
ftable(InfoPanel, 0, 4, 'Current Leverage: ' , color.new(color.white, 50))
ftable(InfoPanel, 0, 5, 'Commission Paid: ' , color.new(color.white, 50))
ftable(InfoPanel, 0, 6, 'Floating: ' , color.new(color.white, 50))
ftable(InfoPanel, 0, 7, 'Realized PnL: ' , color.new(color.white, 50))
ftable(InfoPanel, 0, 8, 'Unrealized PnL: ' , color.new(color.white, 50))
ftable(InfoPanel, 0, 9, 'Buy n Hold: ' , color.new(color.white, 50))
ftable(InfoPanel, 0, 10, 'Profit Factor: ' , color.new(color.white, 50))
ftable(InfoPanel, 0, 11, 'Time of Trading: ' , color.new(color.white, 50))
ftable(InfoPanel, 1, 0, Liquidation ? 'Liquidation' : str.tostring(Equity, '#.####') + ' ' + syminfo.currency , Liquidation ? color.red : color.green)
ftable(InfoPanel, 1, 1, str.tostring(PositionSize, '#.####') + ' ' + syminfo.basecurrency , color.green)
ftable(InfoPanel, 1, 2, str.tostring(Cash, '#.####') + ' ' + syminfo.currency , color.green)
ftable(InfoPanel, 1, 3, str.tostring(Margin, '#.####') + ' ' + syminfo.currency , color.green)
ftable(InfoPanel, 1, 4, TradingType == 'Spot' ? 'Spot' : str.tostring(CLeverage, '#.##') + 'x' , color.green)
ftable(InfoPanel, 1, 5, str.tostring(Commission, '#.####') + ' ' + syminfo.currency , Commission == 0 ? color.green : color.red)
ftable(InfoPanel, 1, 6, str.tostring(PFloating, '#.##') + ' %' , PFloating >= 0 ? color.green : color.red)
ftable(InfoPanel, 1, 7, str.tostring(PRealizedPnL, '#.##') + ' %' , PRealizedPnL >= 0 ? color.green : color.red)
ftable(InfoPanel, 1, 8, str.tostring(PURealizedPnL, '#.##') + ' %' , PURealizedPnL >= 0 ? color.green : color.red)
ftable(InfoPanel, 1, 9, str.tostring(PBuyAndHold, '#.##') + ' %' , PBuyAndHold >= 0 ? color.green : color.red)
ftable(InfoPanel, 1, 10, str.tostring(ProfitFactor, '#.##') , ProfitFactor >= 1 ? color.green : color.red)
ftable(InfoPanel, 1, 11, tfString(TradingTime) , color.new(color.white, 50))
// Plotting pivot points
plot(PP, title = "PP", style = plot.style_stepline, color = color.silver, linewidth = 1)
// Plotting the average price
plotshape(barstate.isrealtime and ta.change(AvgPrice) != 0 ? AvgPrice : na, "AvgPricepr", shape.diamond, location.absolute, color.new(color.yellow, 10), size = size.tiny)
plotshape( ta.change(AvgPrice[1]) != 0 ? AvgPrice[1] : na, "AvgPricep", shape.diamond, location.absolute, color.new(color.yellow, 40), size = size.tiny)
plotshape(TimeFirstClose == time ? FirstClose : na, "FirstClose", shape.diamond, location.absolute, color.new(color.yellow, 40), size = size.tiny)
// Plotting the moving average
plot((BuyType == "Cash / n Buys" or BuyType == "Cash / n Buys +") and NBuysUp != NBuysDown ? sMA : na, title = "Moving Average Buys", color = color.new(color.blue, 50), linewidth = 2)
plot((SellType == "Position / n Sells" or SellType == "Position / n Sells +") and NSellsUp != NSellsDown ? sMA : na, title = "Moving Average Sells", color = color.new(color.red, 50), linewidth = 2)
// Plotting the liquidation price
plot(ShowLiquidationPrice and LiquidationPrice > 0 ? LiquidationPrice : na, "Liquidation Price", Liquidation ? color.new(color.red, 30) : color.new(color.lime, 30), 2)
barcolor(Liquidation ? color.red : na)
//⚠️ IMPORTANT NOTICE: LIVE ALGORITHMIC TRADING RISKS
//? Engaging in live algorithmic trading poses several inherent risks that you should be aware of:
//? Backtesting Limitations: Historical performance (backtesting) may not accurately predict future results. Past success does not guarantee future profits.
//? Market Unpredictability: The market is dynamic and may fail or exhibit unexpected behavior, impacting your trading strategies.
//? Broker Infrastructure Issues: Your broker's infrastructure may experience failures, execution delays, or reject your orders, affecting real-time trading.
//? System Failures: The systems used for order generation, communication with your broker, and result reception might fail, disrupting the trading process.
//⏳ Time Lag Challenges: Time lags during live trading can lead to unexpected behavior and outcomes, requiring careful consideration.
//? Third-Party System Risks: Systems of third parties, including service providers, brokers, and securities markets, may fail or malfunction, impacting overall functionality.
//? It's crucial to acknowledge and understand these risks before embarking on live algorithmic trading. Stay informed, be cautious, and adapt your strategies accordingly.
// Happy and safe trading! ??
Detail
https://www.fmz.com/strategy/442202
Last Modified
2024-02-20 10:47:48