Name
动能加权移动平均线双均线交叉策略Dynamic-Momentum-Weighted-Moving-Average-Crossover-Strategy
Author
ChaoZhang
Strategy Description
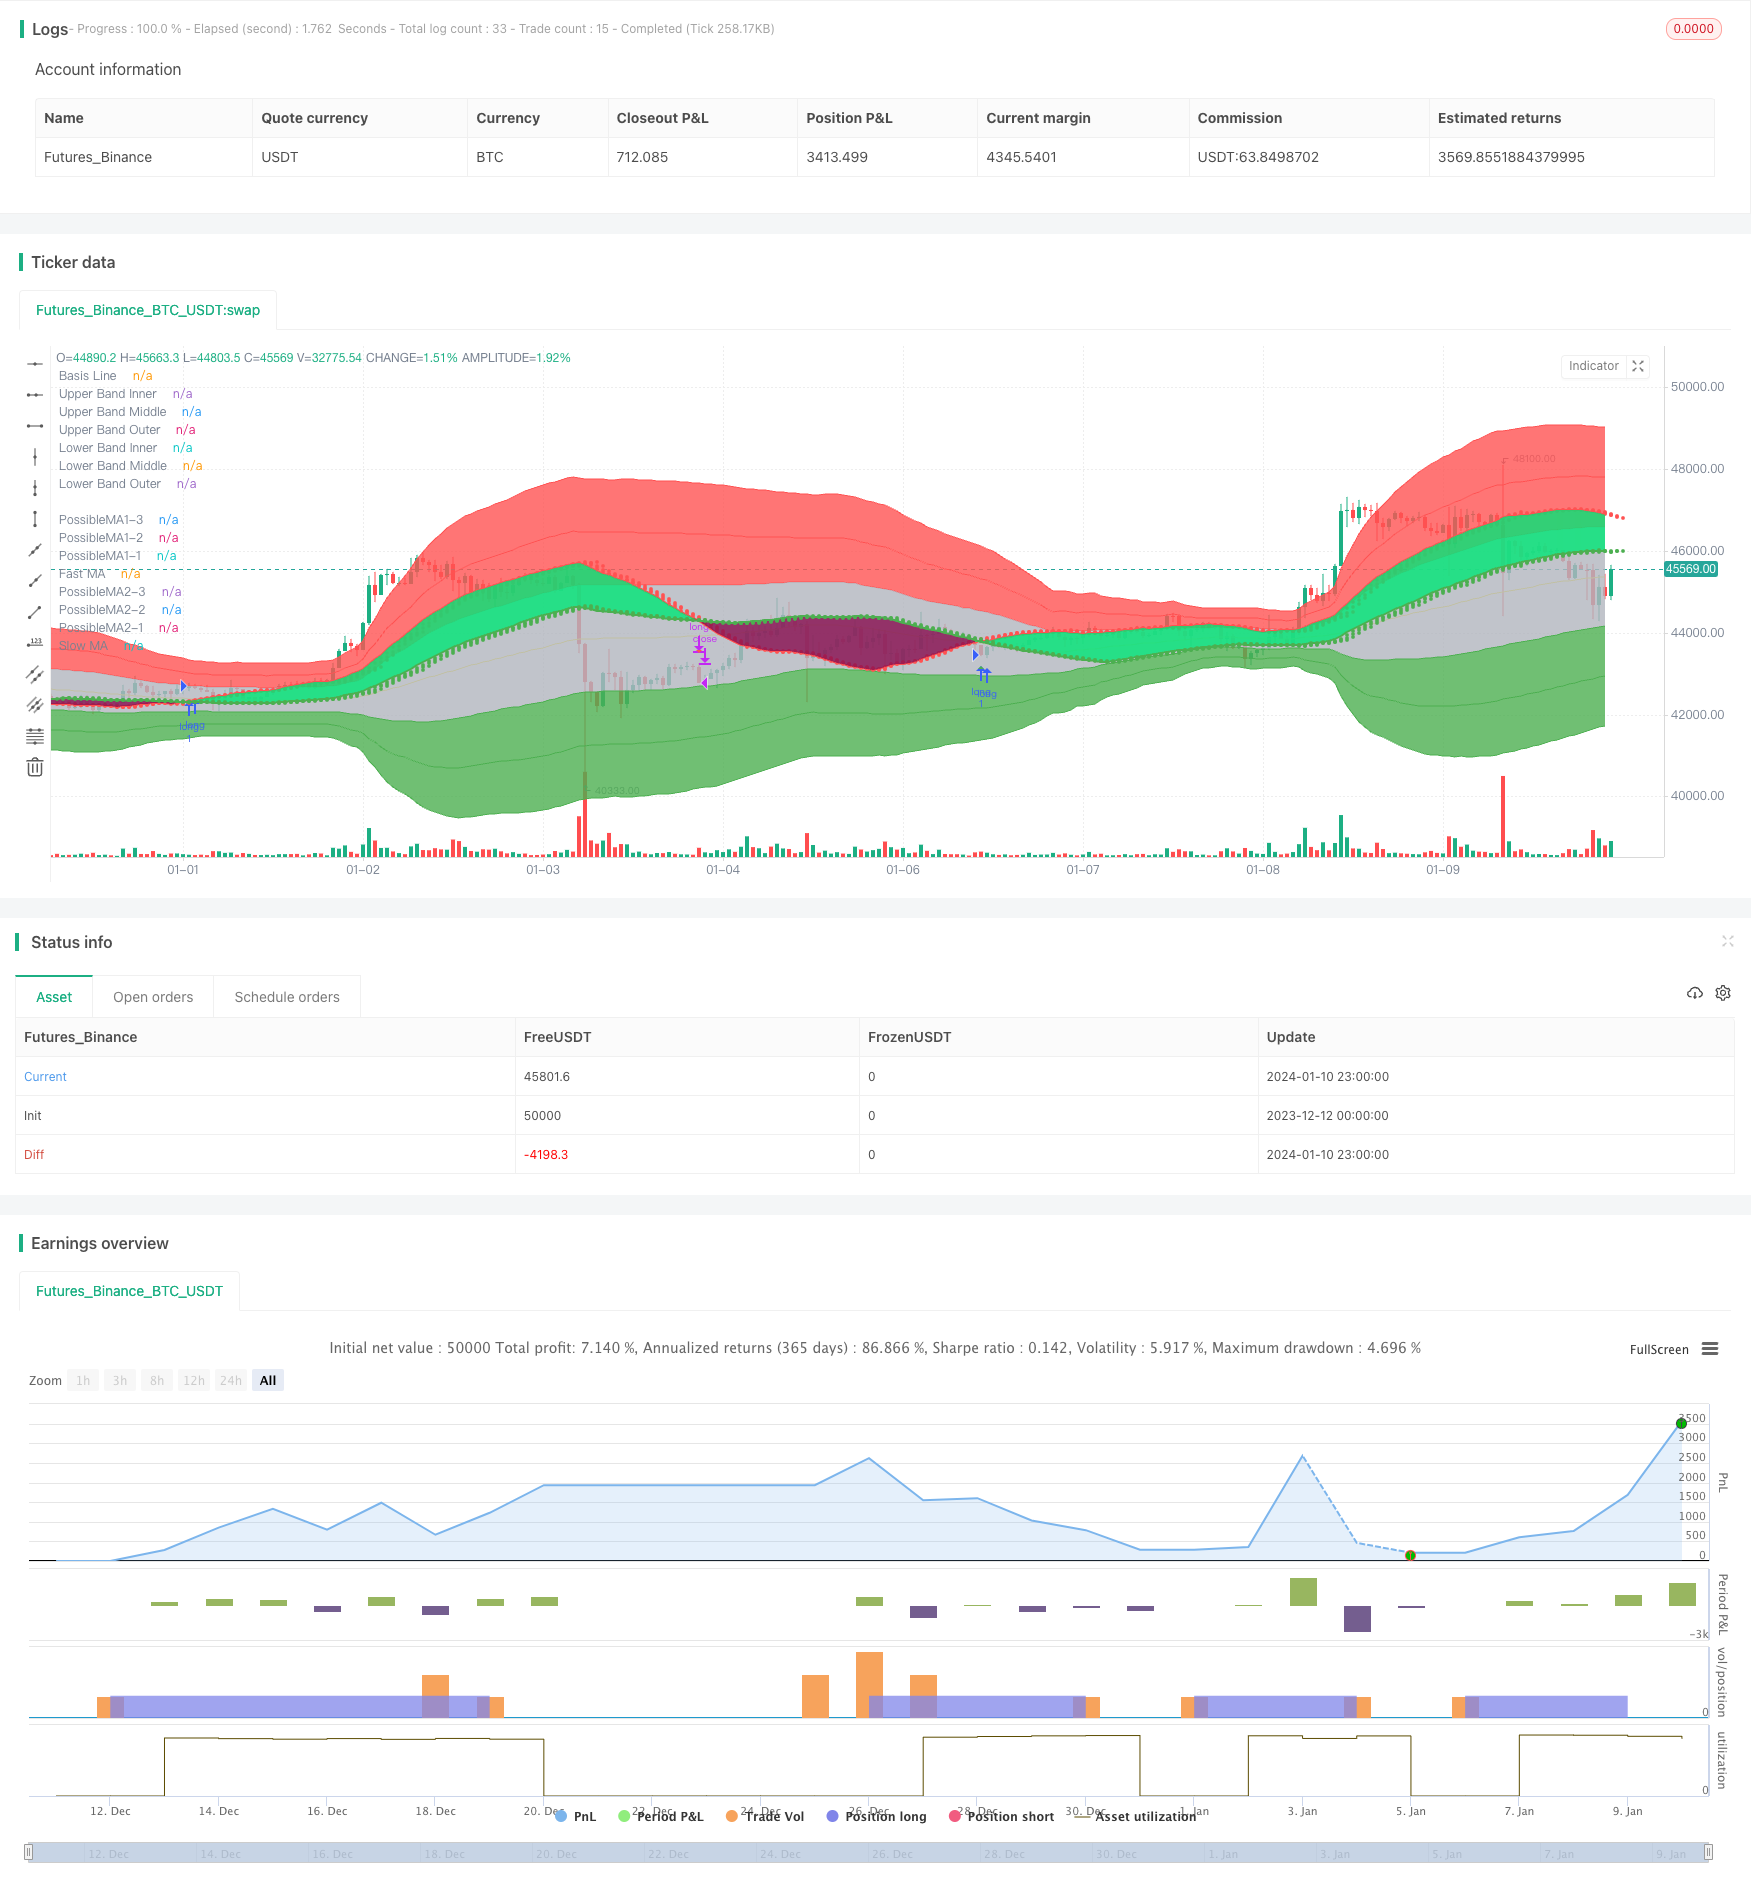
该策略通过计算两个不同周期的动能加权移动平均线(MAEMA),在它们交叉时产生买入和卖出信号。其中,短周期线用于判断市场趋势和短期反转信号,而长周期线用于确定主要趋势方向。
- 计算快线(80周期)和慢线(144周期)的MAEMA。
- 快线反映短期趋势和反转点。慢线反映主要趋势方向。
- 当快线上穿慢线时,产生买入信号。当快线下穿慢线时,产生卖出信号。
- 该策略同时绘制了3个预测点,表示下一个周期的可能值,从而判断未来的交叉趋势。
- 策略中充分利用MAEMA指标本身的动量性和预测功能。
- MAEMA本身集成了动量因子,能更快捕捉趋势的变化。
- 双均线策略,判断不同时间段内的趋势方向。
- 结合快慢线的交叉以及MAEMA自身的预测点,使买卖信号更可靠。
- 自动绘图完整,直观反映市场波动。
- 市场出现异常波动时,MAEMA指标的灵敏度可能过高,产生错误信号。可以适当放宽停损点。
- 均线系统对于横盘市容易产生虚假信号。可以增加其他过滤器。
- 快线和慢线的周期设置需要根据不同品种确定最佳参数。
- 优化MAEMA快线和慢线的周期参数,找到最佳参数组合。
- 增加过滤条件,避免在震荡行情中打开仓位。例如引入DMI、MACD等判断趋势性。
- 根据回测结果不断调整ATR系数、移动止损点来降低False positive并控制风险。
该策略利用动能加权移动平均线双均线交叉判断市场趋势变化,基本原理清晰简单。结合MAEMA自身的动量和预测功能,识别反转信号的效果较好。需要注意参数优化以及加强过滤条件,加强稳定性。
||
This strategy generates buy and sell signals when two Moving Average of Exponential Moving Averages (MAEMA) with different periods cross over. The short period line is used to determine market trend and short term reversal signals, while the long period line is used to determine the major trend direction.
- Calculate the fast MAEMA (80 periods) and slow MAEMA (144 periods).
- The fast line reflects short term trend and reversal points. The slow line reflects major trend direction.
- When the fast line crosses above the slow line, a buy signal is generated. When the fast line crosses below the slow line, a sell signal is generated.
- The strategy also plots 3 predicted points, representing possible values for next period, to determine future crossover trend.
- The strategy makes full use of the momentum and predictive functionality of the MAEMA itself.
- MAEMA itself incorporates momentum factor to capture trend changes faster.
- Dual moving average strategy judges trends over different timeframes.
- Combining fast and slow line crossovers and the predictive points of MAEMA itself makes trading signals more reliable.
- Complete auto-charting provides intuitive reflection of market fluctuations.
- When abnormal volatility occurs, sensitivity of MAEMA may be too high, generating false signals. Stop loss points can be loosened appropriately.
- Moving average systems tend to give false signals during range-bound markets. Additional filters can be added.
- The periods for fast and slow lines should be determined by finding optimal parameters for each product.
- Optimize periods of fast and slow MAEMA to find best parameter combinations.
- Add filter conditions to avoid opening positions during zigzag markets. For example introducing DMI, MACD to determine trendiness.
- Keep adjusting ATR multiples, trailing stops based on backtest results to reduce false positives and control risks.
The strategy judges changes in market trend using MAEMA dual moving average crossovers. The basic principles are simple and clear. Combined with the momentum and predictive capabilities of MAEMA itself, it is effective in identifying reversal signals. Attention should be paid to parameter optimization and enhancing filters to improve robustness.
[/trans]
Strategy Arguments
| Argument | Default | Description |
|---|---|---|
| v_input_1 | true | Show MA Prediction Tails |
| v_input_2 | true | Fill Between MAs Based on Trend |
| v_input_3 | true | Show Cross Direction Signals |
| v_input_4 | true | [ Show Fast Moving Average ]══════════ |
| v_input_5 | 0 | Fast MA Type: MAEMA (Momentum Adjusted Exponential) |
| v_input_6_high | 0 | Fast MA Source: high |
| v_input_7 | 80 | Fast MA Length |
| v_input_8 | false | Fast MA Shift |
| v_input_9 | 2 | Fast MA Thickness |
| v_input_10 | false | Color Fast MA Based on Detected Trend |
| v_input_11 | false | Show Fast MA Range Band |
| v_input_12 | 20 | Fast Band ATR Lookback Period |
| v_input_13 | 3 | Fast Band ATR Multiplier |
| v_input_14 | true | [ Show Slow Moving Average ]══════════ |
| v_input_15 | 0 | Slow MA Type: MAEMA (Momentum Adjusted Exponential) |
| v_input_16_close | 0 | Slow MA Source: close |
| v_input_17 | 144 | Slow MA Length |
| v_input_18 | false | Slow MA Shift |
| v_input_19 | 2 | Slow MA Thickness |
| v_input_20 | false | Color Slow MA Based on Detected Trend |
| v_input_21 | false | Show Slow MA Range Band |
| v_input_22 | 20 | Slow Band ATR Lookback Period |
| v_input_23 | 3 | Slow Band ATR Multiplier |
| v_input_24 | false | Use EMA Basis? |
| v_input_25 | 80 | Bollinger Length |
| v_input_26_close | 0 | Bollinger Source: close |
| v_input_27 | true | Base Multiplier |
| v_input_28 | true | Multiplier Increment |
| v_input_29 | 3 | Breakout Multiplier |
| v_input_30_high | 0 | High Break Source: high |
| v_input_31_low | 0 | Low Break Source: low |
Source (PineScript)
/*backtest
start: 2023-12-12 00:00:00
end: 2024-01-11 00:00:00
period: 1h
basePeriod: 15m
exchanges: [{"eid":"Futures_Binance","currency":"BTC_USDT"}]
*/

// © informanerd
//@version=4

strategy("MultiType Shifting Predictive MAs Crossover", shorttitle = "MTSPMAC + MBHB Strategy", overlay = true)

//inputs

predict = input(true, "Show MA Prediction Tails")
trendFill = input(true, "Fill Between MAs Based on Trend")
signal = input(true, "Show Cross Direction Signals")

showMA1 = input(true, "[ Show Fast Moving Average ]══════════")
type1 = input("MAEMA (Momentum Adjusted Exponential)", "Fast MA Type", options = ["MAEMA (Momentum Adjusted Exponential)", "DEMA (Double Exponential)", "EMA (Exponential)", "HMA (Hull)", "LSMA (Least Squares)", "RMA (Adjusted Exponential)", "SMA (Simple)", "SWMA (Symmetrically Weighted)", "TEMA (Triple Exponential)", "TMA (Triangular)", "VMA / VIDYA (Variable Index Dynamic Average)", "VWMA (Volume Weighted)", "WMA (Weighted)"])
src1 = input(high, "Fast MA Source")
len1 = input(80, "Fast MA Length", minval = 2)
shift1 = input(0, "Fast MA Shift")
maThickness1 = input(2, "Fast MA Thickness", minval = 1)
trendColor1 = input(false, "Color Fast MA Based on Detected Trend")
showBand1 = input(false, "Show Fast MA Range Band")
atrPer1 = input(20, "Fast Band ATR Lookback Period")
atrMult1 = input(3, "Fast Band ATR Multiplier")

showMA2 = input(true, "[ Show Slow Moving Average ]══════════")
type2 = input("MAEMA (Momentum Adjusted Exponential)", "Slow MA Type", options = ["MAEMA (Momentum Adjusted Exponential)", "DEMA (Double Exponential)", "EMA (Exponential)", "HMA (Hull)", "LSMA (Least Squares)", "RMA (Adjusted Exponential)", "SMA (Simple)", "SWMA (Symmetrically Weighted)", "TEMA (Triple Exponential)", "TMA (Triangular)", "VMA / VIDYA (Variable Index Dynamic Average)", "VWMA (Volume Weighted)", "WMA (Weighted)"])
src2 = input(close, "Slow MA Source")
len2 = input(144, "Slow MA Length", minval = 2)
shift2 = input(0, "Slow MA Shift")
maThickness2 = input(2, "Slow MA Thickness", minval = 1)
trendColor2 = input(false, "Color Slow MA Based on Detected Trend")
showBand2 = input(false, "Show Slow MA Range Band")
atrPer2 = input(20, "Slow Band ATR Lookback Period")
atrMult2 = input(3, "Slow Band ATR Multiplier")

//ma calculations

ma(type, src, len) =>
    if type == "MAEMA (Momentum Adjusted Exponential)"
        goldenRatio = (1 + sqrt(5)) / 2
        momentumLen = round(len / goldenRatio), momentum = change(src, momentumLen), probabilityLen = len / goldenRatio / goldenRatio
        ema(src + (momentum + change(momentum, momentumLen) * 0.5) * sum(change(src) > 0 ? 1 : 0, round(probabilityLen)) / probabilityLen, len)
    else if type == "DEMA (Double Exponential)"
        2 * ema(src, len) - ema(ema(src, len), len)
    else if type == "EMA (Exponential)"
        ema(src, len)
    else if type == "HMA (Hull)"
        wma(2 * wma(src, len / 2) - wma(src, len), round(sqrt(len)))
    else if type == "LSMA (Least Squares)"
        3 * wma(src, len) - 2 * sma(src, len)
    else if type == "RMA (Adjusted Exponential)"
        rma(src, len)
    else if type == "SMA (Simple)"
        sma(src, len)
    else if type == "SWMA (Symmetrically Weighted)"
        swma(src)
    else if type == "TEMA (Triple Exponential)"
        3 * ema(src, len) - 3 * ema(ema(src, len), len) + ema(ema(ema(src, len), len), len)
    else if type == "TMA (Triangular)"
        swma(wma(src, len))
    else if type == "VMA / VIDYA (Variable Index Dynamic Average)"
        smoothing = 2 / len, volIndex = abs(cmo(src, len) / 100)
        vma = 0., vma := (smoothing * volIndex * src) + (1 - smoothing * volIndex) * nz(vma[1])
    else if type == "VWMA (Volume Weighted)"
        vwma(src, len)
    else if type == "WMA (Weighted)"
        wma(src, len)

ma1 = ma(type1, src1, len1)
ma2 = ma(type2, src2, len2)

//ma predictions

pma11 = len1 > 2 ? (ma(type1, src1, len1 - 1) * (len1 - 1) + src1 * 1) / len1 : na
pma12 = len1 > 3 ? (ma(type1, src1, len1 - 2) * (len1 - 2) + src1 * 2) / len1 : na
pma13 = len1 > 4 ? (ma(type1, src1, len1 - 3) * (len1 - 3) + src1 * 3) / len1 : na

pma21 = len2 > 2 ? (ma(type2, src2, len2 - 1) * (len2 - 1) + src2 * 1) / len2 : na
pma22 = len2 > 3 ? (ma(type2, src2, len2 - 2) * (len2 - 2) + src2 * 2) / len2 : na
pma23 = len2 > 4 ? (ma(type2, src2, len2 - 3) * (len2 - 3) + src2 * 3) / len2 : na

//ma range bands

r1 = atr(atrPer1) * atrMult1
hBand1 = ma1 + r1
lBand1 = ma1 - r1

r2 = atr(atrPer2) * atrMult2
hBand2 = ma2 + r2
lBand2 = ma2 - r2

//drawings

ma1Plot = plot(showMA1 ? ma1 : na, "Fast MA", trendColor1 and ma1 > src1 ? color.maroon : trendColor1 and ma1 < src1 ? color.lime : trendColor1 ? color.gray : color.red, maThickness1, offset = shift1)
ma2Plot = plot(showMA2 ? ma2 : na, "Slow MA", trendColor2 and ma2 > src2 ? color.maroon : trendColor2 and ma2 < src2 ? color.lime : trendColor2 ? color.gray : color.green, maThickness2, offset = shift2)
fill(ma1Plot, ma2Plot, trendFill and ma1 > ma2 ? color.lime : trendFill and ma1 < ma2 ? color.maroon : na, 90)

plot(showMA1 and predict ? pma11 : na, "PossibleMA1-1", trendColor1 and ma1 > src1 ? color.maroon : trendColor1 and ma1 < src1 ? color.lime : trendColor1 ? color.gray : color.red, style = plot.style_circles, offset = shift1 + 1, show_last = 1)
plot(showMA1 and predict ? pma12 : na, "PossibleMA1-2", trendColor1 and ma1 > src1 ? color.maroon : trendColor1 and ma1 < src1 ? color.lime : trendColor1 ? color.gray : color.red, style = plot.style_circles, offset = shift1 + 2, show_last = 1)
plot(showMA1 and predict ? pma13 : na, "PossibleMA1-3", trendColor1 and ma1 > src1 ? color.maroon : trendColor1 and ma1 < src1 ? color.lime : trendColor1 ? color.gray : color.red, style = plot.style_circles, offset = shift1 + 3, show_last = 1)
plot(showMA2 and predict ? pma21 : na, "PossibleMA2-1", trendColor2 and ma2 > src2 ? color.maroon : trendColor2 and ma2 < src2 ? color.lime : trendColor2 ? color.gray : color.green, style = plot.style_circles, offset = shift2 + 1, show_last = 1)
plot(showMA2 and predict ? pma22 : na, "PossibleMA2-2", trendColor2 and ma2 > src2 ? color.maroon : trendColor2 and ma2 < src2 ? color.lime : trendColor2 ? color.gray : color.green, style = plot.style_circles, offset = shift2 + 2, show_last = 1)
plot(showMA2 and predict ? pma23 : na, "PossibleMA2-3", trendColor2 and ma2 > src2 ? color.maroon : trendColor2 and ma2 < src2 ? color.lime : trendColor2 ? color.gray : color.green, style = plot.style_circles, offset = shift2 + 3, show_last = 1)

plot(showBand1 ? hBand1 : na, "Fast Higher Band", trendColor1 and ma1 > src1 ? color.maroon : trendColor1 and ma1 < src1 ? color.lime : trendColor1 ? color.gray : color.red, offset = shift1)
plot(showBand1 ? lBand1 : na, "Fast Lower Band", trendColor1 and ma1 > src1 ? color.maroon : trendColor1 and ma1 < src1 ? color.lime : trendColor1 ? color.gray : color.red, offset = shift1)
plot(showBand2 ? hBand2 : na, "Slow Higher Band", trendColor2 and ma2 > src2 ? color.maroon : trendColor2 and ma2 < src2 ? color.lime : trendColor2 ? color.gray : color.green, offset = shift2)
plot(showBand2 ? lBand2 : na, "Slow Lower Band", trendColor2 and ma2 > src2 ? color.maroon : trendColor2 and ma2 < src2 ? color.lime : trendColor2 ? color.gray : color.green, offset = shift2)

//crosses & alerts

up = crossover(ma1, ma2)
down = crossover(ma2, ma1)

plotshape(signal ? up : na, "Buy", shape.triangleup, location.belowbar, color.green, offset = shift1, size = size.small)
plotshape(signal ? down : na, "Sell", shape.triangledown, location.abovebar, color.red, offset = shift1, size = size.small)

alertcondition(up, "Buy", "Buy")
alertcondition(down, "Sell", "Sell")

// @version=1

// Title: "Multi Bollinger Heat Bands - EMA/Breakout options".
// Author: JayRogers
//
// * Description *
//   Short: It's your Basic Bollinger Bands, but 3 of them, and some pointy things.
//
//   Long:  Three stacked sma based Bollinger Bands designed just to give you a quick visual on the "heat" of movement.
//          Set inner band as you would expect, then set your preferred additional multiplier increments for the outer 2 bands.
//          Option to use EMA as alternative basis, rather than SMA.
//          Breakout indication shapes, which have their own multiplier seperate from the BB's; but still tied to same length/period.

// strategy(shorttitle="[JR]MBHB_EBO", title="[JR] Multi Bollinger Heat Bands - EMA/Breakout options", overlay=true)

// Bollinger Bands Inputs
bb_use_ema = input(false, title="Use EMA Basis?")
bb_length = input(80, minval=1, title="Bollinger Length")
bb_source = input(close, title="Bollinger Source")
bb_mult = input(1.0, title="Base Multiplier", minval=0.001, maxval=50)
bb_mult_inc = input(1, title="Multiplier Increment", minval=0.001, maxval=2)
// Breakout Indicator Inputs
break_mult = input(3, title="Breakout Multiplier", minval=0.001, maxval=50)
breakhigh_source = input(high, title="High Break Source")
breaklow_source = input(low, title="Low Break Source")

bb_basis = bb_use_ema ? ema(bb_source, bb_length) : sma(bb_source, bb_length)

// Deviation
// * I'm sure there's a way I could write some of this cleaner, but meh.
dev = stdev(bb_source, bb_length)
bb_dev_inner = bb_mult * dev
bb_dev_mid = (bb_mult + bb_mult_inc) * dev
bb_dev_outer = (bb_mult + (bb_mult_inc * 2)) * dev
break_dev = break_mult * dev

// Upper bands
inner_high = bb_basis + bb_dev_inner
mid_high = bb_basis + bb_dev_mid
outer_high = bb_basis + bb_dev_outer
// Lower Bands
inner_low = bb_basis - bb_dev_inner
mid_low = bb_basis - bb_dev_mid
outer_low = bb_basis - bb_dev_outer

// Breakout Deviation
break_high = bb_basis + break_dev
break_low = bb_basis - break_dev

// plot basis
plot(bb_basis, title="Basis Line", color=color.yellow, transp=50)

// plot and fill upper bands
ubi = plot(inner_high, title="Upper Band Inner", color=color.red, transp=90)
ubm = plot(mid_high, title="Upper Band Middle", color=color.red, transp=85)
ubo = plot(outer_high, title="Upper Band Outer", color=color.red, transp=80)
fill(ubi, ubm, title="Upper Bands Inner Fill", color=color.red, transp=90)
fill(ubm, ubo, title="Upper Bands Outer Fill",color=color.red, transp=80)

// plot and fill lower bands
lbi = plot(inner_low, title="Lower Band Inner", color=color.green, transp=90)
lbm = plot(mid_low, title="Lower Band Middle", color=color.green, transp=85)
lbo = plot(outer_low, title="Lower Band Outer", color=color.green, transp=80)
fill(lbi, lbm, title="Lower Bands Inner Fill", color=color.green, transp=90)
fill(lbm, lbo, title="Lower Bands Outer Fill", color=color.green, transp=80)

// center channel fill
fill(ubi, lbi, title="Center Channel Fill", color=color.silver, transp=100)

// plot breakouts
plotshape(breakhigh_source >= break_high, title="High Breakout", style=shape.triangledown, location=location.abovebar, size=size.tiny, color=color.white, transp=0)
plotshape(breaklow_source <= break_low, title="Low Breakout", style=shape.triangleup, location=location.belowbar, size=size.tiny, color=color.white, transp=0)
High_Break = breakhigh_source >= break_high
Low_Break = breaklow_source <= break_low

// Conditions
Stop_Momentum = low < ma1

//Strategy Tester

strategy.entry("long", strategy.long, when=(up and (hlc3 < inner_high)))
strategy.close("long", when=down)

strategy.entry("longwickdown", strategy.long, when=Low_Break)
strategy.close("longwickdown", when=(high > ma1))

//true signals test

//var winCount = 0, var loseCount = 0, testBarIndex = 1
//if (up[testBarIndex] and close > close[testBarIndex]) or (down[testBarIndex] and close < close[testBarIndex])
//    label.new(bar_index, 0, "W", yloc = yloc.abovebar, color = color.green)
//    winCount := winCount + 1
//else if (up[testBarIndex] and close < close[testBarIndex]) or (down[testBarIndex] and close > close[testBarIndex])
//    label.new(bar_index, 0, "L", yloc = yloc.abovebar, color = color.red)
//    loseCount := loseCount + 1
//winRate = label.new(time + (time - time[1]) * 2, ohlc4, tostring(round(winCount / (winCount + loseCount) * 100)) + "%", xloc = xloc.bar_time, color = color.orange, style = label.style_label_left)
//if not na(winRate[1])
//    label.delete(winRate[1])
Detail
https://www.fmz.com/strategy/438468
Last Modified
2024-01-12 12:04:55