Name
动量与资金流量叉路兑现策略Momentum-and-Money-Flow-Crossroad-Cashing-Strategy
Author
ChaoZhang
Strategy Description
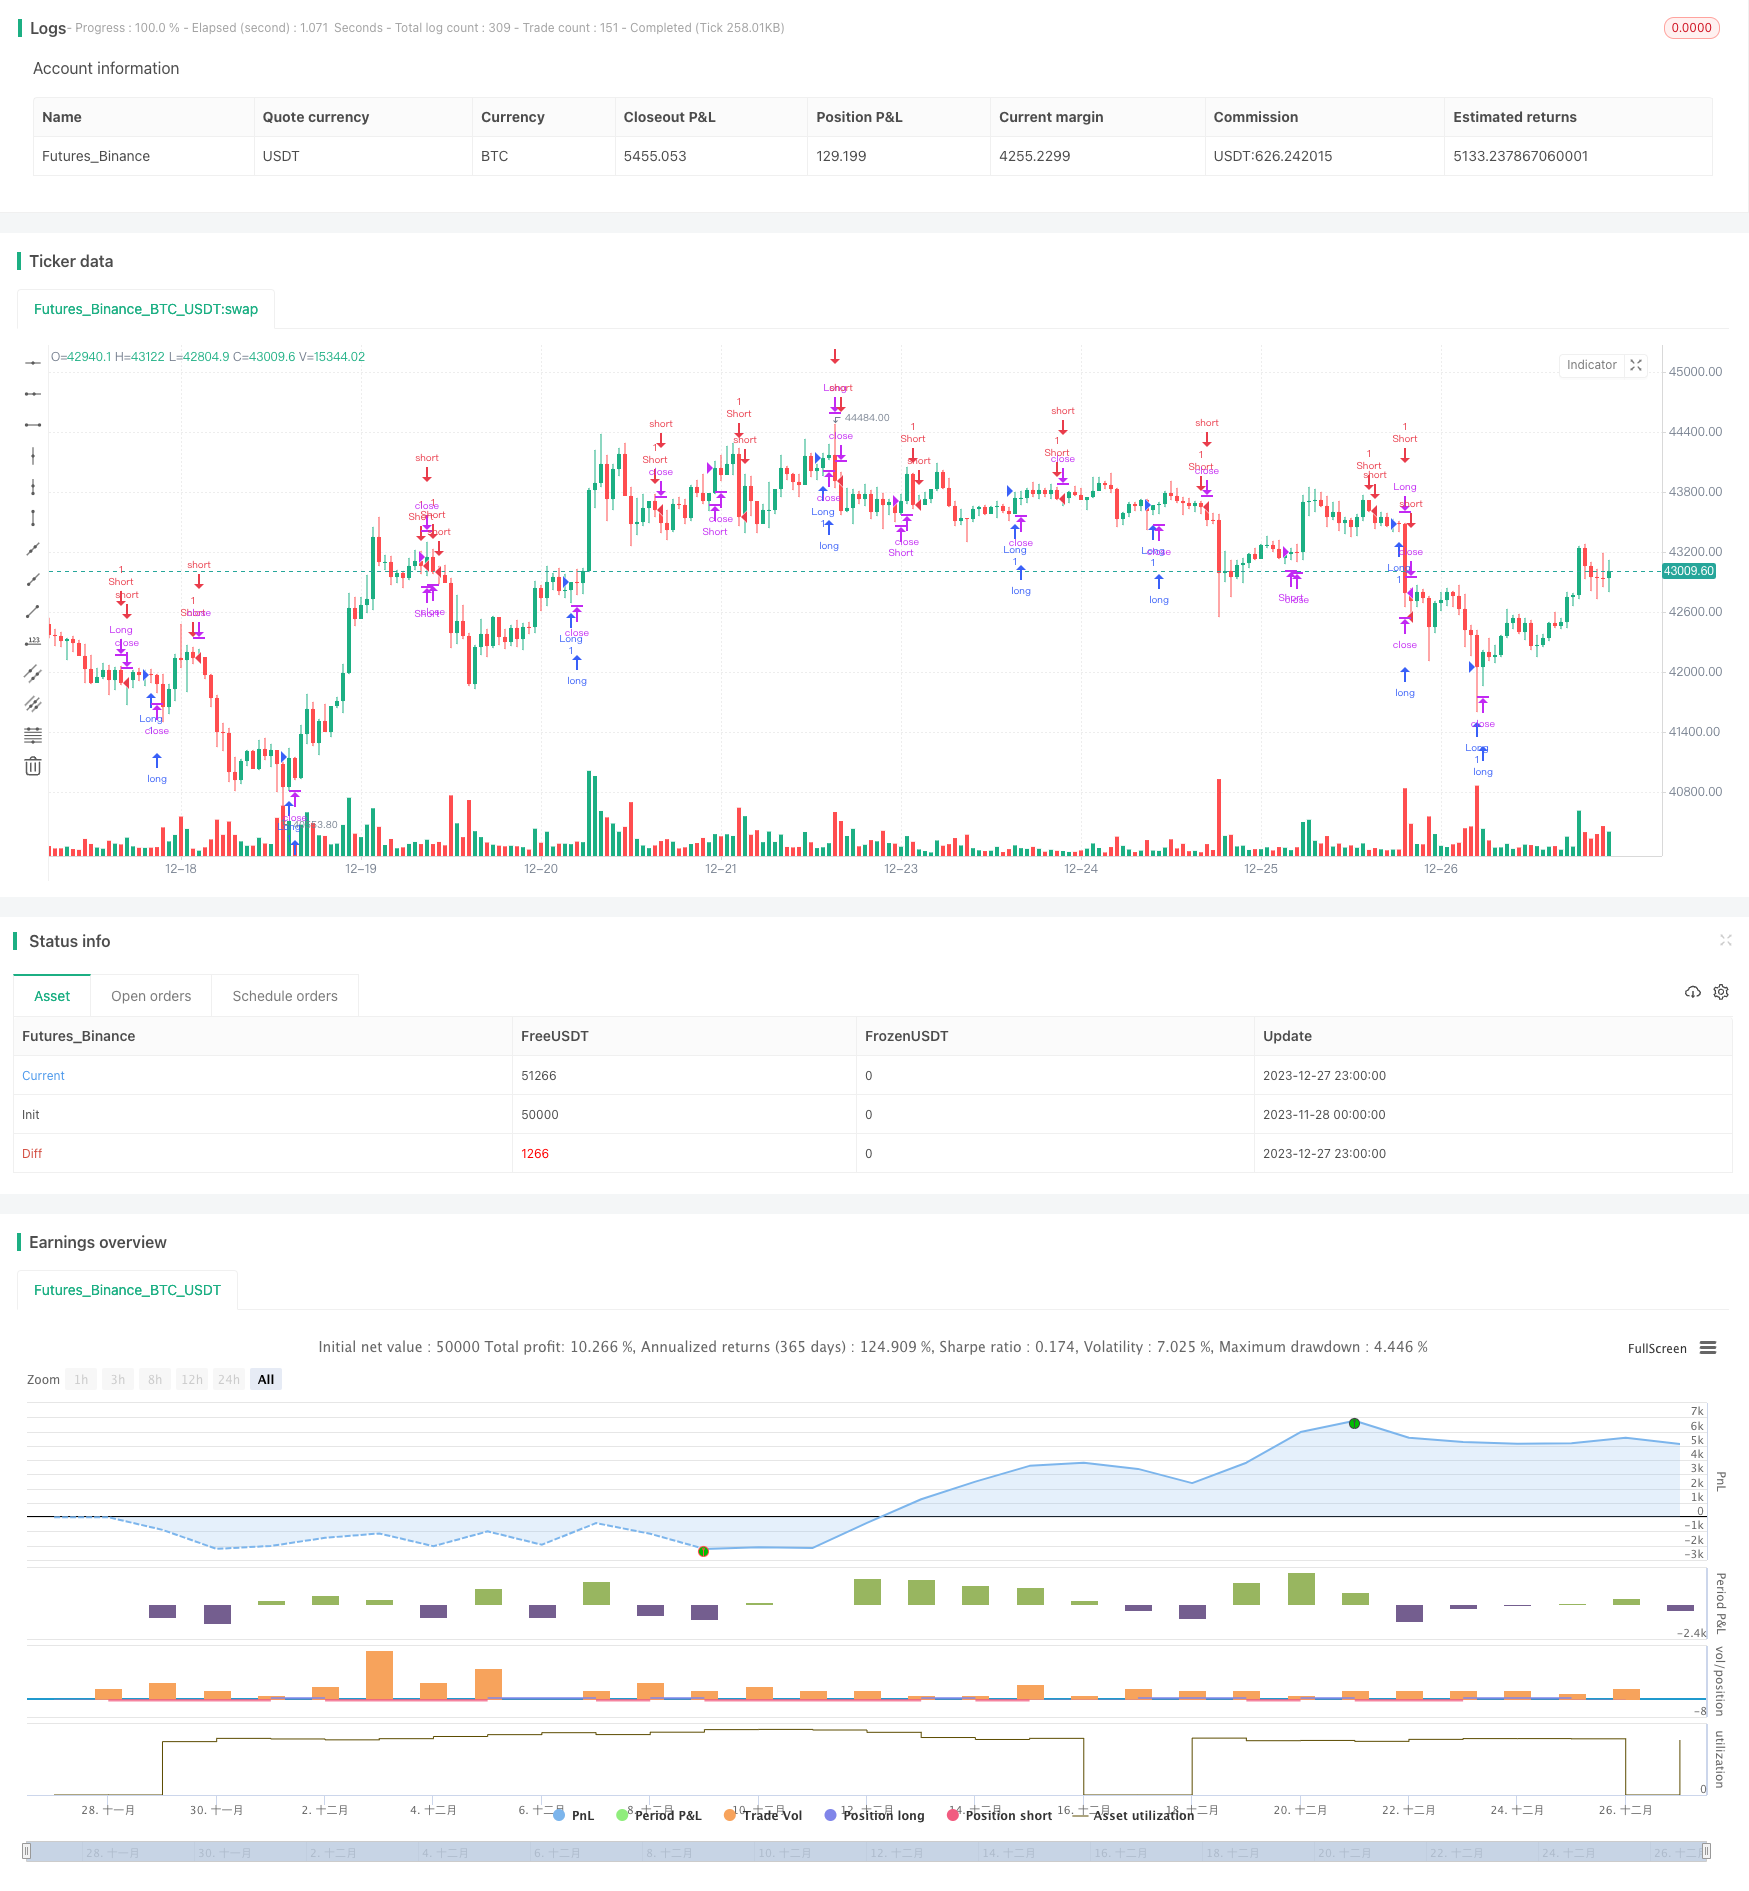
这是一个结合了随机指标和柴克动量指标的反应式交易策略,旨在抓住市场中动量转变的机会进行交易。该策略巧妙地将两个强大的指标-随机振荡器和柴克资金流量指标(CMF)相结合,为明确的入市和离场信号。
随机振荡器是一个动量指标,用于测量收盘价在一定周期内相对于最高价和最低价的位置变化。在这个策略中,通过调整%K长度,%K平滑值和%D平滑值等参数,可以细调随机振荡器对市场波动的敏感度。
另一方面,柴克资金流量指标(CMF)是一个根据成交量加权的平均震荡指标,用于测量在指定时间段内资金流入和流出证券的情况。通过调整Length参数可以改变CMF的计算周期。
具体操作思路如下:
当随机指标的%K线穿过%D线(显现上涨信号)且CMF值大于0.1时(表示正向资金流动),做多仓位。
相反,当随机指标%K线跌穿%D线(显现下跌信号)且CMF值小于0.08时(表示负向资金流动),做空仓位。
使用一系列预设条件来确定仓位离场,以锁定利润和减少损失。当随机指标显现下跌信号且CMF值低于-0.1时平多仓。当随机指标显现上涨信号且CMF值高于0.06时平空仓。
这种策略巧妙地融合了动量分析和成交量分析,从而对市场状况有更全面的判断,有助于做出明智的交易决策。其可定制的输入设置还使其可以更好地适应不同的市场环境和个人交易偏好。
具体来说,这种策略的优势主要有:
-
结合强大的随机振荡器和柴克资金流量指标,可以更准确地判断市场走势和捕捉转折点。
-
灵活的入场离场机制可以在利润最大化的同时控制风险。
-
可自定义的参数设置使策略可以针对不同品种进行优化。
-
内置的止损/止盈机制有助于保护已经实现的利润。
尽管该策略有许多优势,但交易中仍存在一些风险需要注意:
-
错误的指标参数设置可能导致错过机会或造成不必要的损失。必须针对不同市场进行测试优化。
-
突发事件造成的价格剧烈波动可能导致止损被突破或Produce假信号。应设置宽松的止损幅度并验证信号。
-
该策略依赖技术指标,无法应对基本面变化造成的大幅价格波动。应与基本面研究相结合以减少风险。
可以通过以下方法来对冲这些风险:
-
在模拟环境中对参数进行充分的回测和优化。
-
适当放宽止损幅度,添加止盈机制。
-
与其他类型的系统指标相结合使用,避免依赖单一指标。
这种策略仍有很大的优化空间,主要集中在以下几个方面:
-
通过机器学习或遗传算法自动优化指标参数,使其能够动态适应市场。
-
增加模型评估模块,实现对策略效果的实时跟踪和评估。
-
结合更多类型的指标,如波动率指标、成交量指标等,建立更稳健的模型。
-
增加自适应止损/止盈机制。根据市场波动程度,动态调整止损幅度。
-
利用深度学习技术开发能够自动特征工程的 alphα 模型,不依赖指定的指标,实现更高的稳定性。
本策略通过运用随机指标和柴克资金流量指标,设计了一个同时考虑价格动量和资金流的量化交易系统。相比单一指标,这种多指标联合运用的方式能更准确判断市场结构,属于新兴的反应式交易策略。详细的入场离场机制和高度可定制化的指标设置使其既能抓住短期利润又具有一定的风险控制能力。但是这类规则型模型依然面临一定的市场风险,有必要结合更多数据源和技术手段进行优化,使策略能够适应更加复杂和动态的交易环境。
||
This is a reactive trading strategy that combines the Stochastic oscillator and Chaikin Money Flow (CMF) indicator to capitalize on momentum shifts in the market. The strategy ingeniously harmonizes two potent indicators – the Stochastic oscillator and CMF indicator – to provide clear entry and exit signals.
The Stochastic oscillator is a momentum indicator that measures the relative position of the closing price to the high-low range over a defined lookback period. In this strategy, parameters like %K Length, %K Smoothing and %D Smoothing can be customized to fine-tune the sensitivity of the Stochastic oscillator to market fluctuations.
On the other hand, the Chaikin Money Flow (CMF) indicator is a volume-weighted average oscillator designed to measure the flow of money into and out of a security over a specified timeframe. The Length parameter can be adjusted to change the lookback period for CMF calculation.
Here is how the strategy works:
A long position is initiated when the Stochastic %K line crosses above the %D line (a bullish crossover) and the CMF value is greater than 0.1, indicating positive money flow and upward potential momentum.
Conversely, a short position is initiated when the Stochastic %K line crosses below the %D line (a bearish crossover) and the CMF value is less than 0.08, signalling negative money flow and potential downward momentum.
Positions are exited based on a set of predefined conditions to protect profits and minimize losses. Long positions are closed when a bearish crossover occurs on the Stochastic oscillator and the CMF value falls below -0.1. Short positions are closed when a bullish crossover occurs on the Stochastic oscillator and the CMF value rises above 0.06.
This strategy artfully blends momentum and volume analysis to offer traders a comprehensive view of market conditions, thereby facilitating informed trading decisions. Its customizable input settings also allow better adaptations to varying market environments and individual trading preferences.
Specifically, the main advantages of this strategy are:
-
Combining the robust Stochastic oscillator and CMF indicator can more accurately determine market trends and spot inflection points.
-
The flexible entry and exit mechanisms maximize profits while controlling risks.
-
Customizable parameter settings allow optimizations across different products.
-
The built-in stop loss/take profit controls help protect realized profits.
Despite its advantages, some risks in trading still exist with this strategy:
-
Incorrect indicator parameters may lead to missing opportunities or unnecessary losses. Proper testing and optimization across markets is a must.
-
Extreme price swings from black swan events may trigger stop loss or produce false signals. Using loose stop loss and validating signals is necessary.
-
The strategy relies on technical indicators and cannot adapt to fundamental shifts and extreme moves. Combining fundamental analysis is required to reduce risks.
The risks can be mitigated through:
-
Thorough backtesting and optimization of parameters in simulated environments.
-
Setting loose stop loss, adding profit taking mechanisms.
-
Combining with other types of systems for signal confirmation, avoiding reliance on single indicators.
Significant room remains for optimizing this strategy:
-
Using machine learning or genetic algorithms to auto-optimize parameters for dynamic adaptivity.
-
Adding model evaluation modules for real-time tracking and assessment of strategy performance.
-
Incorporating more indicator types like volatility measures, volume signatures to build more robust models.
-
Implementing adaptive stop loss/take profit mechanisms based on market volatility.
-
Leveraging deep learning to develop auto-feature engineering alpha models that do not rely on prescribed indicators, enhancing stability.
This strategy employs the Stochastic oscillator and Chaikin Money Flow indicator to design a quantitative trading system incorporating both price momentum and money flow analysis. This multi-indicator approach provides more accurate assessments of market structure compared to single indicators. Detailed entry/exit rules and highly-customizable settings balance its profit capturing and risk control capabilities. Nonetheless, inherent market risks still exist in such rule-based models. Further optimizations by incorporating more data sources and techniques are necessary for robust adaptations to increasingly complex and dynamic trading landscapes.
[/trans]
Strategy Arguments
| Argument | Default | Description |
|---|---|---|
| v_input_int_1 | 20 | %K Length |
| v_input_int_2 | true | %K Smoothing |
| v_input_int_3 | 3 | %D Smoothing |
| v_input_int_4 | 10 | Length |
Source (PineScript)
/*backtest
start: 2023-11-28 00:00:00
end: 2023-12-28 00:00:00
period: 1h
basePeriod: 15m
exchanges: [{"eid":"Futures_Binance","currency":"BTC_USDT"}]
*/

// This source code is subject to the terms of the Mozilla Public License 2.0 at https://mozilla.org/MPL/2.0/
// © jawauntb

//@version=5
strategy("Stochastic and CMF Strategy", overlay=true)

// Stochastic Indicator
periodK = input.int(20, " %K Length", minval=1)
smoothK = input.int(1, "%K Smoothing", minval=1)
periodD = input.int(3, "%D Smoothing", minval=1)
k = ta.sma(ta.stoch(close, high, low, periodK), smoothK)
d = ta.sma(k, periodD)

// Chaikin Money Flow Indicator
length = input.int(10, "Length", minval=1)
ad = close == high and close == low or high == low ? 0 : ((2 * close - low - high) / (high - low)) * volume

sumAd = 0.0
sumVolume = 0.0
for i = 0 to length - 1
    sumAd := sumAd + ad[i]
    sumVolume := sumVolume + volume[i]

mf = sumAd / sumVolume

// Define conditions for entering a long or short position
enterLong = ta.crossover(k, d) and mf > 0.1
enterShort = ta.crossunder(k, d) and mf < 0.08

// Define conditions for exiting a position
exitLong = ta.crossunder(k, d) and mf < -0.1
exitShort = ta.crossover(k, d) and mf > 0.06

// Execute trades based on the conditions
strategy.entry("Long", strategy.long, when=enterLong)
strategy.close("Long", when=exitLong)
strategy.entry("Short", strategy.short, when=enterShort)
strategy.close("Short", when=exitShort)
Detail
https://www.fmz.com/strategy/437024
Last Modified
2023-12-29 16:12:35