Name
动量反转短线交易策略-Momentum-Reversal-Trading-Strategy
Author
ChaoZhang
Strategy Description
[trans]
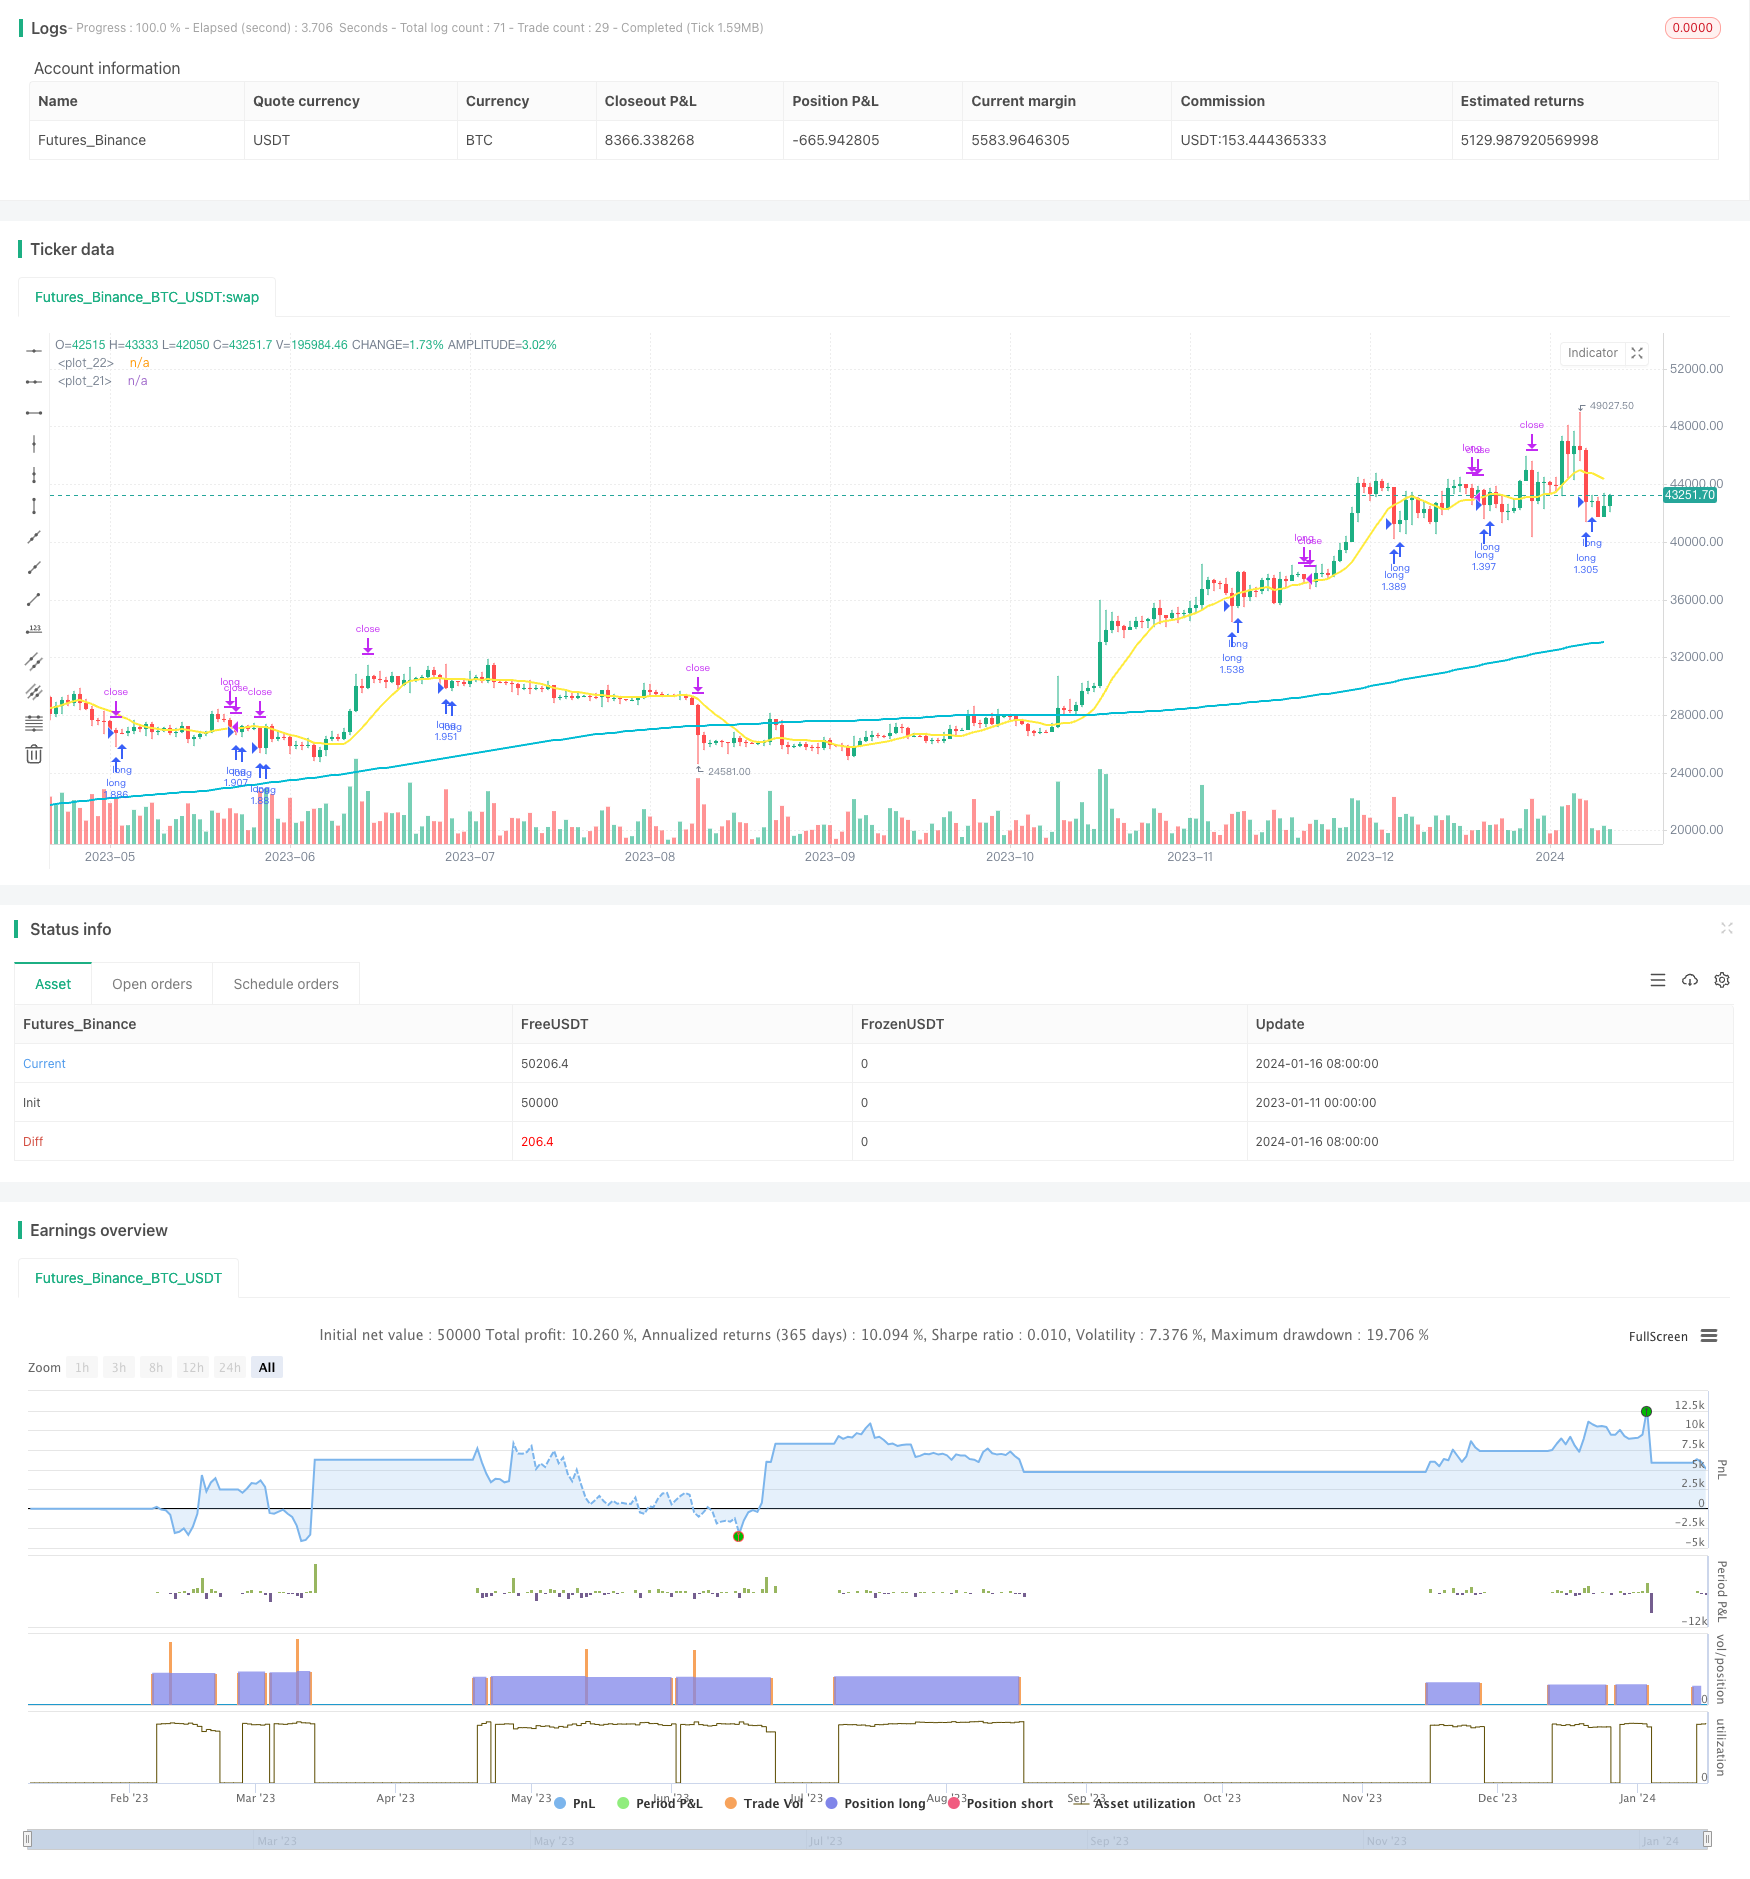
该策略是一个非常简单的短线交易策略,主要适用于股指的日线交易。它只进行多头交易,在股指处于长期上涨通道,短期出现反转信号时建仓做多。
该策略主要基于均线和RSI指标判断趋势和超买超卖现象。具体交易信号为:股指收盘价上抵长期200日均线且高于其之上,作为长期趋势判断;收盘价跌破10日均线构成短期调整信号;RSI3期指标小于30作为超卖信号。满足上述三个条件时,认为短期调整反转的概率较大,因此做多建仓。
建仓后,根据止损、止盈和短期趋势判断来平仓。如收盘价重新站上10日均线,判断短期调整已经结束,此时主动止盈;如收盘价格出现新的低点,止损退出;收盘价格上涨10%时止盈。
该策略具有以下几个优势:
- 逻辑简单,容易理解和实现,适合初学者;
- 充分利用股指的长期上涨趋势,避免逆势交易;
- 利用RSI指标判断短期反转点位,提高获利概率;
- 有止损和止盈机制控制风险;
- 数据需求少,日线数据即可,适合零成本实现。
该策略也存在一些风险:
- 长期持续下跌的熊市会导致亏损;
- 反转失败可能造成较大亏损;
- 参数设置不当也会影响效果,如均线周期设置不当;
- 交易频率可能较低,无法对所有调整都捕捉;
- 收益上限有限,超过市场指数收益不多。
针对上述风险,可以通过优化周期参数、调整止损止盈比例、增加其他指标判断等方法来改进。
该策略主要可以从以下几个方面进行优化:
- 增加对长短期趋势的多因子判断,如MACD,KD等,提高判断准确性;
- 加入交易量的分析。如大量上涨时建仓;
- 优化参数设置。通过Walk Forward Analysis等方法优化最佳参数;
- 结合更多反转因子。如Fibonacci回测线、支撑阻力位等判断反转高度;
- 综合考虑利益比优化。如调整仓位和止盈止损比例,实现更大收益。
该策略总体来说是一个非常简单实用的短线交易策略。它利用股指长期上涨通道和短期调整反转的组合策略,在控制风险的前提下获取超额收益。通过持续优化和把控参数,可以获得更好的效果。
||
This is a very simple short-term trading strategy that is mainly suitable for index futures daily trading. It only goes long when the index is in a long-term uptrend channel and there is a short-term reversal signal.
The strategy mainly uses moving averages and RSI indicators to determine trends and overbought/oversold conditions. The specific trading signals are: the index closing price rebounds from the long-term 200-day moving average and remains above it as the long-term trend judgment; the closing price breaks below the 10-day moving average as the short-term adjustment signal; RSI3 less than 30 as the oversold signal. When the above three conditions are met, it is believed that the probability of a short-term reversal is relatively large, so go long.
After taking a position, exits are based on stop loss, take profit and short-term trend judgments. If the closing price stands back above the 10-day MA, judging that the short-term adjustment has ended, take profit actively; if the closing price hits a new low, stop out with a loss; take profit when the closing price rises 10%.
The strategy has the following advantages:
- Simple logic, easy to understand and implement, suitable for beginners;
- Make full use of the long-term uptrend of the index to avoid trading against the trend;
- Use the RSI indicator to determine the short-term reversal point to increase the profit probability;
- There are stop loss and take profit mechanisms to control risks;
- Low data requirements, daily data is enough, suitable for zero-cost implementation.
The strategy also has some risks:
- Sustained declines in bear markets will lead to losses;
- Failed reversals can cause significant losses;
- Improper parameter settings can also affect results, such as incorrect moving average periods;
- Trading frequency may be low, unable to capture all adjustments;
- Limited profit upside, not much higher than market index returns.
In response to the above risks, methods such as optimizing cycle parameters, adjusting stop-loss ratios, adding other indicator judgments, etc. can be used to improve the strategy.
The strategy can be optimized in the following aspects:
- Increase multifactor judgments of long-term and short-term trends, such as MACD and KD to improve judgment accuracy;
- Add trading volume analysis, such as going long when trading volume surges;
- Optimize parameter settings through Walk Forward Analysis and other methods to find the best parameters;
- Combine more reversal factors,such as Fibonacci retracement levels, support and resistance levels to determine the reversal levels;
- Comprehensively consider profit ratio optimization, such as adjusting positions and stop-loss ratios to achieve higher returns.
In summary, this is a very simple and practical short-term trading strategy. It combines the long-term uptrend and short-term pullback reversal of the index to obtain excess returns while controlling risks. By continuously optimizing and parameter tuning, better results can be achieved.
[/trans]
Strategy Arguments
| Argument | Default | Description |
|---|---|---|
| v_input_int_1 | 200 | (?パラメータ)長期移動平均BASE200/period of long term sma |
| v_input_int_2 | 10 | 長期移動平均BASE10/period of short term sma |
| v_input_int_3 | 5 | 損切の割合%/stoploss percentages |
| v_input_int_4 | 20 | 利食いの割合%/take profit percentages |
| v_input_1 | timestamp(01 Jan 2000 13:30 +0000) | (?期間)バックテストを始める日/start trade day |
| v_input_2 | timestamp(1 Jan 2099 19:30 +0000) | バックテスを終わる日/finish date day |
Source (PineScript)
/*backtest
start: 2023-01-11 00:00:00
end: 2024-01-17 00:00:00
period: 1d
basePeriod: 1h
exchanges: [{"eid":"Futures_Binance","currency":"BTC_USDT"}]
*/

// This source code is subject to the terms of the Mozilla Public License 2.0 at https://mozilla.org/MPL/2.0/
// © tsujimoto0403

//@version=5
strategy("simple pull back", overlay=true,default_qty_type=strategy.percent_of_equity,
     default_qty_value=100)

//input value
malongperiod=input.int(200,"長期移動平均BASE200/period of long term sma",group = "パラメータ")
mashortperiod=input.int(10,"長期移動平均BASE10/period of short term sma",group = "パラメータ")
stoprate=input.int(5,title = "損切の割合%/stoploss percentages",group = "パラメータ")
profit=input.int(20,title = "利食いの割合%/take profit percentages",group = "パラメータ")
startday=input(title="バックテストを始める日/start trade day", defval=timestamp("01 Jan 2000 13:30 +0000"), group="期間")
endday=input(title="バックテスを終わる日/finish date day", defval=timestamp("1 Jan 2099 19:30 +0000"), group="期間")


//polt indicators that we use
malong=ta.sma(close,malongperiod)
mashort=ta.sma(close,mashortperiod)

plot(malong,color=color.aqua,linewidth = 2)
plot(mashort,color=color.yellow,linewidth = 2)

//date range
datefilter = true

//open conditions
if close>malong and close<mashort and strategy.position_size == 0 and datefilter and ta.rsi(close,3)<30
    strategy.entry(id="long", direction=strategy.long)

//sell conditions
strategy.exit(id="cut",from_entry="long",stop=(1-0.01*stoprate)*strategy.position_avg_price,limit=(1+0.01*profit)*strategy.position_avg_price)


if close>mashort and close<low[1] and strategy.position_size>0
    strategy.close(id ="long")
Detail
https://www.fmz.com/strategy/439187
Last Modified
2024-01-18 11:26:40