Name
动量均差指标突破策略Momentum-Mean-Deviation-Breakthrough-Strategy
Author
ChaoZhang
Strategy Description
[trans]
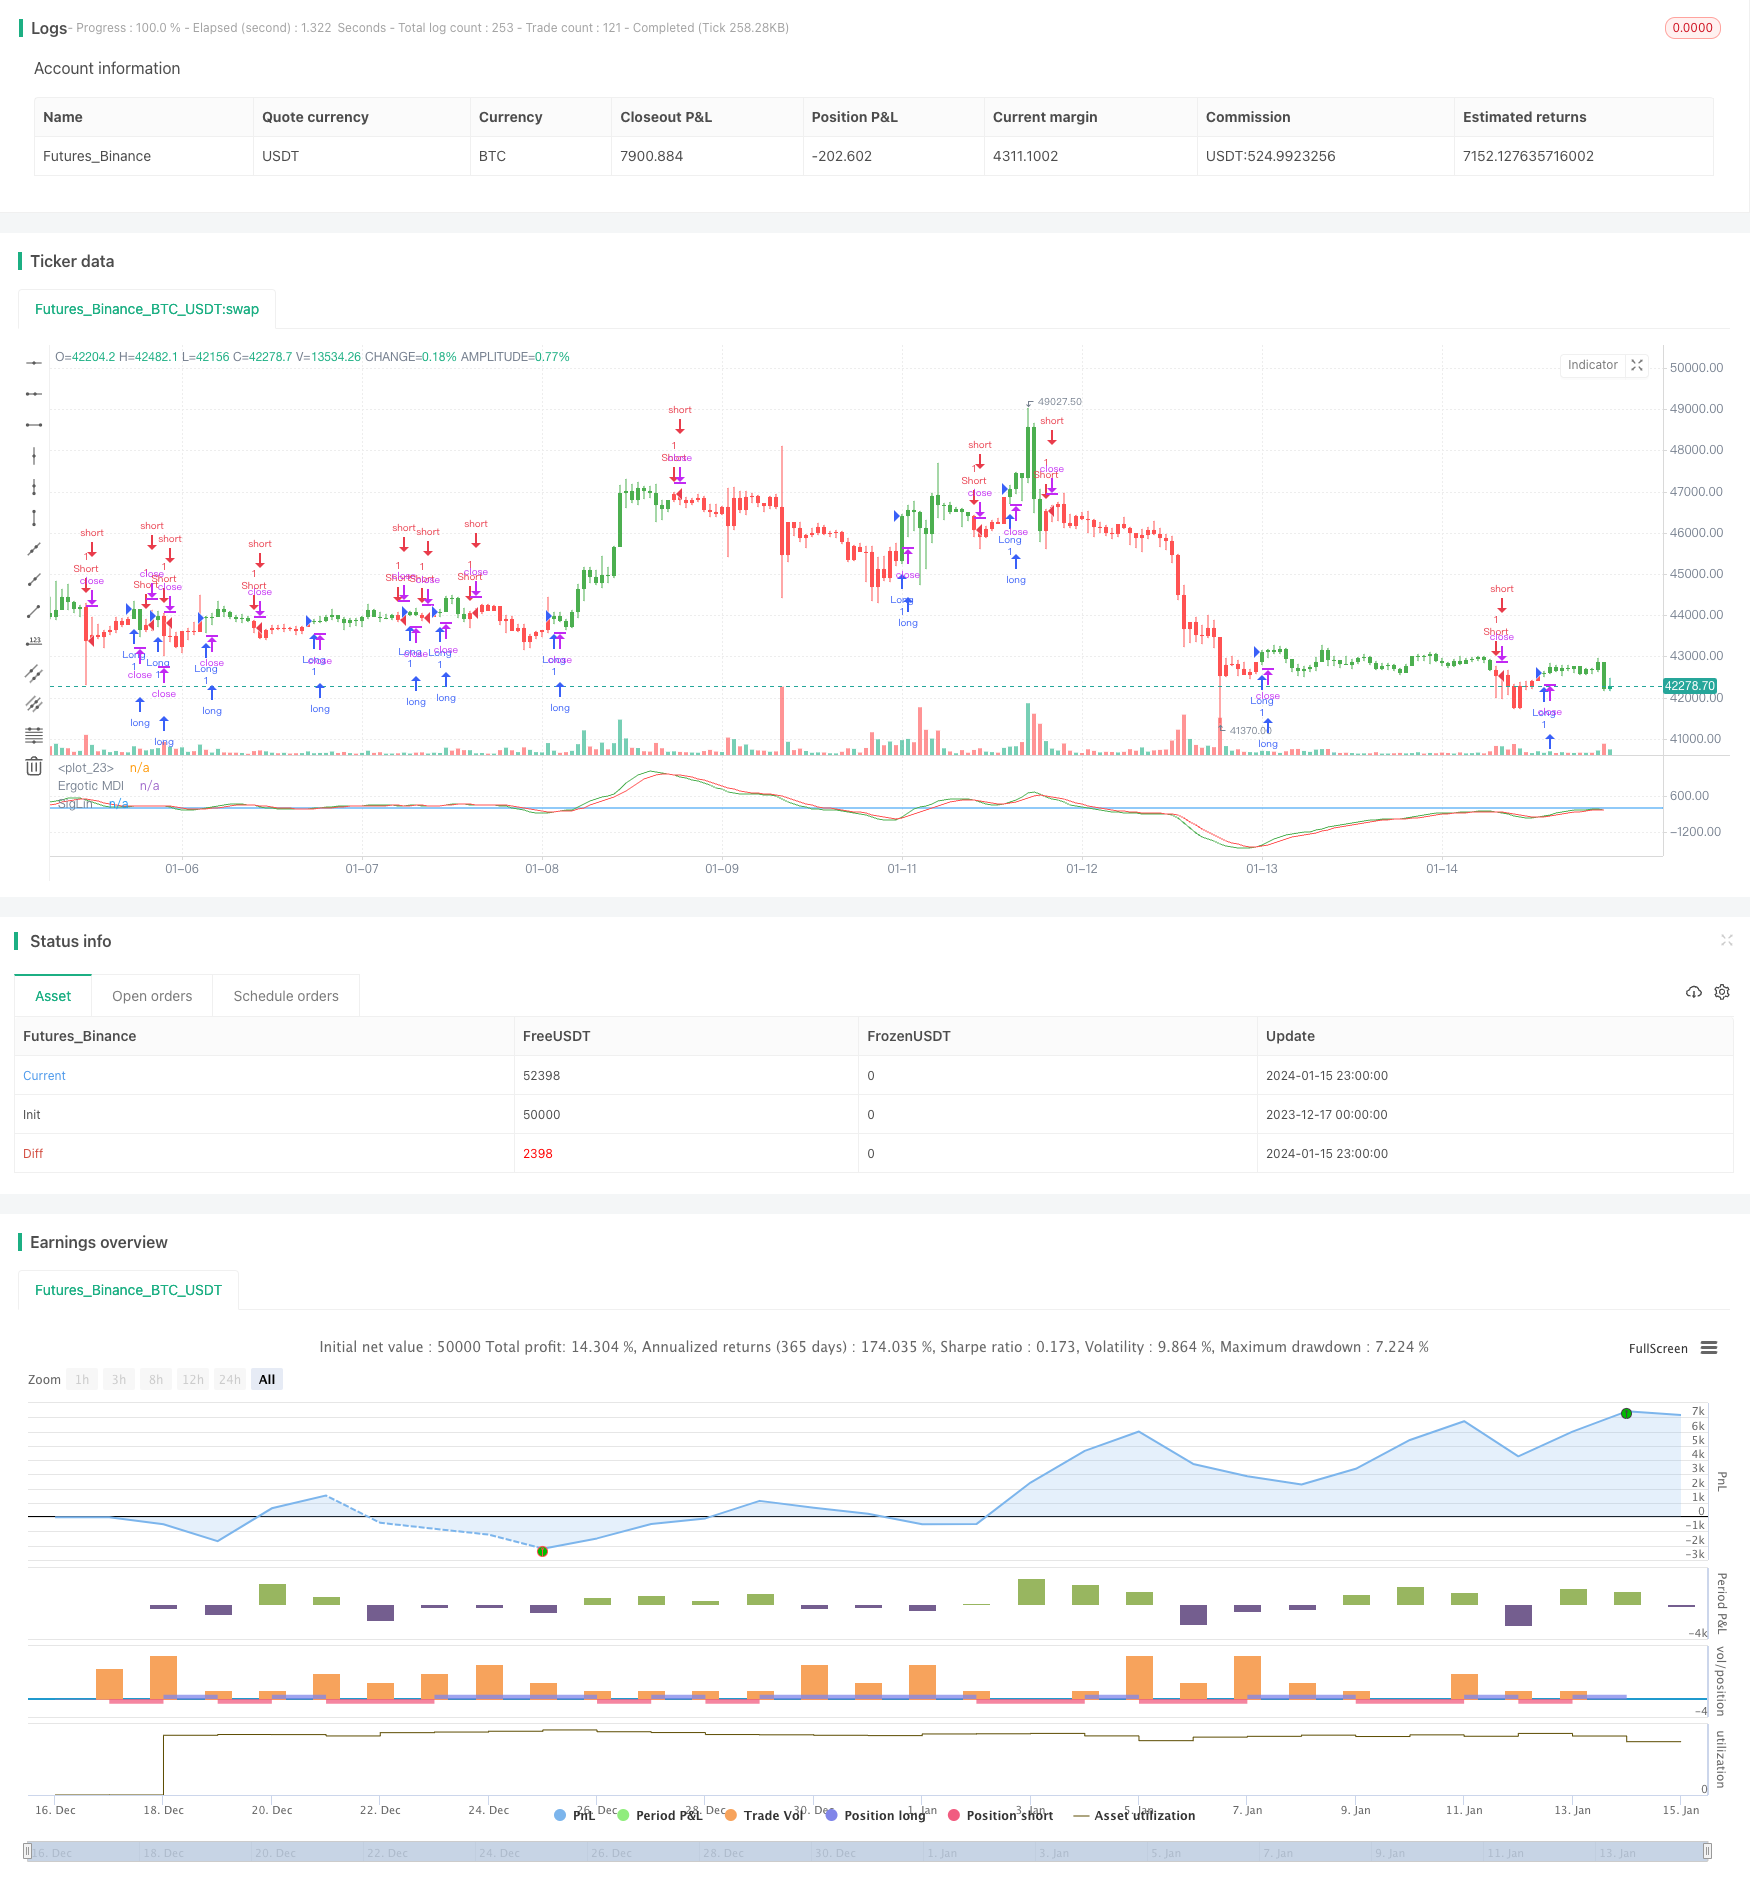
本策略基于William Blau在其1995年出版的《动量,方向和背离》一书中描述的技术指标“动量均差指标”设计。该指标聚焦于价格动量、价格方向和价格背离三个关键要素,深入剖析价格与动量之间的关系。
该策略使用动量均差指标判断价格趋势和破裂点。首先计算价格的EMA均线,然后计算价格距该EMA线的偏差。对这个偏差再进行双重EMA平滑处理,得到最终的动量均差指标曲线。当该曲线上穿或下穿其自身的信号线时产生交易信号。具体来说,计算流程如下:
- 计算价格的EMA均线xEMA
- 计算价格与xEMA的偏差xEMA_S
- 对xEMA_S进行EMA平滑,参数为s,得到xEMA_U
- 对xEMA_U再进行EMA平滑,参数为u,得到信号线xSignal
- 比较xEMA_U与xSignal的大小关系:
- xEMA_U > xSignal 为多头信号
- xEMA_U < xSignal 为空头信号
- 生成交易信号possig
根据possig信号进行买入和卖出操作。
该策略具有以下优势:
- 使用双EMA滤波器,可以有效过滤假突破,提高信号的可靠性
- 基于EMA,对短期价格变动较为敏感,可以捕捉趋势的转折点
- 采用参数化设计,可以按需调整参数,适应不同周期和品种
- 包含长短双向交易信号,可以利用价格双向波动获利
该策略也存在一些潜在风险:
- EMA对参数选择较为敏感,不当设置可能错过信号或产生错误信号
- 多头和空头信号可能同时出现,需要设置过滤条件避免互相抵消
- 双重EMA滤波可能过度过滤掉有效信号,导致漏单
- 未考虑大周期趋势关系,存在逆势交易风险
可通过优化参数,设定过滤条件,引入趋势判断等方式来减少这些风险。
该策略的优化方向如下:
- 优化参数r、s、u值,使其更符合不同周期和品种特征
- 增加趋势判断模块,避免逆势操作
- 增加过滤条件,如通道突破等,避免无效信号
- 结合其他因子和模型,提高策略效果
本策略基于价格与动量关系的动量均差指标,捕捉价格反转时点。它参数化且可优化设计,可以适应不同周期和品种。但也存在一定假信号和逆势交易风险。通过进一步优化参数与模型,结合趋势判断等,可望获得更好绩效。
||
This strategy is based on the technical indicator "Momentum Mean Deviation Index" described in William Blau's book "Momentum, Direction and Divergence" published in 1995. This indicator focuses on three key elements of price momentum, price direction and price divergence, and deeply analyzes the relationship between price and momentum.
This strategy uses the Momentum Mean Deviation Index to determine price trends and breakout points. It first calculates the EMA line of the price, then calculates the deviation of the price from this EMA line. This deviation is then double smoothed by EMA to get the final momentum mean deviation index curve. Trading signals are generated when this curve crosses above or below its own signal line. Specifically, the calculation process is as follows:
- Calculate the EMA line of price xEMA
- Calculate the deviation of price from xEMA, xEMA_S
- Smooth xEMA_S with EMA, parameter s, get xEMA_U
- Smooth xEMA_U again with EMA, parameter u, get signal line xSignal
- Compare the magnitude relationship between xEMA_U and xSignal:
- xEMA_U > xSignal is long signal
- xEMA_U < xSignal is short signal
- Generate trading signal possig
Enter long or short positions according to the possig signal.
The advantages of this strategy include:
- The double EMA filter can effectively filter out false breakouts and improve signal reliability
- Based on EMA, it is sensitive to short-term price changes and can capture trend turning points
- Adopts parameterized design which can adjust parameters as needed to suit different cycles and varieties
- Contains both long and short trading signals to profit from two-way price fluctuations
This strategy also has some potential risks:
- EMA is quite sensitive to parameter selection. Improper settings may miss signals or generate wrong signals
- Long and short signals may appear simultaneously. Filtering conditions need to be set up to avoid offsetting each other
- The double EMA filter may overly filter out valid signals, resulting in missing trades
- It does not consider large cycle trend relationships and has contrarian trading risks
These risks can be reduced by optimizing parameters, setting filtering criteria, introducing trend judgment modules, etc.
The optimization directions for this strategy include:
- Optimize parameter values r, s, u to make them more suitable for different cycles and varieties
- Add trend judgment module to avoid contrarian operations
- Increase filtering conditions like channel breakouts to avoid invalid signals
- Incorporate other factors and models to improve strategy performance
This strategy is based on the momentum mean deviation index which captures price reversal points based on the price-momentum relationship. Its parameterized and optimizable design can adapt to different cycles and varieties. But it also has some false signal and contrarian trading risks. Further optimizing parameters and models and incorporating trend judgment etc. can improve its performance.
[/trans]
Strategy Arguments
| Argument | Default | Description |
|---|---|---|
| v_input_1 | 32 | r |
| v_input_2 | 5 | s |
| v_input_3 | 5 | u |
| v_input_4 | 3 | SmthLen |
| v_input_5 | false | Trade reverse |
Source (PineScript)
/*backtest
start: 2023-12-17 00:00:00
end: 2024-01-16 00:00:00
period: 1h
basePeriod: 15m
exchanges: [{"eid":"Futures_Binance","currency":"BTC_USDT"}]
*/

//@version = 2
////////////////////////////////////////////////////////////
//  Copyright by HPotter v1.0 12/12/2016
// This is one of the techniques described by William Blau in his book "Momentum,
// Direction and Divergence" (1995). If you like to learn more, we advise you to
// read this book. His book focuses on three key aspects of trading: momentum,
// direction and divergence. Blau, who was an electrical engineer before becoming
// a trader, thoroughly examines the relationship between price and momentum in
// step-by-step examples. From this grounding, he then looks at the deficiencies
// in other oscillators and introduces some innovative techniques, including a
// fresh twist on Stochastics. On directional issues, he analyzes the intricacies
// of ADX and offers a unique approach to help define trending and non-trending periods.
//
// You can change long to short in the Input Settings
// Please, use it only for learning or paper trading. Do not for real trading.
////////////////////////////////////////////////////////////
strategy(title="Ergotic MDI (Mean Deviation Indicator) Bactest")
r = input(32, minval=1)
s = input(5, minval=1)
u = input(5, minval=1)
SmthLen = input(3, minval=1)
reverse = input(false, title="Trade reverse")
hline(0, color=blue, linestyle=line)
xEMA = ema(close, r)
xEMA_S = close - xEMA
xEMA_U = ema(ema(xEMA_S, s), u)
xSignal = ema(xEMA_U, u)
pos = iff(xEMA_U > xSignal, 1,
	   iff(xEMA_U < xSignal, -1, nz(pos[1], 0)))
possig = iff(reverse and pos == 1, -1,
          iff(reverse and pos == -1, 1, pos))
if (possig == 1)
    strategy.entry("Long", strategy.long)
if (possig == -1)
    strategy.entry("Short", strategy.short)
barcolor(possig == -1 ? red: possig == 1 ? green : blue )
plot(xEMA_U, color=green, title="Ergotic MDI")
plot(xSignal, color=red, title="SigLin")
Detail
https://www.fmz.com/strategy/439067
Last Modified
2024-01-17 14:08:46