Name
动量均线交叉策略A-Momentum-Crossover-Strategy-Based-on-Exponential-Moving-Average
Author
ChaoZhang
Strategy Description
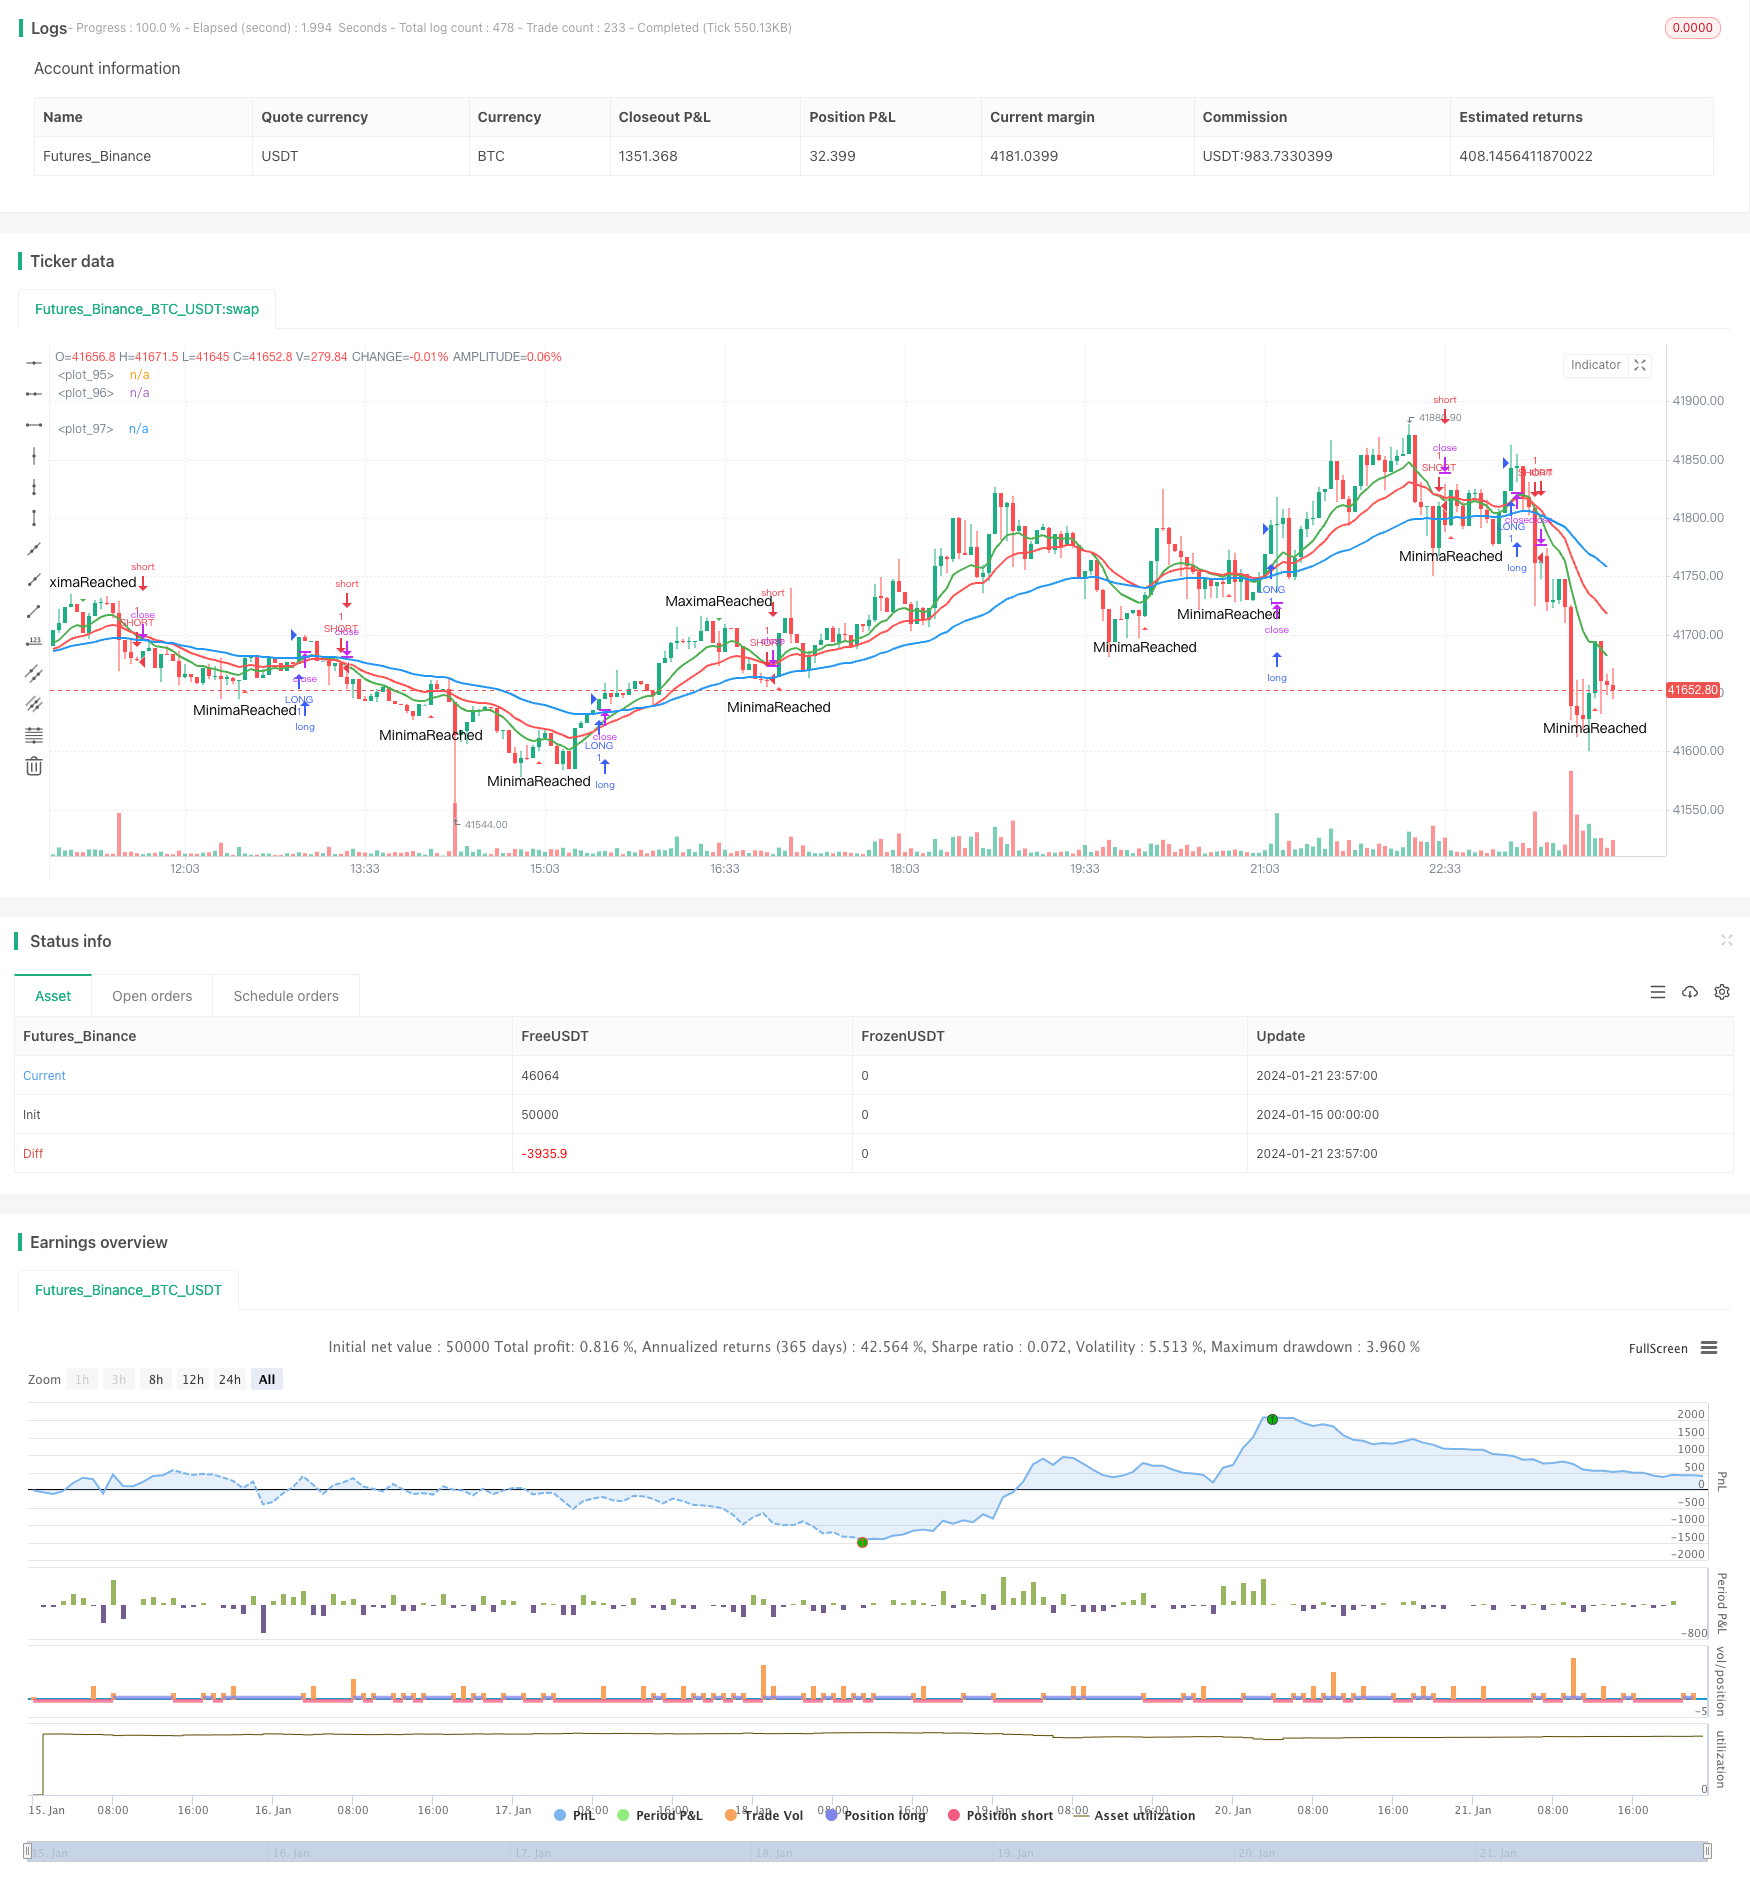
这个策略基于不同周期的EMA均线的交叉来判断趋势方向,并据此建立做多做空信号。主要使用2条均线,分别是10日线和20日线。当10日线从上向下穿过20日线时,做空;当10日线从下向上穿过20日线时,做多。该策略属于中短线交易策略。
该策略使用了2条EMA均线,包括10日线和20日线。EMA均线能很好地反映价格的趋势方向。当短期EMA线从下向上穿过长期EMA线时,表示价格走势由跌转升,属于做多信号;当短期EMA线从上向下穿过长期EMA线时,表示价格走势由升转跌,属于做空信号。
该策略同时结合了波动的极大值和极小值来过滤一部分交易信号。只有在价格波动达到一定幅度后,才会发出交易信号。这可以一定程度上过滤掉部分假信号。
具体来说,该策略通过追踪价格的极大值和极小值的到达时间,来判断价格趋势是否形成。在极大值或者极小值达到一定时间后,才会发出真正的交易信号。
该策略具有以下几个优势:
- 使用EMA均线判断趋势方向,可以有效跟踪市场走势
- 结合不同周期的EMA均线,可以在中短线上捕捉交易机会
- 通过极值过滤信号,可以过滤掉部分噪音,避免错失交易机会
- 策略逻辑简单清晰,容易理解和修改
- 可根据不同品种和交易偏好调整参数,适应性强
该策略也存在一些风险:
- EMA均线本身会存在滞后性,可能错过短期价格反转
- 对噪音信号过滤不完全,可能存在一定的错误交易
- 需适当调整参数以适应不同市场环境
可以通过以下方法降低风险:
- 结合其他指标进行信号确认,避免EMA均线滞后问题
- 优化极值过滤条件,提高信号的可靠性
- 根据回测结果调整参数,优化策略
该策略可以从以下几个方向进行进一步优化:
- 增加其他技术指标组合,提高交易信号准确率。例如MACD,KD等。
- 优化EMA均线的参数,使其更好适应具体品种。
- 优化极大极小值的参数,改进对价格波动的判断。
- 添加止损策略,以控制单笔交易的最大损失。
- 测试不同的品种套用该策略,评估适用性。
该EMA交叉策略整体来说是一种简单实用的趋势跟踪策略。它使用EMA均线判断大趋势方向,再结合价格波动过滤信号,形成交易决策。该策略易于理解和调整参数,可以适应中短线交易。通过进一步优化,这可以成为一种值得长期持有使用的量化策略。
||
This strategy determines the trend direction based on the crossover of EMA lines with different periods and generates long and short signals accordingly. It mainly uses two moving averages - 10-day EMA and 20-day EMA. When the 10-day EMA crosses below the 20-day EMA, a short signal is triggered. When the 10-day EMA crosses above the 20-day EMA, a long signal is triggered. This strategy belongs to medium-term trading strategies.
The strategy utilizes two EMA lines, including the 10-day EMA and the 20-day EMA. The EMA lines can reflect the trend of prices effectively. When the shorter-term EMA line crosses above the longer-term EMA line, it indicates the price trend is turning from decline to rise, which is a long signal. When the shorter-term EMA line crosses below the longer-term EMA line, it indicates the price trend is turning from rise to decline, which is a short signal.
The strategy also combines the maximum and minimum values of price fluctuations to filter some trading signals. Trading signals are only triggered after the price fluctuations reach a certain extent. This can filter out some false signals to some degree.
Specifically, by tracking the time when maximum and minimum values are reached, the strategy judges whether a price trend has formed. Real trading signals are only triggered after the maximum or minimum values have lasted for some time.
The strategy has the following advantages:
- Using EMA lines to determine trend direction can track market moves effectively
- Combining EMA lines of different periods can capture trading opportunities in medium-term
- Filtering signals by extreme values can remove some noise and avoid missing trading chances
- The logic is simple and clear, easy to understand and modify
- Parameters can be adjusted for different products and trading preferences, showing strong adaptability
There are also some risks with this strategy:
- EMA lines themselves have lagging effect, may miss short-term trend reversals
- The noise filtering is imperfect, some wrong trades may occur
- Parameters need proper adjustment to suit different market environments
The risks can be mitigated through:
- Adding other indicators for signal confirmation to avoid EMA line lagging issues
- Optimizing extreme value filtering conditions to improve signal reliability
- Adjusting parameters based on backtest results to optimize the strategy
The strategy can be further optimized in the following aspects:
- Incorporate other technical indicators like MACD and KD to improve signal accuracy
- Optimize EMA line parameters to better suit specific products
- Refine extreme value parameters to better judge price fluctuations
- Add stop loss mechanisms to control maximum loss per trade
- Test the strategy on different products to evaluate adaptability
In summary, this EMA crossover strategy is a simple and practical trend following strategy. It uses EMA lines to determine the major trend direction, combined with price fluctuation filtering for making trading decisions. It is easy to understand and adjust parameters, adaptable to medium-term trading. With further optimizations, this can become a worthwhile quantitative strategy to hold for the long term.
[/trans]
Strategy Arguments
| Argument | Default | Description |
|---|---|---|
| v_input_1 | 2 | Length 0 |
| v_input_2 | 10 | Length 1 |
| v_input_3 | 20 | Length 2 |
| v_input_4 | 50 | Length3 |
Source (PineScript)
/*backtest
start: 2024-01-15 00:00:00
end: 2024-01-22 00:00:00
period: 3m
basePeriod: 1m
exchanges: [{"eid":"Futures_Binance","currency":"BTC_USDT"}]
*/

//@version=2
strategy("PierceMAStrat", overlay=true)

lenMA0 = input(title="Length 0",defval=2)
lenMA1=input(title="Length 1",defval=10)
lenMA2=input(title="Length 2", defval=20)
lenMA3 = input(title = "Length3", defval =50)


emaLen0 = ema(close, lenMA0)
emaLen1 = ema(close, lenMA1)
emaLen2 = ema(close, lenMA2)
emaLen3 = ema(close, lenMA3)


ascent = if emaLen1[1] < emaLen1[0]
    true
else
    false

descent = if emaLen1[1] > emaLen1[0]
    true
else
    false

TimeSinceAscensionStart = if ascent == true
    barssince(descent == true)
else
    0


StartUp = if TimeSinceAscensionStart < 1
    true
else
    false

StartDown = if TimeSinceAscensionStart < 1
    false
else
    true


AscentBarCounter = barssince(StartUp == true)

DescentBarCounter = barssince(StartDown == true)

MaxAscent = if AscentBarCounter[1] > AscentBarCounter[0] and AscentBarCounter[1] > 10
    true
else
    false

MaxDescent = if DescentBarCounter[1] > DescentBarCounter[0] and DescentBarCounter[1] > 5
    true
else
    false

longCond = if crossover(emaLen1, emaLen2) and barssince(MaxDescent == true) > 3
    true
else
    false
shortCond = if crossunder(emaLen1, emaLen2) and barssince(MaxAscent == true) > 3
    true
else
    false


//longCond = (crossover(emaLen1, emaLen2) and (emaLen2 > emaLen3))
//shortCond = crossunder(emaLen1, emaLen2) and (emaLen2 < emaLen3)


if longCond == true
    strategy.entry("LONG", strategy.long)

if shortCond == true
    strategy.entry("SHORT", strategy.short)


plotshape(series=MaxAscent, title="MaximaReached", style=shape.triangledown, location=location.abovebar, color=green, text="MaximaReached", size=size.small)
plotshape(series=MaxDescent, title="MinimaReached", style=shape.triangleup, location=location.belowbar, color=red, text="MinimaReached", size=size.small)
//plotshape(series=StartUp, title="StartUp", style=shape.triangleup, location=location.belowbar, color=red, text="StartUp", size=size.tiny)
//plotshape(series=StartDown, title="StartDown", style=shape.triangleup, location=location.belowbar, color=green, text="StartDown", size=size.tiny)

//plotshape(series=(crossover(emaLen1, emaLen3)), title="GBXOVER", style=shape.triangleup, location=location.belowbar, color=green, text="GBXO", size=size.small)
//plotshape(series=(crossover(emaLen2, emaLen3)), title="RBXOVER", style=shape.triangledown, location=location.abovebar, color=orange, text="RBXO", size=size.small)
//plotshape(series=(crossover(emaLen1, emaLen2)), title="GRXOVER", style=shape.triangledown, location=location.abovebar, color=teal, text="GRXO", size=size.small)
//plotshape(series=(crossunder(emaLen1, emaLen2)), title="GRXUNDER", style=shape.triangledown, location=location.abovebar, color=purple, text="GRXU", size=size.small)
//plotshape(series=(crossunder(emaLen1, emaLen3)), title="GBXOVER", style=shape.triangleup, location=location.belowbar, color=yellow, text="GBXU", size=size.small)
//plotshape(series=(crossunder(emaLen2, emaLen3)), title="RBXOVER", style=shape.triangledown, location=location.abovebar, color=yellow, text="RBXU", size=size.small)

//plotshape(convergence, color=lime, style=shape.arrowup, text="CROSS")
plot(emaLen1, color=green, transp=0, linewidth=2)
plot(emaLen2, color=red, transp=30, linewidth=2)
plot(emaLen3, color=blue, transp=30, linewidth=2)
Detail
https://www.fmz.com/strategy/439737
Last Modified
2024-01-23 14:18:26