Name
动量指标均线交叉策略Momentum-Indicator-Crossover-Strategy
Author
ChaoZhang
Strategy Description
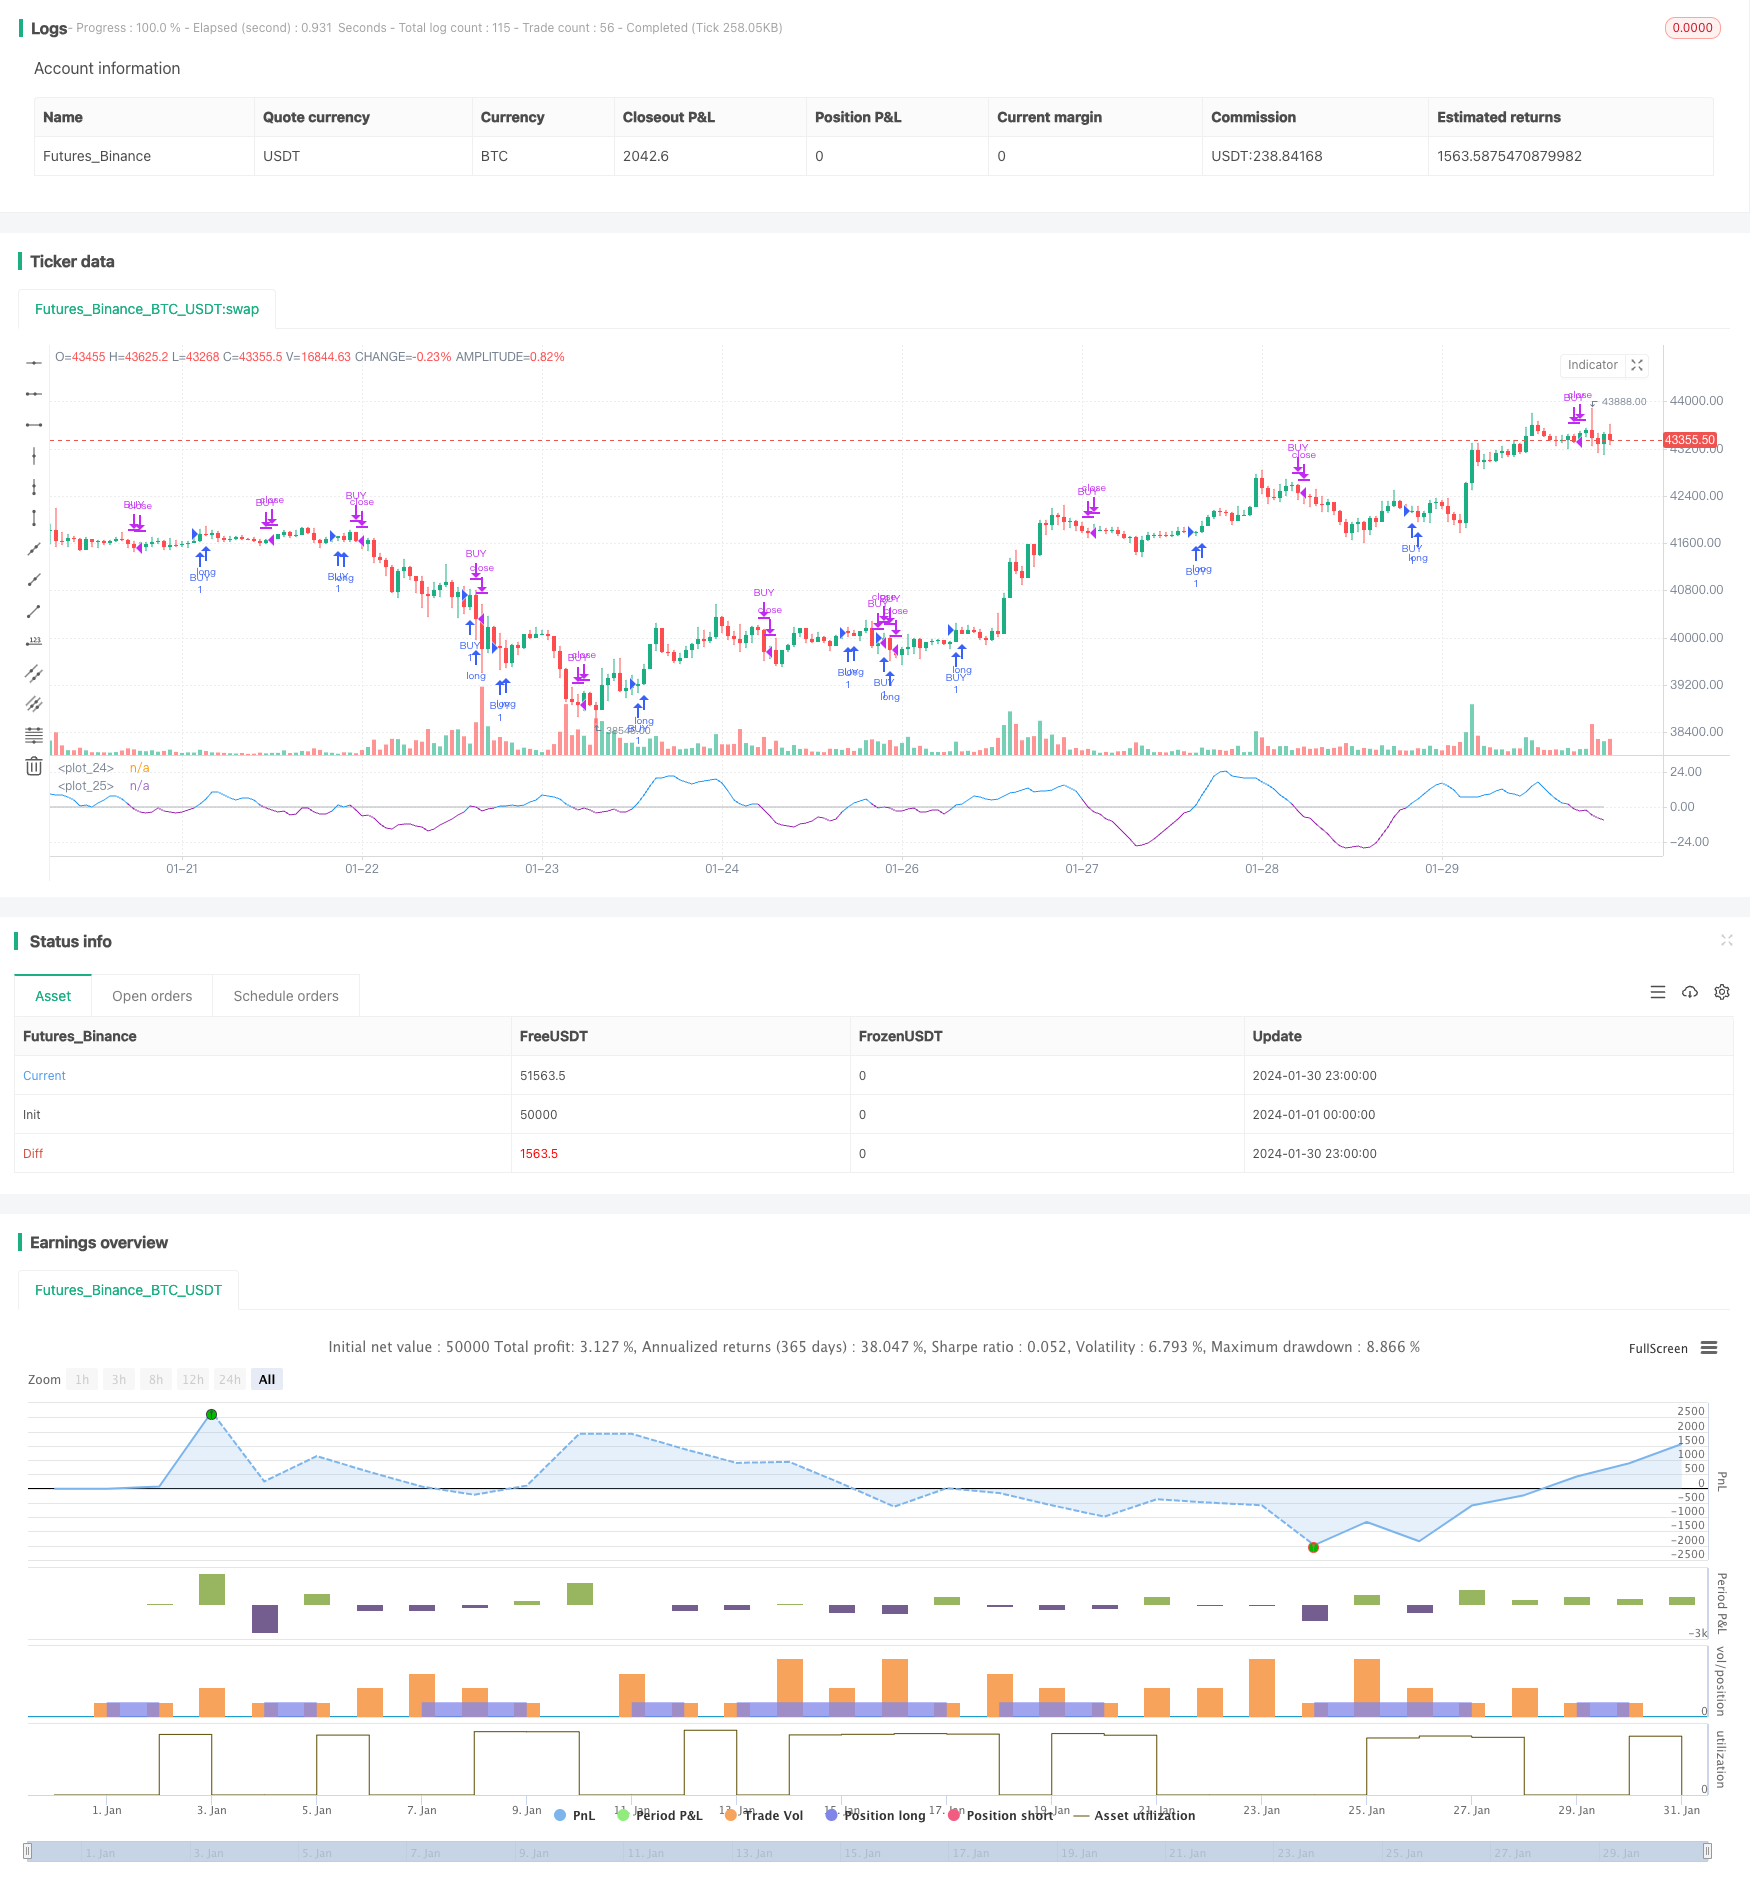
该策略运用RSI指标与其均线的交叉作为交易信号,属于常见的动量指标策略。其核心原理是追踪RSI指标与RSI的简单移动平均线SMA_RSI之间的差值,再对这个差值计算简单移动平均线SMA_RSI2,当SMA_RSI2上穿阈值时做多,下穿阈值时平仓。
该策略使用3个参数计算RSI指标与其两个不同周期的简单移动平均线。首先计算常规RSI指标,周期为length。然后计算RSI的length2周期简单移动平均线SMA_RSI。最后计算RSI与SMA_RSI的差值delta,再对delta计算length3周期的简单移动平均线SMA_RSI2。当SMA_RSI2上穿用户设定的阈值时,进行多头交易;当SMA_RSI2下穿阈值时,平仓头寸。
这样,就构成了基于RSI指标均线交叉的交易策略信号。由于SMA_RSI2是差值delta的均线,能够反映RSI指标的动量和变化趋势,掌握住了RSI指标本身的精髓。
该策略结合了RSI指标与其均线的优点,能够顺应价格趋势,避免被噪音误导。采用差值delta再平滑的思路,使得交易信号更加清晰。总体来说,该策略回撤较小,获利稳定。
具体优势如下:
- 运用差值delta平滑价格波动,减少假信号
- 均线交叉形式简单直接,容易掌握
- 可调参数较多,可根据市场调整
- 获利稳定,回撤较小
该策略也存在一些风险,主要体现在:
- 大幅行情中,止损可能较大
- 震荡趋势中容易获利不稳定
可以从以下几个方面进行改进:
- 优化参数,提高稳定性
- 加入止损机制,控制单笔损失
- 与其他指标组合,提升信号质量
本策略整体较为简单通用,通过差值运算增加了RSI指标本身的实用性,利用均线交叉进行判断,回撤控制能力较强,是一种非常实用的动量指标策略。
||
This strategy uses the crossover of the RSI indicator and its moving average as trading signals, belonging to the common momentum indicator strategies. Its core principle is to track the difference between the RSI indicator and the simple moving average SMA_RSI of RSI, and then calculate the simple moving average SMA_RSI2 of this difference. When SMA_RSI2 crosses above the threshold, go long. When crossing below the threshold, close the position.
The strategy uses 3 parameters to calculate the RSI indicator and its two simple moving averages with different periods. First, calculate the regular RSI indicator with period length. Then calculate the length2 period simple moving average SMA_RSI of RSI. Finally, calculate the difference delta between RSI and SMA_RSI, and then calculate the length3 period simple moving average SMA_RSI2 of delta. When SMA_RSI2 crosses above the user-defined threshold, make long trades. When SMA_RSI2 crosses below the threshold, close positions.
Thus, a trading signal strategy based on the crossover of RSI indicator moving averages is formed. Since SMA_RSI2 is the moving average of the difference delta, it can reflect the momentum and trend changes of the RSI indicator, grasping the essence of the RSI indicator itself.
The strategy combines the advantages of RSI indicators and their moving averages to follow price trends and avoid misleading by noise. The idea of calculating the difference delta and then smoothing generates clearer trading signals. Overall, this strategy has smaller drawdowns and more stable profits.
The specific advantages are:
- Using delta to smooth price fluctuations and reduce false signals
- Simple and direct form of moving average crossover, easy to master
- More adjustable parameters to fit the market
- Stable profit, smaller drawdown
There are also some risks in this strategy, mainly reflected in:
- Larger stop loss in significant market moves
- Unstable profit in ranging trends
Improvements can be made in the following aspects:
- Optimize parameters to increase stability
- Add stop loss mechanisms to control single loss
- Combine with other indicators to improve signal quality
This strategy is relatively simple and universal. By increasing the practicality of the RSI indicator itself through delta arithmetic operations and using crossover to judge, it has good drawdown control and is a very practical momentum indicator strategy.
[/trans]
Strategy Arguments
| Argument | Default | Description |
|---|---|---|
| v_input_1 | 2017 | Start Year |
| v_input_2 | 12 | Month |
| v_input_3 | 17 | Day |
| v_input_4 | 3 | RSI period |
| v_input_5 | 21 | RSI SMA-1 |
| v_input_6 | 13 | RSI SMA-2 |
| v_input_7 | false | Threshold |
| v_input_8 | false | Use filter? |
Source (PineScript)
/*backtest
start: 2024-01-01 00:00:00
end: 2024-01-31 00:00:00
period: 1h
basePeriod: 15m
exchanges: [{"eid":"Futures_Binance","currency":"BTC_USDT"}]
*/

//@version=4
strategy ("RSI&SMA", overlay=false )
startP = timestamp(input(2017, "Start Year"), input(12, "Month"), input(17, "Day"), 0, 0)
end   = timestamp((9999), (1), (1), 0, 0)
_testPeriod() => true

length = input(3, minval=1, title = "RSI period")
length2 = input(21, minval=1, title = "RSI SMA-1")
length3 = input(13, minval=1, title = "RSI SMA-2")
threshold  = input(0,step=0.5, title="Threshold")
filter = input(false, title="Use filter?")


up = rma (max (change (close), 0), length)
down = rma (-min (change (close), 0), length)
RSI = down == 0? 100: up == 0? 0: 100-100 / (1 + up / down)

SMA_RSI = sma(RSI, length2)
delta = RSI-SMA_RSI
SMA_RSI2 = sma(delta, length3)
Long = crossover(SMA_RSI2, threshold)
Short = crossunder(SMA_RSI2, threshold)

plot(threshold, color=color.silver)
plot(SMA_RSI2, color= SMA_RSI2 > 0 ? color.blue : color.purple)
//plot(SMA_RSI, color=color.green)
//plot(delta, color=color.red)

long_condition =  Long and (filter ? close > ema(close, 200) : true) and _testPeriod()
strategy.entry('BUY', strategy.long, when=long_condition)

short_condition =  Short
strategy.close('BUY', when=short_condition)
Detail
https://www.fmz.com/strategy/440720
Last Modified
2024-02-01 14:50:26