Name
动量矩形通道双均线交易策略Momentum-Rectangle-Channel-Dual-Moving-Average-Trading-Strategy
Author
ChaoZhang
Strategy Description
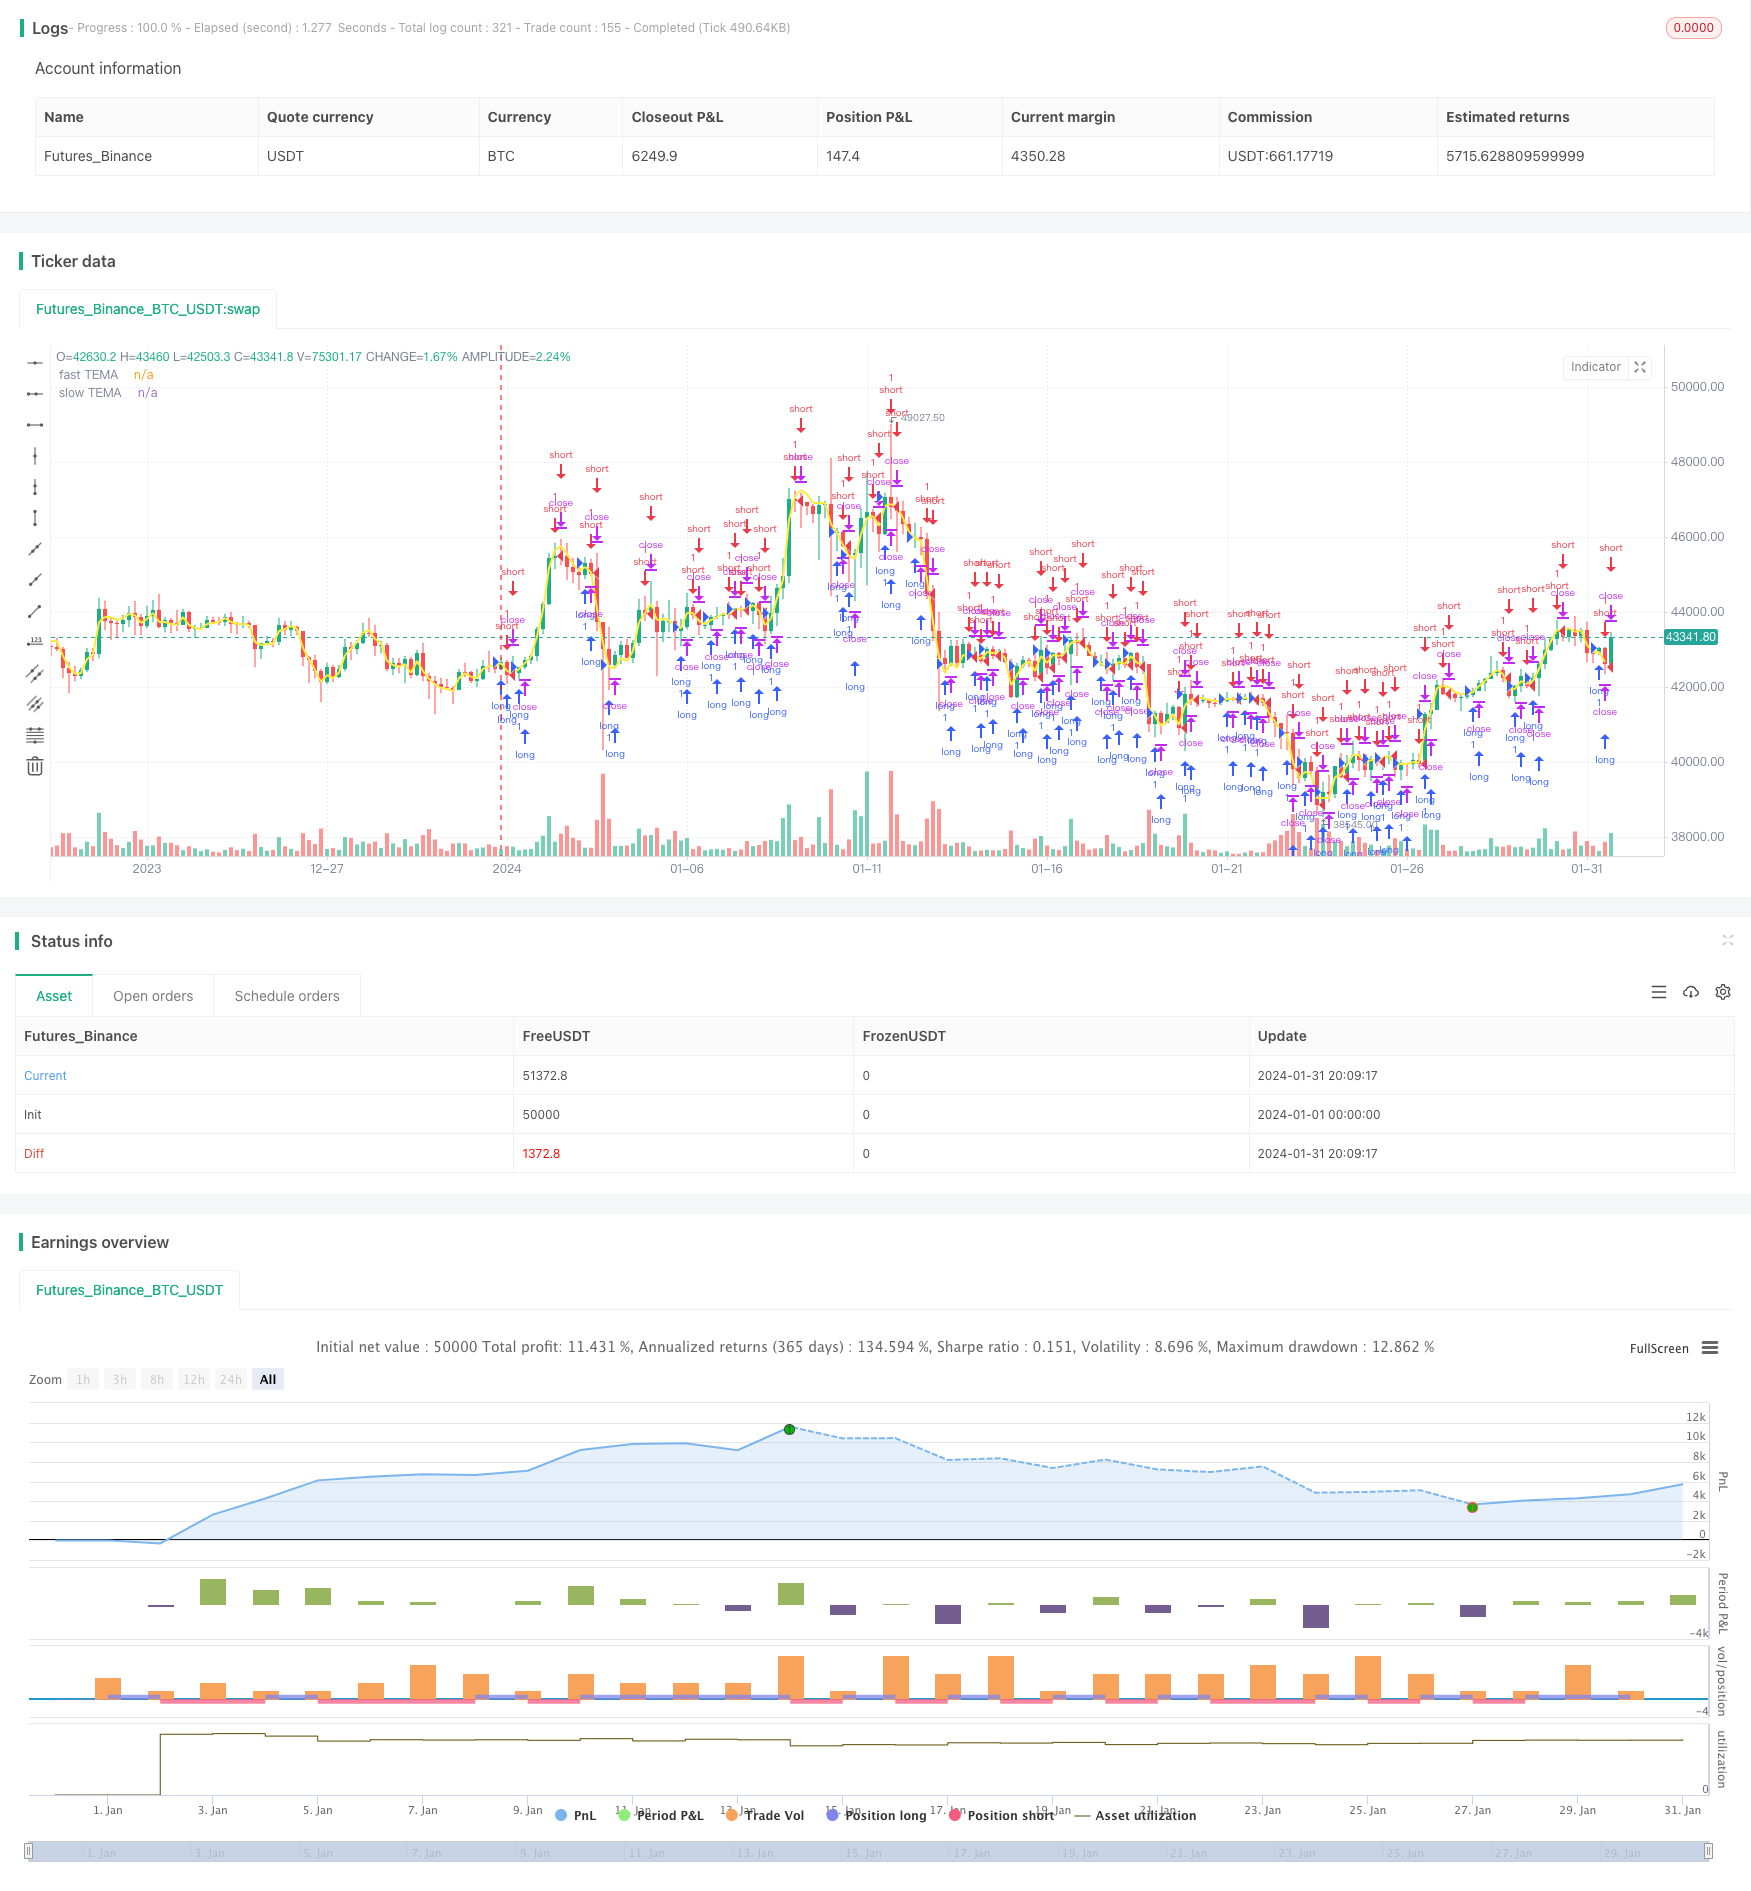
本策略基于动量指标矩形通道和双均线指标,实现了一个较为完整的股票交易系统。策略首先使用快速EMA和慢速EMA构建双均线交易信号。然后结合矩形通道指标进一步验证交易信号,实现更准确的入场。此外,策略还使用了SAR指标来辅助判断趋势方向。
-
计算快速EMA周期5日和慢速EMA周期50日的均线。快速EMA反映最近价格变化,慢速EMA反映长期趋势。
-
将EMA转换为TEMA(三重指数移动平均线),利用TEMA的加权计算方法,提高曲线的灵敏度,更快捕捉价格变化。
-
当快速TEMA上穿慢速TEMA时产生买入信号;当快速TEMA下穿慢速TEMA时产生卖出信号。双均线交叉原理被广泛应用于量化交易。
-
计算价格通道宽度,形成通道区域。只有当价格突破通道才考虑发出交易信号。这可以过滤假信号,验证真正趋势的开始。
-
SAR指标判断整体趋势方向,与双均线交易信号组合使用,可以避免不必要的反向操作。
-
双均线交叉结合通道突破,可以有效识别趋势的开始,过滤噪音,使买卖信号更加准确可靠。
-
TEMA曲线比EMA曲线更加灵敏,可以更快速捕捉价格变化。
-
多种指标组合使用,可以形成指标间的验证机制,避免单一指标的局限性,使策略更加全面和稳健。
-
策略参数设置灵活,EMA周期、通道宽度等都可以根据市场行情进行调整优化,适应性强。
-
股价短期内存在剧烈波动的概率,容易引发止损。
-
突发事件导致股价出现缺口,无法按预期价格成交。
-
双均线交叉并不能完全避免假信号的出现,仍有一定的误判率。
-
参数设置不当可能导致过于频繁或滞后的交易信号。
-
可以结合更多指标,如KD、MACD等进行验证,使策略更加全面可靠。
-
可以设置动态周期,根据市场波动程度来调整EMA 和通道参数,使策略更加灵活。
-
可以建立机器学习模型,训练大量历史数据,自动优化参数设置,减少人工干预。
-
可以结合文本分析、新闻情感等判断市场气氛,避免在重大消息发布时无谓交易。
本策略通过快慢TEMA均线交叉形成交易信号,再结合价格通道和SAR指标进行验证,可以有效识别股价趋势的开始,在合理位置进行买卖操作。多种指标组合互相验证,可以提高信号的可靠性,是一种较为稳健和高效的股票交易策略。通过不断优化参数设置、增加新的验证指标等手段,策略的效果还可继续改进。
||
This strategy is based on momentum indicators of Rectangle Channel and Dual Moving Average, which implements a relatively complete stock trading system. The strategy first uses fast EMA and slow EMA to construct dual moving average trading signals. Then, combined with the Rectangle Channel indicator, it further verifies the trading signals to achieve more accurate entry. In addition, the strategy also uses the SAR indicator to assist in judging the trend direction.
-
Calculate the moving averages of fast EMA with period 5 days and slow EMA with period 50 days. Fast EMA reflects recent price changes and slow EMA reflects long term trends.
-
Convert EMA to TEMA (Triple Exponential Moving Average), using TEMA's weighted calculation method to improve the sensitivity of the curve and capture price changes faster.
-
When fast TEMA crosses above slow TEMA, a buy signal is generated; when fast TEMA crosses below slow TEMA, a sell signal is generated. The principle of dual moving average crossover is widely used in quantitative trading.
-
Calculate the price channel width to form channel areas. Trading signals are only considered when prices break through the channel. This can filter false signals and verify the real start of a trend.
-
SAR indicator determines the overall trend direction, combined with the dual moving average trading signals, can avoid unnecessary reverse operations.
-
The combination of dual moving average crossover and channel breakthrough can effectively identify the beginning of a trend, filter noise, and make buy and sell signals more accurate and reliable.
-
The TEMA curve is more sensitive than the EMA curve and can capture price changes faster.
-
The combination of multiple indicators can form a verification mechanism between indicators to avoid the limitations of a single indicator and make the strategy more comprehensive and robust.
-
The strategy parameters are flexible, EMA cycles, channel widths, etc. can be adjusted and optimized according to market conditions for strong adaptability.
-
There is a probability of violent fluctuations in stock prices in the short term, which can easily trigger a stop loss.
-
Sudden events may cause price gaps that cannot be traded at expected prices.
-
Dual moving average crossovers cannot completely avoid false signals, there is still a certain misjudgment rate.
-
Improper parameter settings can lead to excessively frequent or lagging trading signals.
-
More indicators such as KD and MACD can be combined for verification to make the strategy more comprehensive and reliable.
-
Dynamic cycles can be set to adjust the parameters of EMA and Channel according to the degree of market volatility, making the strategy more flexible.
-
Machine learning models can be established to train a large amount of historical data to automatically optimize parameter settings and reduce manual intervention.
-
Text analysis and news sentiment judgment can be combined to avoid unnecessary trading when major news is released.
This strategy forms trading signals through fast-slow TEMA moving average crossover, and then verifies them with price channel and SAR indicator, which can effectively identify the beginning of stock price trends and make buy and sell operations at reasonable positions. The combination of multiple indicators to verify each other can improve the reliability of signals and is a relatively robust and efficient stock trading strategy. By continuously optimizing parameter settings, adding new verification indicators, etc., the effect of the strategy can be further improved.
[/trans]
Strategy Arguments
| Argument | Default | Description |
|---|---|---|
| v_input_1 | 5 | Fast TEMA Period |
| v_input_2 | 50 | Slow TEMA Periods |
| v_input_3 | true | From Month |
| v_input_4 | 4 | From Day |
| v_input_5 | 2010 | From Year |
| v_input_6 | true | To Month |
| v_input_7 | true | To Day |
| v_input_8 | 9999 | To Year |
Source (PineScript)
/*backtest
start: 2024-01-01 00:00:00
end: 2024-01-31 23:59:59
period: 4h
basePeriod: 15m
exchanges: [{"eid":"Futures_Binance","currency":"BTC_USDT"}]
*/

//@version=2
strategy("TEMA_System_SAR", overlay=true)

//Collect inputs parameters

fastEmaPeriod = input(5, minval=1, title="Fast TEMA Period")
slowEmaPeriod = input(50, minval=1, title="Slow TEMA Periods")

// === INPUT BACKTEST RANGE ===
FromMonth = input(defval = 1, title = "From Month", minval = 1, maxval = 12)
FromDay   = input(defval = 4, title = "From Day", minval = 1, maxval = 31)
FromYear  = input(defval = 2010, title = "From Year", minval = 2000)
ToMonth   = input(defval = 1, title = "To Month", minval = 1, maxval = 12)
ToDay     = input(defval = 1, title = "To Day", minval = 1, maxval = 31)
ToYear    = input(defval = 9999, title = "To Year", minval = 2000)

// === FUNCTION EXAMPLE ===
start     = timestamp(FromYear, FromMonth, FromDay, 09, 15)  // backtest start window
finish    = timestamp(ToYear, ToMonth, ToDay, 15, 30)        // backtest finish window
window()  => true

fastEma = ema(close, fastEmaPeriod)
slowEma = ema(close, slowEmaPeriod)

//convert EMA into TEMA

ema1 = ema(close, fastEmaPeriod)
ema2 = ema(ema1, fastEmaPeriod)
ema3 = ema(ema2, fastEmaPeriod)

fastTEMA = 3 * (ema1 - ema2) + ema3

// convert EMA into TEMA

ema4 = ema(close, fastEmaPeriod)
ema5 = ema(ema1, fastEmaPeriod)
ema6 = ema(ema2, fastEmaPeriod)

slowTEMA = 3 * (ema4 - ema5) + ema6

buy  = close > fastTEMA
sell = close < fastTEMA

plot(fastTEMA, title = 'fast TEMA', linewidth=2, color=white)
plot(slowTEMA, title = 'slow TEMA', linewidth=2, color=yellow)

strategy.entry("long",strategy.long, when = window() and buy)
strategy.entry("short", strategy.short, when = window() and sell)
Detail
https://www.fmz.com/strategy/442935
Last Modified
2024-02-27 14:54:07