Name
动量突破布林带交易策略Bollinger-Band-Momentum-Breakout-Trading-Strategy
Author
ChaoZhang
Strategy Description
该策略结合布林带指标和交易量指标,在高交易量环境下,识别强势突破布林带上轨的机会,进行买入操作。同时结合移动平均线指标,确定趋势方向,减少抱死仓位的风险。
- 使用布林带指标判断价格是否突破布林带上轨。
- 使用交易量指标判断当前交易量是否明显高于过去一段时间的平均交易量。
- 在交易量活跃,价格突破布林带上轨的情况下,进行买入操作。
- 使用移动平均线指标判断短期和中期趋势,在趋势不利时及时平仓止损。
该策略主要考虑三方面因素:价位、动量和趋势。当价格突破布林带上轨进入买入区域,大量资金涌入导致交易量激增,说明有较强的行情支持和动能,这时开仓做多。然后结合移动平均线判断行情走势,避免抱死仓位。通过价位选择、资金及时追踪和减少空仓风险的方式,获取行情带来的收益。
-
交易信号准确,避免虚假突破。结合交易量指标,只在真实强势行情中买入,减少头寸风险。
-
通过移动平均线判断趋势方向,能够及时止损,减少空仓损失。
-
实现了综合多种指标进行决策的量化策略,参数可以灵活调整,适应不同品种和周期。
-
代码结构清晰,增加了策略可读性。分模块组织指标计算、交易信号、开平仓逻辑等,便于后期维护。
-
布林带作为波动范围指标,对极端行情可能失效。如果出现异常波动,会错过买入信号或者产生虚假信号。
-
当交易量不足时,策略无法获利。如果市场整体交易量不足,即使产生买入信号也难以获利。
-
移动平均线作为趋势判断指标也可能失效,无法完全保证止损。
-
参数设置不当也会影响策略收益。例如交易时间窗口设置过短,会错过走势反转等。
-
可以考虑加入更多判断趋势、支持阻力位的技术指标,提高止损效果,例如K线形态、通道指标、关键支撑位等。
-
增加机器学习模型判断真实突破的可能性,降低虚假信号率。例如LSTM等深度学习模型。
-
优化资金管理策略,例如动态调整仓位,跟踪止损线等。减少单笔损失的影响。
-
测试更多品种和时间周期参数。调整布林带参数、交易量参数等,优化适应市场的策略。
该策略整合布林带指标和交易量指标,在强势行情中识别买入时机。同时使用移动平均线指标判断趋势,及时止损。相比单一技术指标,具有更高的准确性和止损能力。通过模块化设计、趋势判断和止损策略的加入,形成一个易于优化维护的突破交易策略。
||
This strategy combines Bollinger Band indicator and volume indicators to identify strong momentum breakout opportunities above Bollinger upper band when trading volume is high, and enters long positions. It also uses moving average indicators to determine trend direction and reduce the risk of holding dead positions.
- Use Bollinger Band indicator to determine if price breaks out above the upper band.
- Use trading volume indicators to determine if current volume is significantly higher than past period average.
- Enter long position when trading volume is high and price breaks out above Bollinger upper band.
- Use moving average indicators to determine short term and medium term trend to cut loss in time.
This strategy mainly considers three factors: price level, momentum and trend. When price breaks out the Bollinger upper band into the buy zone, surge in trading volume indicates strong momentum and capital inflow. This is the right timing to enter long position. Then it uses moving averages to determine market trend to avoid holding dead positions. By combining price action, momentum and risk control, it aims to capture profits from strong trends.
-
Accurate signals, avoids false breakout. Combining volume filter, it only buys on real strong momentum, reducing risk.
-
Able to cut loss in time via moving average trend determination, reducing holding loss.
-
Implemented quantitative strategy combining multiple indicators for decision making. Flexible parameters tuning for different products and timeframes.
-
Clear code structures, easy to read and maintain. Modular design of indicators calculation, signal generation and position management.
-
Bollinger Bands could fail during extreme price swings, missing signals or generating false signals.
-
No profits when overall trading volume is low. Buy signals may not be profitable without enough trading volume.
-
Moving averages trend determination could also fail, unable to fully ensure effective stop loss.
-
Improper parameter tuning also affects strategy profitability. For example, trading time window set too short may miss trend reversal.
-
Add more technical indicators for better trend and support/resistance analysis, improving stop loss, e.g. candlestick patterns, channels, key support levels.
-
Add machine learning models to judge real breakout possibilities, reducing false signals. e.g. LSTM deep learning models.
-
Optimize capital management strategies like dynamic position sizing, trailing stop loss to reduce single trade loss impact.
-
Test more products and timeframes, adjust parameters like Bollinger Bands, volume window to improve strategy robustness.
This strategy integrates Bollinger Band and trading volume indicators to identify strong momentum buying opportunities, with moving averages ensuring effective stop loss. Compared to single indicator strategies, it has higher accuracy and risk control capabilities. With modular design, trend filters and stop loss mechanisms, it forms an easy-to-optimize momentum breakout trading strategy.
[/trans]
Strategy Arguments
| Argument | Default | Description |
|---|---|---|
| v_input_1 | true | length1 |
| v_input_2 | 3 | length3 |
| v_input_3 | 7 | length7 |
| v_input_4 | 9 | length9 |
| v_input_5 | 14 | length14 |
| v_input_6 | 20 | length20 |
| v_input_7 | 60 | length60 |
| v_input_8 | 120 | length120 |
| v_input_9 | 50 | Daily MA length |
| v_input_10 | 10 | Weekly MA length |
| v_input_11 | 20 | length |
| v_input_12_close | 0 | Source: close |
| v_input_13 | 2 | StdDev |
| v_input_14 | 1.5 | exp |
| v_input_15 | true | exp1 |
| v_input_16 | 2.5 | exp2 |
| v_input_17 | false | Offset |
Source (PineScript)
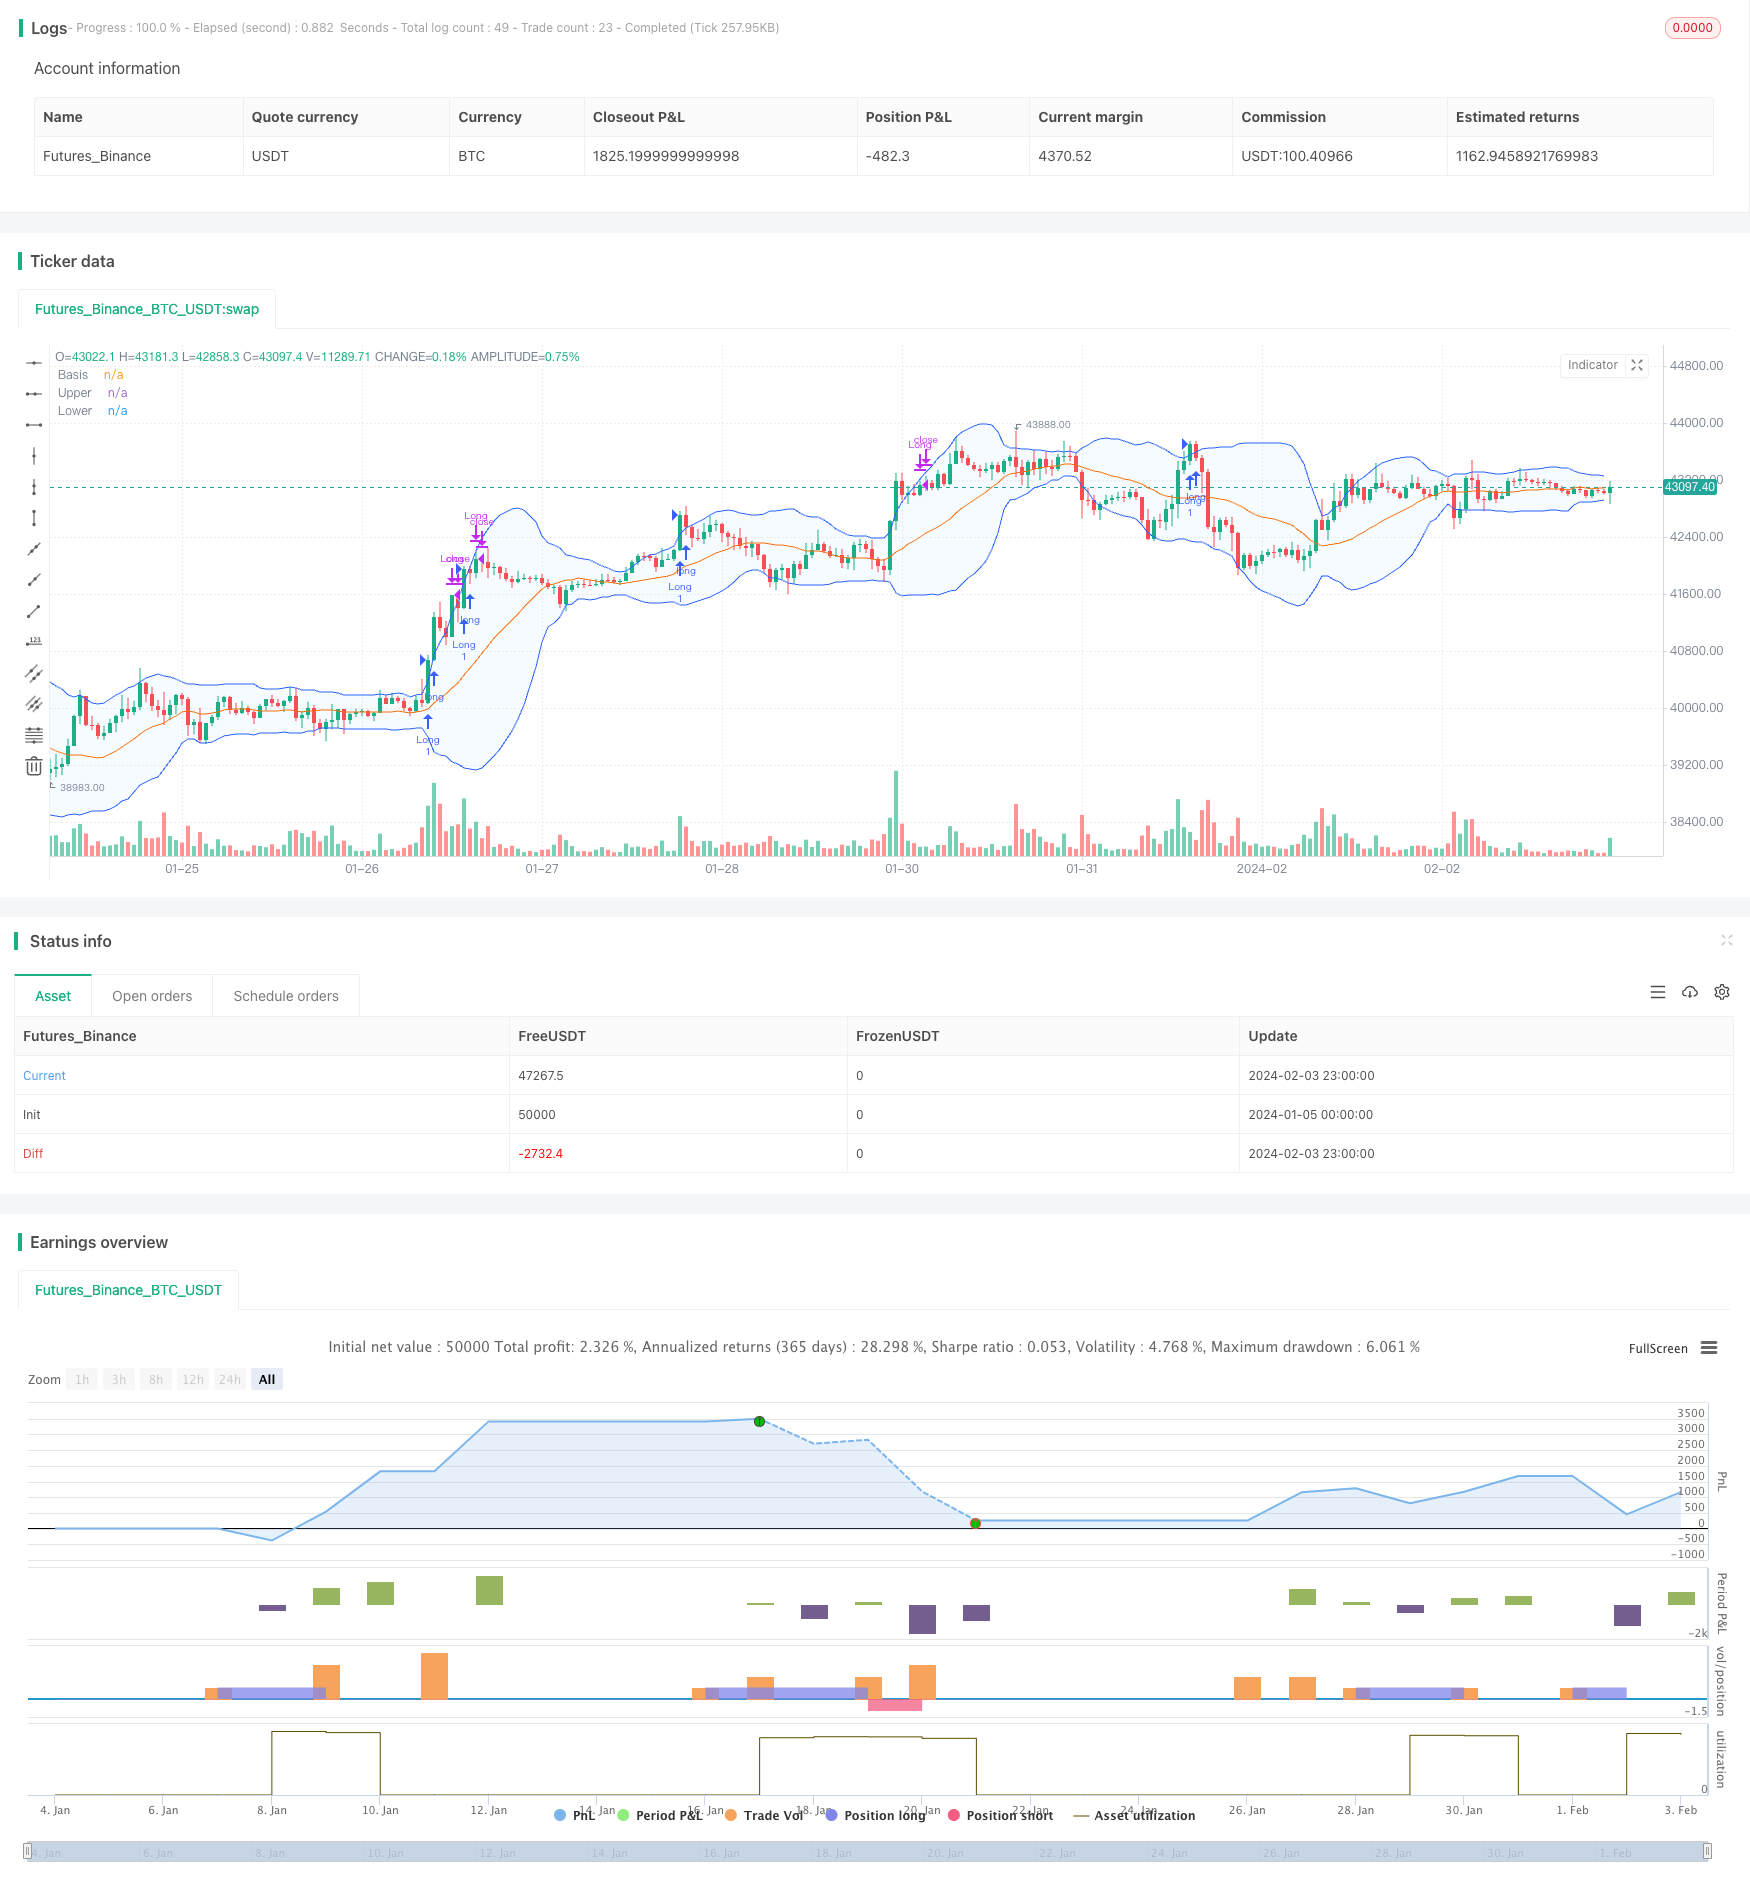
/*backtest
start: 2024-01-05 00:00:00
end: 2024-02-04 00:00:00
period: 1h
basePeriod: 15m
exchanges: [{"eid":"Futures_Binance","currency":"BTC_USDT"}]
*/

// This source code is subject to the terms of the Mozilla Public License 2.0 at https://mozilla.org/MPL/2.0/
// © KAIST291

//@version=4
initial_capital=1000
strategy("prototype", overlay=true)
length1=input(1)
length3=input(3)
length7=input(7)
length9=input(9)
length14=input(14)
length20=input(20)
length60=input(60)
length120=input(120)
ma1= sma(close,length1)
ma3= sma(close,length3)
ma7= sma(close,length7)
ma9= sma(close,length9)
ma14=sma(close,length14)
ma20=sma(close,length20)
ma60=sma(close,length60)
ma120=sma(close,length120)
rsi=rsi(close,14)
// BUYING VOLUME AND SELLING VOLUME //
BV = iff( (high==low), 0, volume*(close-low)/(high-low))
SV = iff( (high==low), 0, volume*(high-close)/(high-low))
vol = iff(volume > 0, volume, 1)
dailyLength = input(title = "Daily MA length", type = input.integer, defval = 50, minval = 1, maxval = 100)
weeklyLength = input(title = "Weekly MA length", type = input.integer, defval = 10, minval = 1, maxval = 100)
//-----------------------------------------------------------
Davgvol = sma(volume, dailyLength)
Wavgvol = sma(volume, weeklyLength)
//-----------------------------------------------------------
length = input(20, minval=1)
src = input(close, title="Source")
mult = input(2.0, minval=0.001, maxval=50, title="StdDev")
mult2= input(1.5, minval=0.001, maxval=50, title="exp")
mult3= input(1.0, minval=0.001, maxval=50, title="exp1")
mult4= input(2.5, minval=0.001, maxval=50, title="exp2")
basis = sma(src, length)
dev = mult * stdev(src, length)
upper = basis + dev
lower = basis - dev
dev2= mult2 * stdev(src, length)
Supper= basis + dev2
Slower= basis - dev2
dev3= mult3 * stdev(src, length)
upper1= basis + dev3
lower1= basis - dev3
dev4= mult4 * stdev(src, length)
upper2=basis + dev4
lower2=basis - dev4
offset = input(0, "Offset", type = input.integer, minval = -500, maxval = 500)
plot(basis, "Basis", color=#FF6D00, offset = offset)
p1 = plot(upper, "Upper", color=#2962FF, offset = offset)
p2 = plot(lower, "Lower", color=#2962FF, offset = offset)
fill(p1, p2, title = "Background", color=color.rgb(33, 150, 243, 95))
//----------------------------------------------------
exit=(close-strategy.position_avg_price / strategy.position_avg_price*100)
bull=( BV>SV and BV>Davgvol)
bull2=(BV>SV and BV>Davgvol)
bux =(close>Supper and close>Slower and volume<Davgvol)
bear=(SV>BV and SV>Davgvol)
con=(BV>Wavgvol and rsi>80)
imInATrade = strategy.position_size != 0
highestPriceAfterEntry = valuewhen(imInATrade, high, 0)
// STRATEGY LONG //
if (bull and close>upper1 and close>Supper and high>upper and rsi<80)
    strategy.entry("Long",strategy.long)

if (strategy.position_avg_price*1.02<close)
    strategy.close("Long")
else if (low<ma9 and strategy.position_avg_price<close)
    strategy.close("Long")
else if (ma20>close and strategy.position_avg_price<close )
    strategy.close("Long")
else if (rsi>80 and strategy.position_avg_price<close)
    strategy.close("Long")
else if (strategy.openprofit < strategy.position_avg_price*0.9-close)
    strategy.close("Long")
else if (high<upper and strategy.position_avg_price<close)
    strategy.close("Long")
//////////////////////////////////////////////////////////////////////////////////

//////////////////////////////////////////////////////////////////////////////////
strategy.entry("Short",strategy.short,when=low<ma20 and low<lower1 and close<Slower and crossunder(ma60,ma120))

if (close<strategy.position_avg_price*0.98)
    strategy.close("Short")

else if (rsi<20)
    strategy.close("Short")
Detail
https://www.fmz.com/strategy/441054
Last Modified
2024-02-05 10:53:46