Name
双均线交叉趋势追踪型策略Dual-Moving-Average-Crossover-Strategy
Author
ChaoZhang
Strategy Description
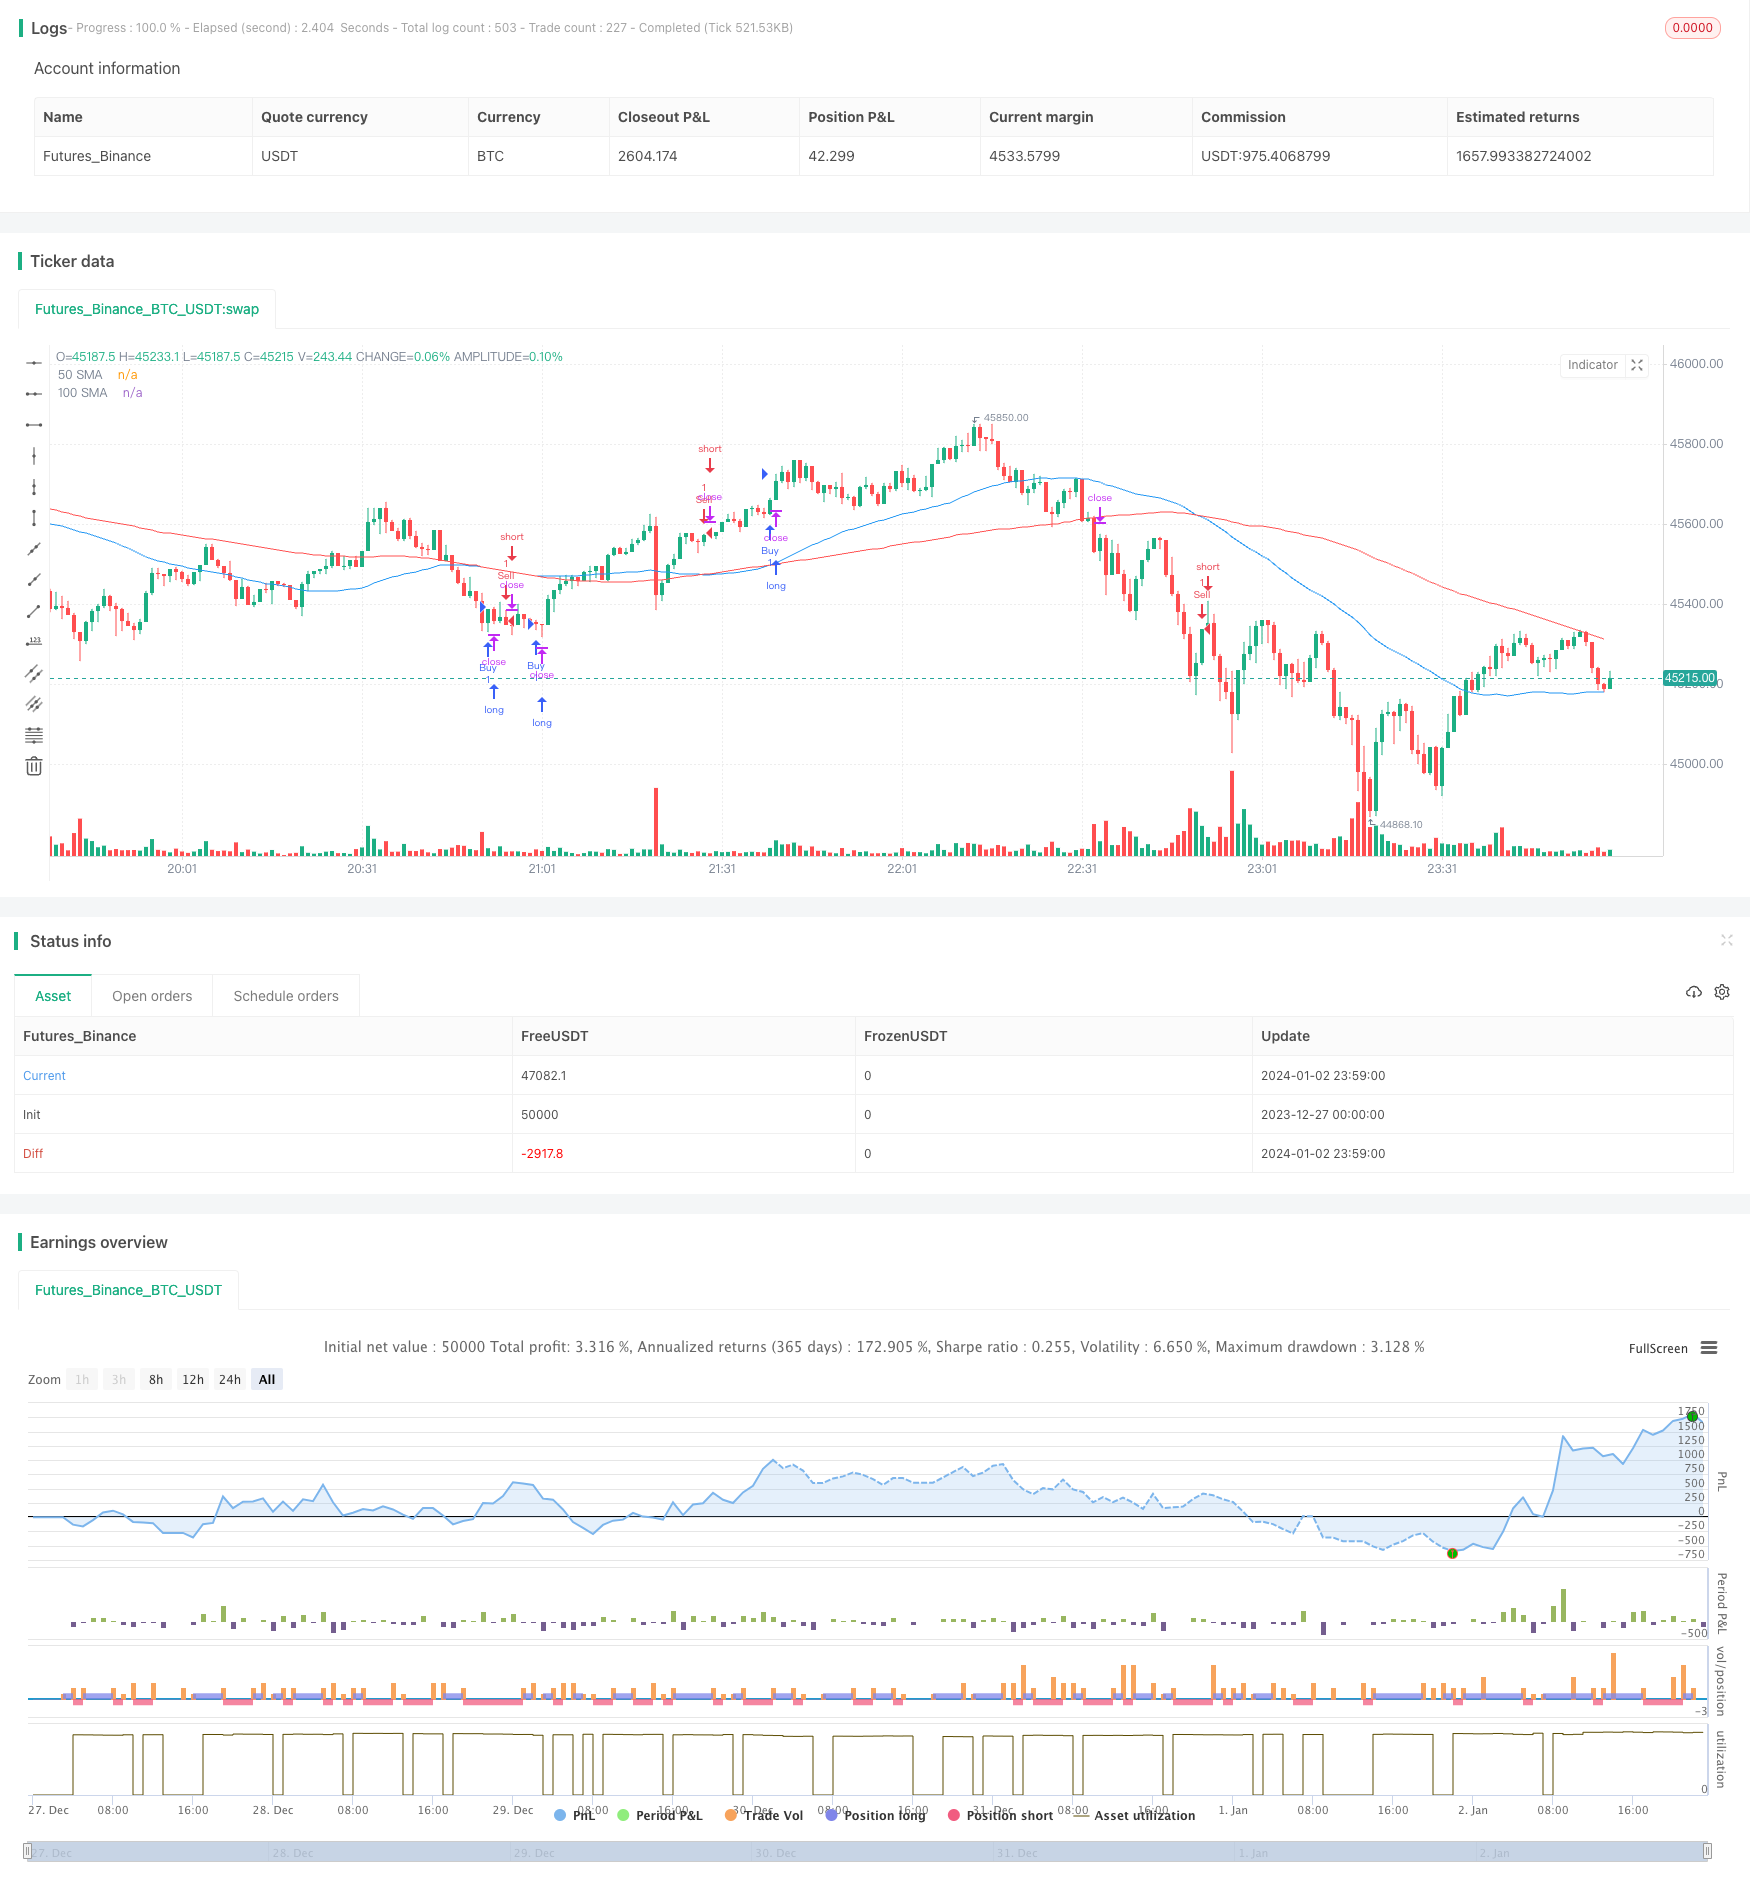
本策略运用简单均线交叉和平均真实波幅指标来产生买入和卖出信号,属于趋势追踪型策略。主要使用50日均线和100日均线的交叉来判断趋势,利用ATR指标设定止损点以控制风险。
- 计算50日简单移动平均线SMA1和100日简单移动平均线SMA2
- 当SMA1上穿SMA2时,发出买入信号;当SMA1下穿SMA2时,发出卖出信号
- 计算14日ATR指标
- ATR乘以设置的乘数作为止损点
- 当发出买入信号时,以收盘价减去止损点作为止损卖出点;当发出卖出信号时,以收盘价加上止损点作为止损买入点
可以看出,该策略主要依赖均线的趋势判断能力,以及ATR指标的风险控制能力。基本原理简单清晰,容易理解和实现。
- 原理清晰易于实现,适合初学者
- 利用均线判断主趋势,可有效跟踪趋势
- ATR止损可有效控制个别巨震带来的损失
- 可方便地调整参数,适应不同市场环境
- 在震荡行情中,均线产生大量假信号,容易错过反转点位
- ATR指标对快速变动的市场反应不够敏感,可能造成超出预期的损失
- 指标参数和ATR乘数的设置依赖经验,不当设置可能影响策略表现
- 双均线本身滞后性大,可能错过转折点
风险控制方法:
- 适当缩短均线周期,使指标更敏感
- 动态调整ATR乘数,让止损更灵活
- 结合其他指标过滤假信号
- 在大级别结构面判断的基础上操作
- 尝试其他类型的均线,如指数移动平均线能更好地滤波
- ATR可考虑用Keltner通道等动态止损方式替代
- 增加成交量等辅助指标过滤信号
- 结合波浪理论、支撑阻力位等确定趋势关键点
本策略属于典型的趋势跟踪策略,运用均线判断趋势方向,ATR设置止损来控制风险,原理简单清晰,易于掌握。但存在一定的滞后性与假信号风险,可通过参数调整、指标优化、结合更多因素等方法进行改进,使策略更适应多变的市场环境。总的来说,本策略适合初学者实践与优化,但实战时需要谨慎对待。
||
This strategy uses simple moving average crossovers and average true range indicator to generate buy and sell signals. It belongs to trend following strategies. It mainly uses 50-day and 100-day moving average crossovers to determine the trend and sets stop loss based on ATR to control risks.
- Calculate 50-day simple moving average SMA1 and 100-day simple moving average SMA2
- When SMA1 crosses over SMA2, a buy signal is generated. When SMA1 crosses below SMA2, a sell signal is generated.
- Calculate 14-day ATR
- ATR multiplied by a set factor is used as stop loss point
- When a buy signal is triggered, the closing price minus the stop loss point is the stop loss sell point. When a sell signal is triggered, the closing price plus the stop loss point is the stop loss buy point.
It can be seen that this strategy mainly relies on the trend judging capability of moving averages and the risk control capability of ATR. The logic is simple and easy to understand and implement.
- Simple logic easy to implement, suitable for beginners
- Moving averages can effectively track trends
- ATR stop loss can effectively control losses from individual black swan events
- Parameters can be easily adjusted for different market environments
- Many false signals may be triggered during range-bound markets, missing reversal points
- ATR may not react sensitively enough to fast changing markets, leading to larger than expected losses
- The parameter settings and ATR multiplier rely on experience. Improper settings may affect strategy performance
- The dual moving averages themselves have lagging effect, may miss turning points
Risk Management:
- Shorten moving average periods to make the indicator more sensitive
- Dynamically adjust ATR multiplier for more flexible stop loss
- Add other indicators to filter false signals
- Operate based on larger time frame structure judgments
- Try other types of moving averages, like EMAs that filter better
- Consider dynamic stop loss with Keltner Channels etc. to replace ATR
- Add supporting indicators like volume to filter signals
- Identify trend key points with concepts like Elliott Waves, support resistance etc.
This is a typical trend following strategy, using moving averages to determine trend direction and ATR stop loss to control risks. The logic is simple and easy to grasp. But it has certain lagging and false signal risks. Improvements can be made through parameter tuning, indicator optimization, incorporating more factors etc. to make the strategy more adaptive. Overall this strategy is suitable for beginner practice and optimization, but need to be careful when apply it in actual trading.
[/trans]
Strategy Arguments
| Argument | Default | Description |
|---|---|---|
| v_input_int_1 | 50 | 50 SMA Length |
| v_input_int_2 | 100 | 100 SMA Length |
| v_input_int_3 | 14 | ATR Length |
| v_input_int_4 | 4 | ATR Multiplier |
Source (PineScript)
/*backtest
start: 2023-12-27 00:00:00
end: 2024-01-03 00:00:00
period: 1m
basePeriod: 1m
exchanges: [{"eid":"Futures_Binance","currency":"BTC_USDT"}]
*/

//@version=5
strategy("SMA and ATR Strategy", overlay=true)

// Step 1. Define strategy settings
lengthSMA1 = input.int(50, title="50 SMA Length")
lengthSMA2 = input.int(100, title="100 SMA Length")
atrLength = input.int(14, title="ATR Length")
atrMultiplier = input.int(4, title="ATR Multiplier")

// Step 2. Calculate strategy values
sma1 = ta.sma(close, lengthSMA1)
sma2 = ta.sma(close, lengthSMA2)
atr = ta.atr(atrLength)

// Step 3. Output strategy data
plot(sma1, color=color.blue, title="50 SMA")
plot(sma2, color=color.red, title="100 SMA")

// Step 4. Determine trading conditions
longCondition = ta.crossover(sma1, sma2)
shortCondition = ta.crossunder(sma1, sma2)

longStopLoss = close - (atr * atrMultiplier)
shortStopLoss = close + (atr * atrMultiplier)

// Step 5. Execute trades based on conditions
if (longCondition)
    strategy.entry("Buy", strategy.long)
    strategy.exit("Sell", "Buy", stop=longStopLoss)

if (shortCondition)
    strategy.entry("Sell", strategy.short)
    strategy.exit("Buy", "Sell", stop=shortStopLoss)
Detail
https://www.fmz.com/strategy/437640
Last Modified
2024-01-04 15:03:14