Name
双均线压力回调策略Dual-Moving-Average-Pressure-Rebound-Strategy
Author
ChaoZhang
Strategy Description
双均线压力回调策略是一个非常简单的股票指数避险策略。它只进行多头交易,在长期趋势向上时,当价格接近压力位时建仓,避免在市场突破压力位大涨后才入场,从而锁定较优购买价位。
该策略同时使用长期200日移动平均线和短期10日移动平均线。只有当收盘价高于200日线即长期趋势向上时,才可以打开仓位。当收盘价低于10日线时,视为股票指数处于压力区域,这时如果RSI指标小于30,表明股价可能反弹,这时做多开仓。
一旦开仓后,设置5%的止损和10%的止盈退出交易。此外,如果价格突破10日线向上时,也主动止盈。
双均线压力回调策略最大的优势在于其趋势跟随能力强。通过采用长短双均线,它可以有效判断长期趋势的方向。当长期趋势向上时,才会考虑打开多头仓位。这可以避免盲目做多带来的风险。
其次,该策略的入场时机选择非常精准。它利用均线区间带来的压力,结合超买超卖指标判断,选取反弹的最优时机进场。这可以使得入场价位比较优越,有利于获得更大的盈利空间。
双均线压力回调策略的最大风险在于,它容易产生多次小幅止损。当价格在压力区域反复横跳时,就很容易不断触发止损。这种情况下会面临多次小额损失的风险。
另外,如果判断长期趋势错误,以至于进场后发生突破压力位大幅上涨的情况,这时止损可能较大,带来更大的风险。
为了控制风险,可以适当宽松止损幅度,增加持仓周期。同时也要慎重判断长期趋势,避免错误的多头仓位带来的风险。
该策略可以从以下几个方面进行优化:
-
增加更多因素判断长期趋势。除了单纯的移动平均线外,可以引入基本面因素、交易量变化等更多指标,对长期趋势做出更准确的判断。
-
优化入场时机选择。可以在突破压力位前,判断是否存在量能明显放大的特征,这有利于判断反弹的力度和Amplitude。
-
优化止盈方式。现有的止盈方式较为被动,无法持续截取涨幅。可以研究trail stop等更动态的止盈方式,在保证风险可控的前提下,获取更多涨幅。
-
优化仓位管理。可以根据大盘波动的幅度,实时调整仓位。这可以降低盈亏波动,获得更为稳定的收益曲线。
双均线压力回调策略是一个简单实用的避险策略。它可以有效跟踪长期趋势,选择优质的反弹时机开仓。通过止损和止盈来锁定收益,避免风险。该策略理论基础简单,适合大多数人使用,是一个不错的避险策略选择。
通过优化入场时机选择、动态止盈方式、与仓位管理等,该策略还具备很大的改进潜力,值得进一步研究。
||
The dual moving average pressure rebound strategy is a very simple hedge strategy for stock indices. It only conducts long positions. When the price approaches the pressure level during an uptrend, it opens positions to avoid entering the market after a major breakthrough of the pressure level and lock in a better purchase price.
The strategy uses both the long-term 200-day moving average and the short-term 10-day moving average. Positions can only be opened when the closing price is above the 200-day line, that is, the long-term trend is up. When the closing price is below the 10-day line, it means that the stock index is in a pressure zone. At this time, if the RSI indicator is less than 30, it indicates that stock prices may rebound. Then go long to open a position.
Once the position is opened, set a 5% stop loss and 10% take profit to exit the trade. In addition, if the price breaks through the 10-day line upwards, take profit proactively.
The biggest advantage of the dual moving average pressure rebound strategy is its strong trend-following capability. By adopting dual short and long moving averages, it can effectively judge the direction of the long-term trend. Long positions will only be considered when the long-term trend is up. This avoids the risks of blindly going long.
Secondly, the timing of entry this strategy chooses is very precise. It takes advantage of the pressure brought by the moving average zone and judges the overbought and oversold indicator to select the optimal timing for a rebound. This enables a relatively superior entry price and allows more room for profit.
The biggest risk of the dual moving average pressure rebound strategy is that it is prone to multiple small stop losses. When the price oscillates back and forth in the pressure zone, it is very likely to trigger stop loss repeatedly. In this case, there is a risk of multiple small losses.
In addition, if the long-term trend is incorrectly judged, which leads to a major break-out upon entry, the stop loss here may be larger, posing greater risks.
To control risks, properly loosening the stop loss range and increasing the holding period can be adopted. At the same time, the long-term trend must be judged prudently to avoid risks brought by incorrect long positions.
The strategy can be optimized in the following aspects:
-
Add more factors to judge the long-term trend. In addition to simple moving averages, more indicators such as fundamentals and trading volume changes can be introduced to make more accurate judgments on long-term trends.
-
Optimize entry timing. Judging whether there is a significant amplification of energy before breaking through the pressure level is beneficial for judging the intensity and amplitude of the rebound.
-
Optimize the take profit method. The existing take profit method is relatively passive and cannot continuously capture the increase. More dynamic take profit methods such as trail stops can be studied. While ensuring controllable risks, more gains can be obtained.
-
Optimize position management. The position size can be adjusted in real-time according to the fluctuation range of the broader market. This can reduce P&L fluctuations and achieve more stable returns.
The dual moving average pressure rebound strategy is a simple and practical hedging strategy. It can effectively track long-term trends and choose high-quality rebound timing to open positions. By setting stop loss and take profit to lock in profits, risks can be avoided. The theoretical basis of this strategy is simple and suitable for most people. It is a good hedging strategy.
There is still great potential for the strategy to be improved in aspects like optimizing entry timing, dynamic take profit methods and position management. It is worthwhile to investigate further.
[/trans]
Strategy Arguments
| Argument | Default | Description |
|---|---|---|
| v_input_int_1 | 200 | (?パラメータ)長期移動平均BASE200/period of long term sma |
| v_input_int_2 | 10 | 長期移動平均BASE10/period of short term sma |
| v_input_int_3 | 5 | 損切の割合%/stoploss percentages |
| v_input_int_4 | 20 | 利食いの割合%/take profit percentages |
| v_input_1 | timestamp(01 Jan 2000 13:30 +0000) | (?期間)バックテストを始める日/start trade day |
| v_input_2 | timestamp(1 Jan 2099 19:30 +0000) | バックテスを終わる日/finish date day |
Source (PineScript)
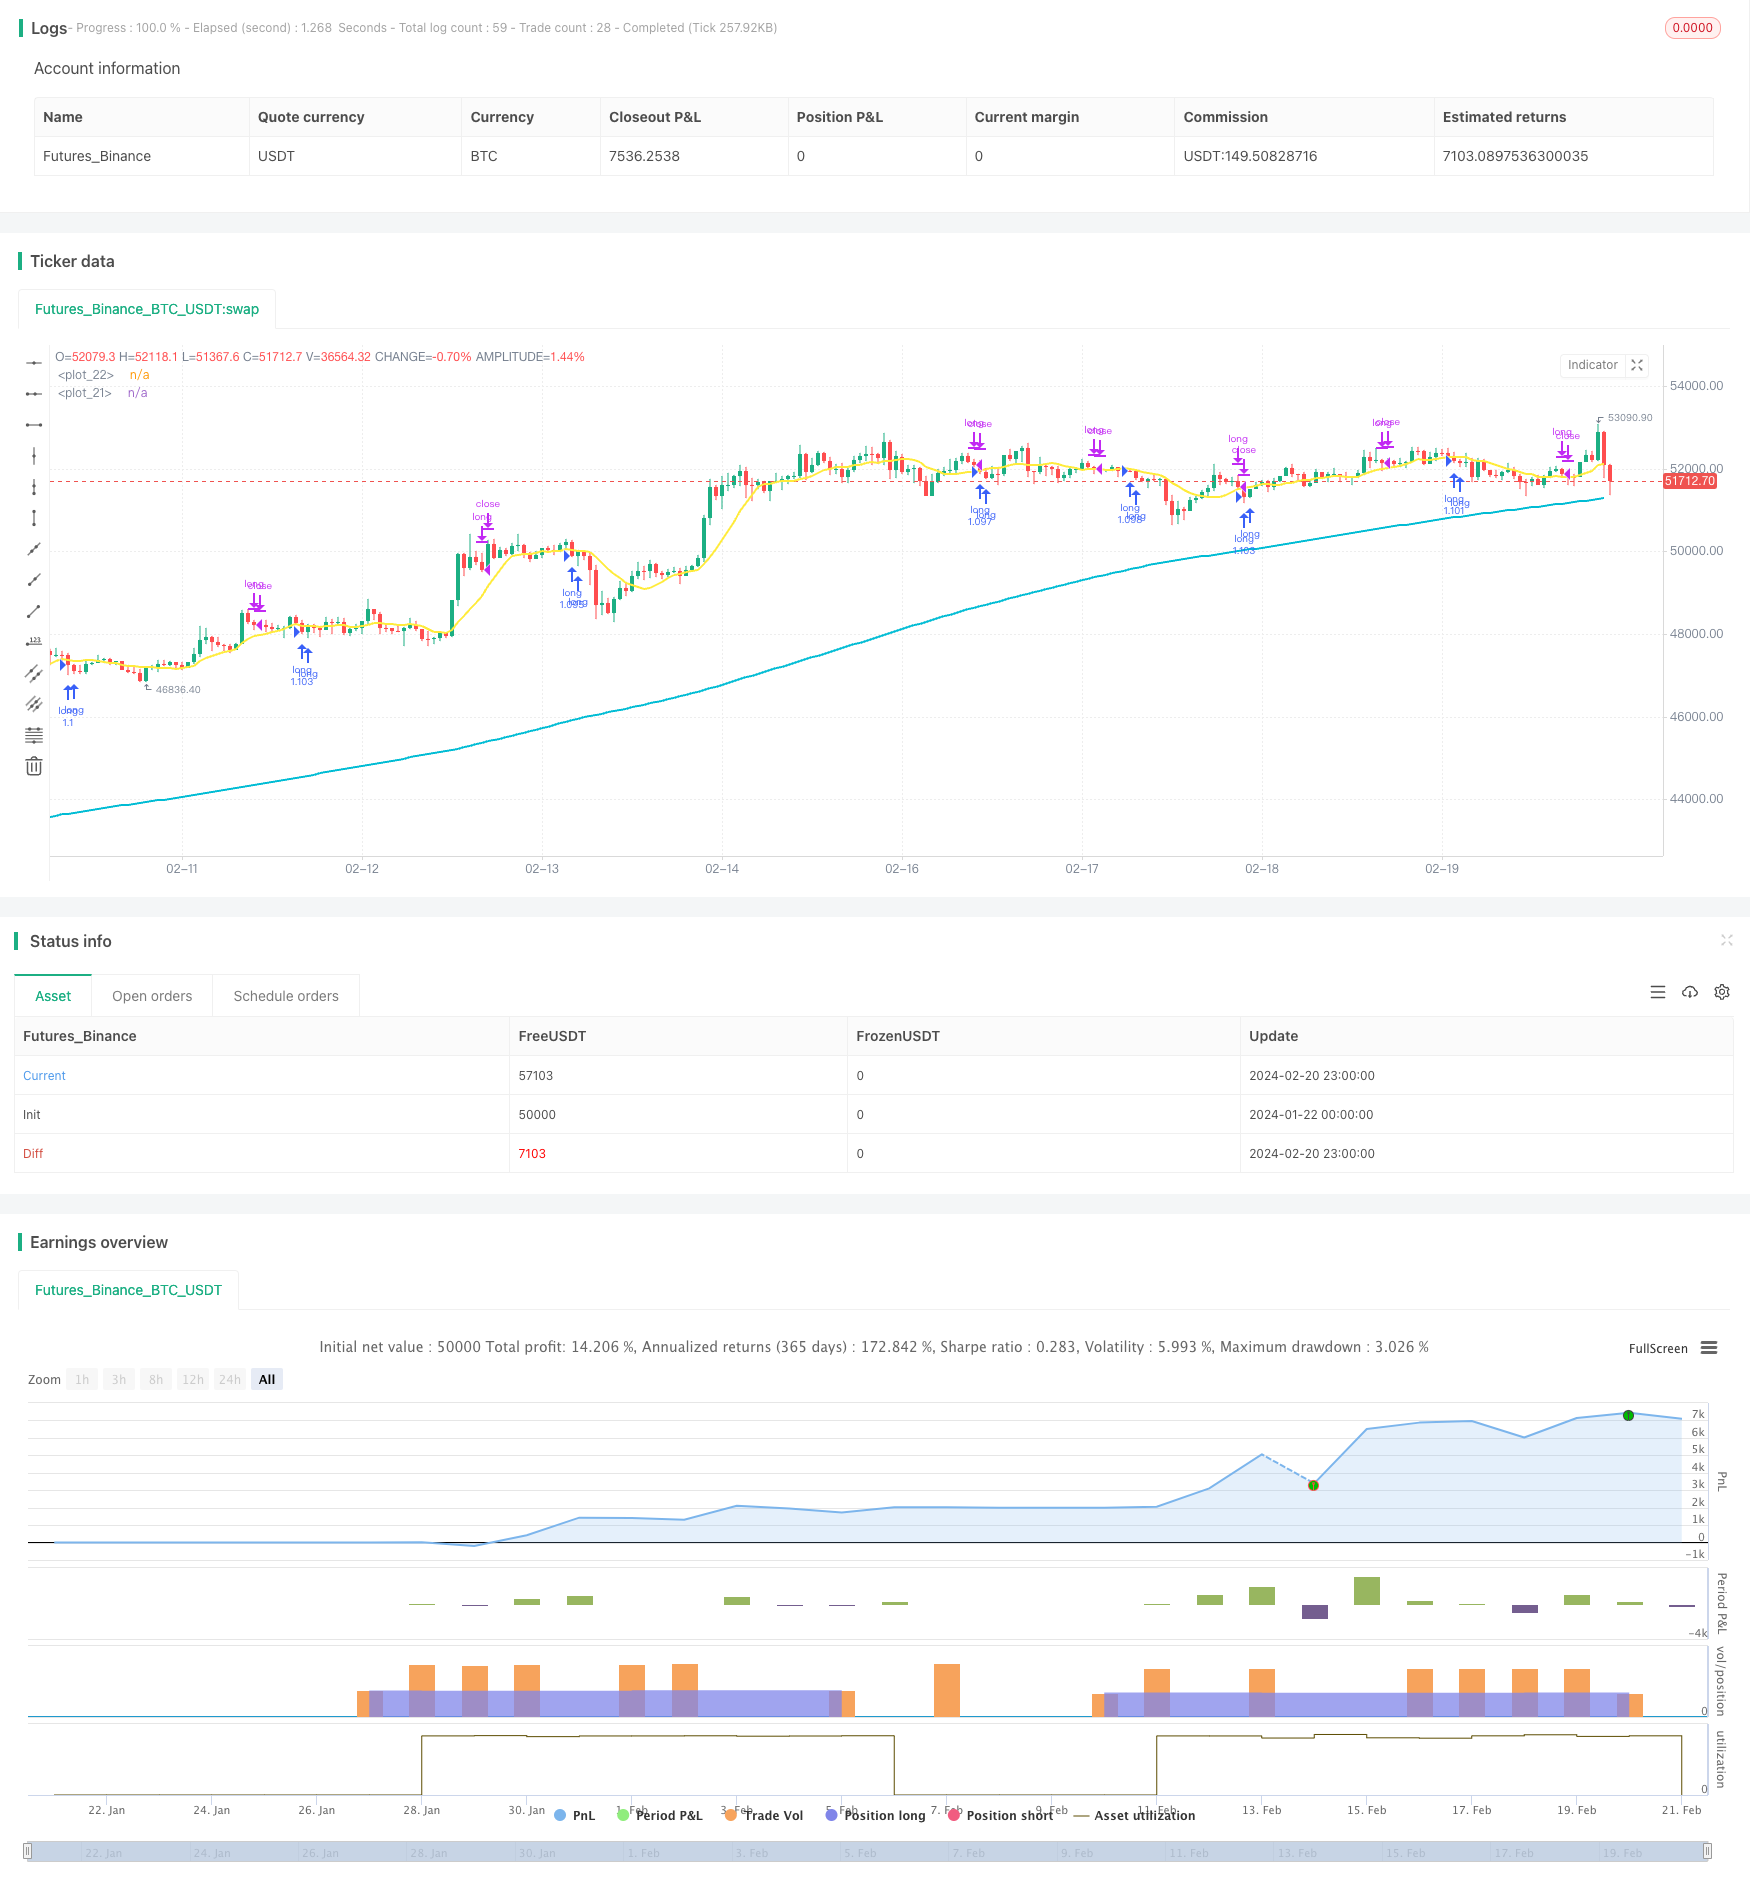
/*backtest
start: 2024-01-22 00:00:00
end: 2024-02-21 00:00:00
period: 1h
basePeriod: 15m
exchanges: [{"eid":"Futures_Binance","currency":"BTC_USDT"}]
*/

// This source code is subject to the terms of the Mozilla Public License 2.0 at https://mozilla.org/MPL/2.0/
// © tsujimoto0403

//@version=5
strategy("simple pull back", overlay=true,default_qty_type=strategy.percent_of_equity,
     default_qty_value=100)

//input value
malongperiod=input.int(200,"長期移動平均BASE200/period of long term sma",group = "パラメータ")
mashortperiod=input.int(10,"長期移動平均BASE10/period of short term sma",group = "パラメータ")
stoprate=input.int(5,title = "損切の割合%/stoploss percentages",group = "パラメータ")
profit=input.int(20,title = "利食いの割合%/take profit percentages",group = "パラメータ")
startday=input(title="バックテストを始める日/start trade day", defval=timestamp("01 Jan 2000 13:30 +0000"), group="期間")
endday=input(title="バックテスを終わる日/finish date day", defval=timestamp("1 Jan 2099 19:30 +0000"), group="期間")


//polt indicators that we use
malong=ta.sma(close,malongperiod)
mashort=ta.sma(close,mashortperiod)

plot(malong,color=color.aqua,linewidth = 2)
plot(mashort,color=color.yellow,linewidth = 2)

//date range
datefilter = true

//open conditions
if close>malong and close<mashort and strategy.position_size == 0 and datefilter and ta.rsi(close,3)<30
    strategy.entry(id="long", direction=strategy.long)

//sell conditions
strategy.exit(id="cut",from_entry="long",stop=(1-0.01*stoprate)*strategy.position_avg_price,limit=(1+0.01*profit)*strategy.position_avg_price)


if close>mashort and close<low[1] and strategy.position_size>0
    strategy.close(id ="long")
Detail
https://www.fmz.com/strategy/442514
Last Modified
2024-02-22 15:29:04