Name
双均线叠加RSI指标的量化交易策略Stochastic-Overlap-with-RSI-Index-Quant-Trading-Strategy
Author
ChaoZhang
Strategy Description
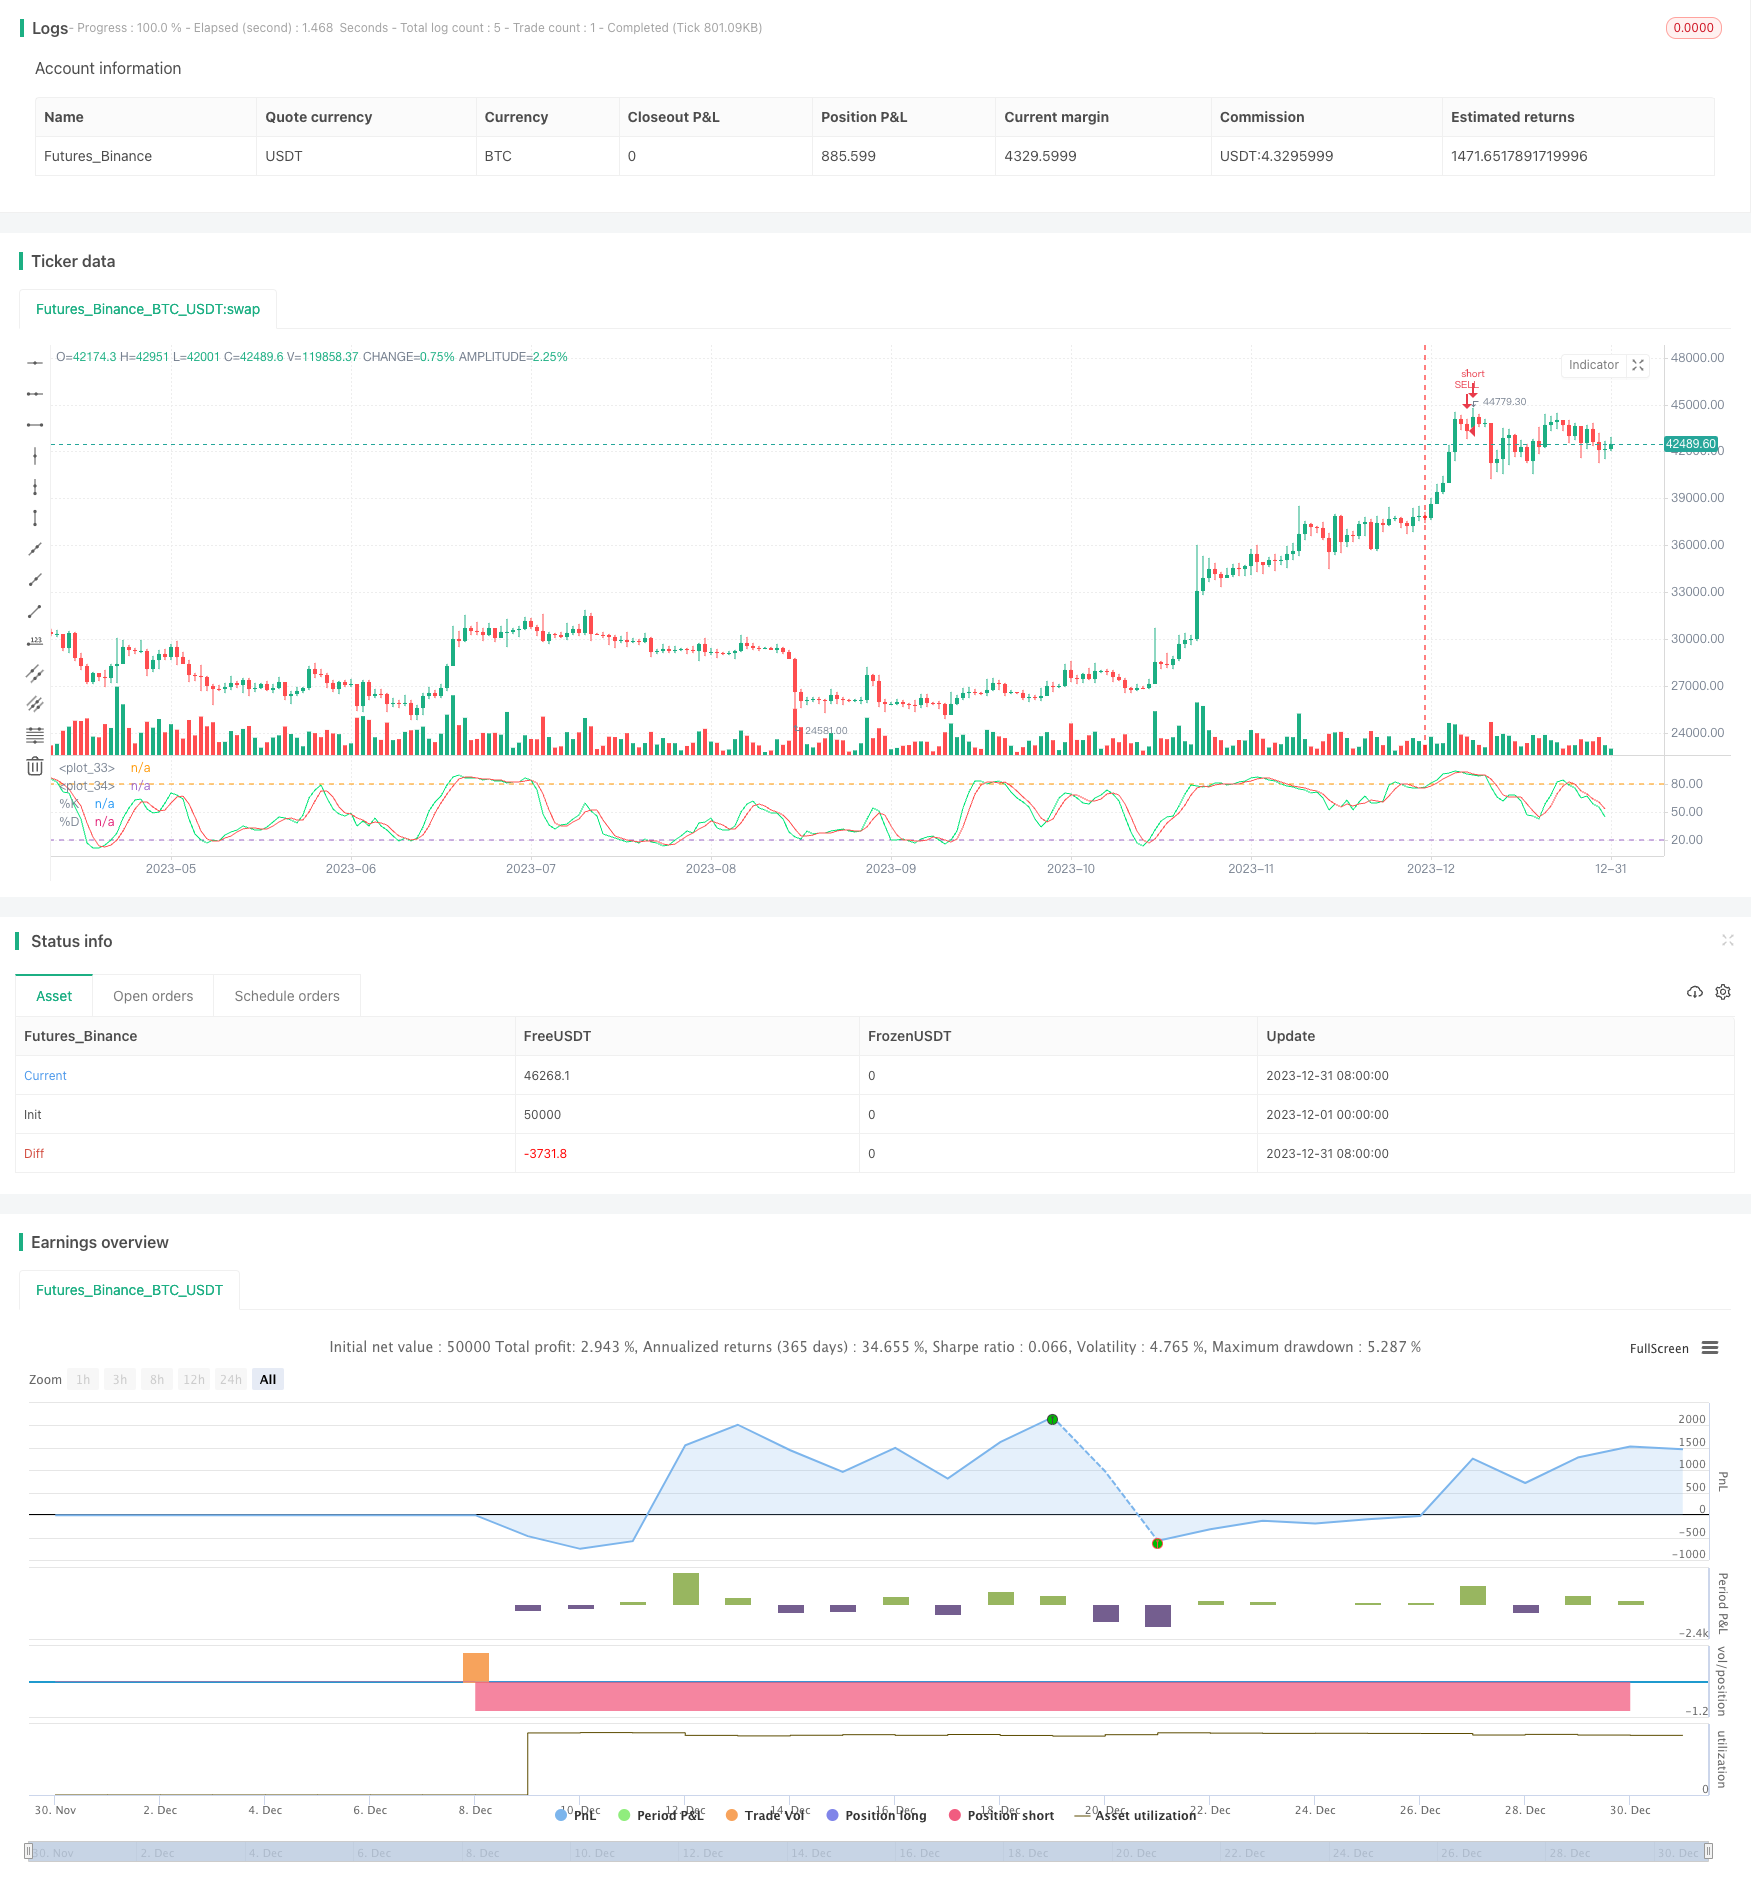
本策略名称为“双均线叠加RSI指标的量化交易策略”。该策略通过计算股票的双均线指标与RSI指标的叠加来识别股票的超买超卖情况,在股票被低估时建立多头头寸,被高估时建立空头头寸,实现对冲套利。
双均线叠加RSI指标的量化交易策略通过计算%K线与%D线的交叉情况判断超买超卖。其中,%K线计算为该股票收盘价的K天简单移动平均值,%D线则计算%K线的D天简单移动平均值。当%K线从下方上穿%D线时,认为股票被低估,应建立多头头寸;当%K线从上方下穿%D线时,认为股票被高估,应建立空头头寸。
同时,该策略还结合RSI指标判断股票的超买超卖情况。RSI指标反映该股票的涨跌速度变化,当RSI低于50%时表示股票被低估,高于60%时表示股票被高估。
综合双均线指标与RSI指标,当%K线从下方上穿%D线且RSI低于50%时,判定股票被严重低估,应建立多头头寸;当%K线从上方下穿%D线且RSI高于60%时,判定股票被严重高估,应建立空头头寸。
- 结合双均线指标与RSI指标判断超买超卖,避免单一指标判断的错误率
- 可灵活配置均线参数与RSI参数,适应不同股票的特征
- 实时监控股票涨跌速度变化,及时调整仓位
- 可配置仅做多或仅做空,降低操作风险
- 双均线与RSI指标存在一定滞后,可能错过最佳开仓时机
- 需要对股票特征有深入研究,参数设置不当可能导致交易频繁或无法开仓
- 需配置止损策略,防止亏损扩大
风险解决方法:
- 结合其他指标避免价格跳空造成的损失
- 增加回测周期和样本量,测试参数设置的稳定性
- 设定止损位,加大仓位等方法控制风险
- 结合交易量指标避免虚假突破
- 增加开仓条件,避免频繁交易造成交易费用过高
- 优化仓位控制模型,在高确信度下加大仓位
需要增加交易量指标与其他指标结合判断,确保突破信号的可靠性,避免虚假信号带来损失。同时,优化仓位控制模型,在高确信度下适当加大仓位可以获得更高收益。
双均线叠加RSI指标的量化交易策略通过双均线指标和RSI指标的叠加使用判断股票的超买超卖情况,在股票被低估时做多,被高估时做空,实现对冲套利。该策略充分利用了双均线指标的价格捕捉能力与RSI指标的超买超卖判断能力,避免了单一指标判断的限制。通过灵活参数配置,可以适用于不同股票;并可进一步优化,在控制风险的前提下获得更高收益。
||
The name of this strategy is “Stochastic Overlap with RSI Index Quant Trading Strategy”. This strategy identifies overbought and oversold situations of stocks by calculating the overlap of stochastic double moving average indicators and RSI indicators, establishes long positions when the stock is undervalued, and establishes short positions when overvalued to achieve hedging arbitrage.
The stochastic overlap with RSI index quant trading strategy judges overbought and oversold through calculating the crossover situation between %K line and %D line. Among them, the %K line is calculated as the K-day simple moving average of the closing price of the stock, and the %D line calculates the D-day simple moving average of the %K line. When the %K line crosses above the %D line from the bottom, it is considered that the stock is underestimated and a long position should be established; When the %K line crosses below the %D line from the top, it is considered that the stock is overvalued and a short position should be established.
At the same time, this strategy also combines the RSI indicator to judge the overbought and oversold conditions of stocks. The RSI indicator reflects the change in the rate of rise and fall of the stock. When the RSI is lower than 50%, it means that the stock is underestimated. When it is higher than 60%, it means that the stock is overvalued.
Combining the double moving average indicator and the RSI indicator, when the %K line crosses above the %D line from below and the RSI is less than 50%, it is determined that the stock is seriously underestimated, and a long position should be established; When the %K line crosses below the %D line from above and the RSI is higher than 60%, it is determined that the stock is seriously overvalued, and a short position should be established.
- Combining double moving average indicators and RSI indicators to judge overbought and oversold avoids the error rate of single indicator judgment
- Flexible configuration of moving average parameters and RSI parameters to adapt to different stock characteristics
- Real-time monitoring of changes in the rate of rise and fall of stocks and timely adjustment of positions
- Can be configured for long only or short only to reduce operational risk
- There is a certain lag in the double moving average and RSI indicators, which may miss the best opening time
- In-depth research on stock characteristics is required. Improper parameter settings may lead to frequent transactions or inability to open positions
- Stop loss strategies need to be configured to prevent losses from expanding
Risk Mitigation Methods:
- Combine other indicators to avoid losses caused by price gaps
- Increase backtesting cycle and sample size to test stability of parameter settings
- Set stop loss points, increase positions and other methods to control risks
- Combine trading volume indicators to avoid false breakouts
- Increase opening conditions to avoid excessive transaction fees due to frequent transactions
- Optimize position control model to increase positions under high confidence
Need to increase trading volume indicators and combine with other indicators to ensure reliability of breakthrough signals and avoid losses caused by false signals. At the same time, optimize the position control model to appropriately increase positions under high confidence to obtain higher returns.
The stochastic overlap with RSI index quant trading strategy judges the overbought and oversold conditions of stocks through the overlay use of double moving average indicators and RSI indicators, goes long when the stock is underestimated, goes short when overvalued, and achieves hedging arbitrage. This strategy makes full use of the price capturing capability of double moving average indicators and the overbought and oversold judgment capability of RSI indicators, avoiding the limitations of single indicator judgments. Through flexible parameter configuration, it can be applied to different stocks; And can be further optimized to obtain higher returns while controlling risks.
[/trans]
Strategy Arguments
| Argument | Default | Description |
|---|---|---|
| v_input_1 | true | Start Date |
| v_input_2 | true | Start Month |
| v_input_3 | 2014 | Start Year |
| v_input_4 | 14 | K |
| v_input_5 | 3 | D |
| v_input_6 | 3 | Smooth |
Source (PineScript)
/*backtest
start: 2023-12-01 00:00:00
end: 2023-12-31 23:59:59
period: 1d
basePeriod: 1h
exchanges: [{"eid":"Futures_Binance","currency":"BTC_USDT"}]
*/

//@version=2
strategy(title="Easy to Use Stochastic + RSI Strategy", overlay=false)


//// Only Enter Long Positions /////
// strategy.risk.allow_entry_in(strategy.direction.long)


///// Backtest Start Date /////
startDate   = input(title="Start Date",   defval=1,    minval=1,    maxval=31)
startMonth  = input(title="Start Month",  defval=1,    minval=1,    maxval=12)
startYear   = input(title="Start Year",   defval=2014, minval=1800, maxval=2100)

afterStartDate = true


///// Create inputs /////
// Stochastics //
periodK = input(14, title="K", minval=1)
periodD = input(3, title="D", minval=1)
smoothK = input(3, title="Smooth", minval=1)

k = sma(stoch(close, high, low, periodK), smoothK)
d = sma(k, periodD)

// RSI Values //
rsivalue = rsi(close, 14)


///// Plot Stochastic Values and Lines /////
plot(k, title="%K", color=lime)
plot(d, title="%D", color=red)
h0 = hline(80)
h1 = hline(20)
fill(h0, h1, color=purple, transp=80)


///// Submit orders /////
if (afterStartDate and crossover(k, d) and k<20 and rsivalue<50)
    strategy.entry(id="BUY", long=true)
if (afterStartDate and crossunder(k, d) and k>80 and rsivalue>60)
    strategy.entry(id="SELL", long=false)
Detail
https://www.fmz.com/strategy/438482
Last Modified
2024-01-12 13:57:36