Name
双均线策略与随机指标组合Dual-Moving-Average-Strategy-Combined-with-Stochastic-Indicator
Author
ChaoZhang
Strategy Description
本文介绍了一个组合使用双均线策略和随机指标的量化交易策略。该策略综合利用了移动均线的趋势跟踪能力和随机指标的超买超卖特征,形成交易信号。
该策略由两部分组成:
-
双均线策略
使用快速移动均线和慢速移动均线形成金叉买入信号和死叉卖出信号。快速均线能更快捕捉价格变化趋势,慢速均线滤波假信号。
-
随机指标
利用随机指标的震荡特性识别超买超卖情况。当随机指标高于慢线时为超买信号,随机指标低于慢线时为超卖信号。
两部分信号综合后形成最终交易信号。双均线策略追踪主要趋势,随机指标辅助避免不利行情。
- 综合双均线和随机指标的优点,更稳定。
- 均线趋势跟踪,随机指标确认,效果好。
- 可自定义参数,适应不同市场行情。
- 双均线容易产生误信号。
- 随机指标参数设置不当可能错过趋势。
- 需要调整参数以适应行情变化。
可通过优化参数组合来降低风险,也可加入止损来控制亏损。
该策略可从以下方面进行优化:
- 测试不同均线参数对策略效果的影响。
- 测试不同随机指标参数对策略稳定性的影响。
- 加入趋势过滤指标提高策略胜率。
- 建立动态追踪止损机制来控制亏损。
本策略综合运用双均线策略和随机指标优势。在追踪市场主要趋势的同时避免不利行情的反转。可通过参数组合优化获得更好的策略效果。加入止损和趋势过滤可使策略更完善。
||
This article introduces a quantitative trading strategy that combines the dual moving average strategy and stochastic indicator. The strategy utilizes the trend following capability of moving averages and the overbought-oversold characteristic of stochastic to generate trading signals.
The strategy consists of two parts:
-
Dual Moving Average Strategy
Using fast and slow moving averages to generate golden cross buy signals and dead cross sell signals. The fast moving average can capture price trend changes faster, while the slow one filters out fake signals.
-
Stochastic Indicator
Utilizing the oscillation feature of stochastic to identify overbought and oversold situations. A stochastic higher than the slow line indicates an overbought signal, while a stochastic lower than the slow line indicates an oversold signal.
The signals from both parts are combined to form the final trading signals. The dual moving average strategy tracks the main trend, while stochastic assists in avoiding unfavorable market conditions.
- Combines the advantages of dual moving averages and stochastic, more stable.
- Moving averages for trend following, stochastic for confirmation, good effect.
- Customizable parameters adapt to different market conditions.
- Dual moving averages can easily generate false signals.
- Improper stochastic parameter settings may miss trends.
- Need to adjust parameters to adapt to market changes.
Risks can be reduced by optimizing parameter combinations and adding stop loss to control losses.
The strategy can be optimized in the following aspects:
- Test the effects of different moving average parameters on the strategy.
- Test the effects of different stochastic parameters on the stability of the strategy.
- Add trend filtering indicators to improve win rate.
- Build a dynamic trailing stop loss mechanism to control losses.
This strategy combines the advantages of dual moving averages and stochastic. While tracking the main market trend, it avoids unfavorable reversals. Better strategy results can be obtained through parameter optimization. Adding stops and trend filters can make the strategy more robust.
[/trans]
Strategy Arguments
| Argument | Default | Description |
|---|---|---|
| v_input_1 | 14 | Length |
| v_input_2 | true | KSmoothing |
| v_input_3 | 3 | DLength |
| v_input_4 | 50 | Level |
| v_input_5 | 14 | Length_HLB |
| v_input_6 | true | PercentShift |
| v_input_7 | false | Trade reverse |
Source (PineScript)
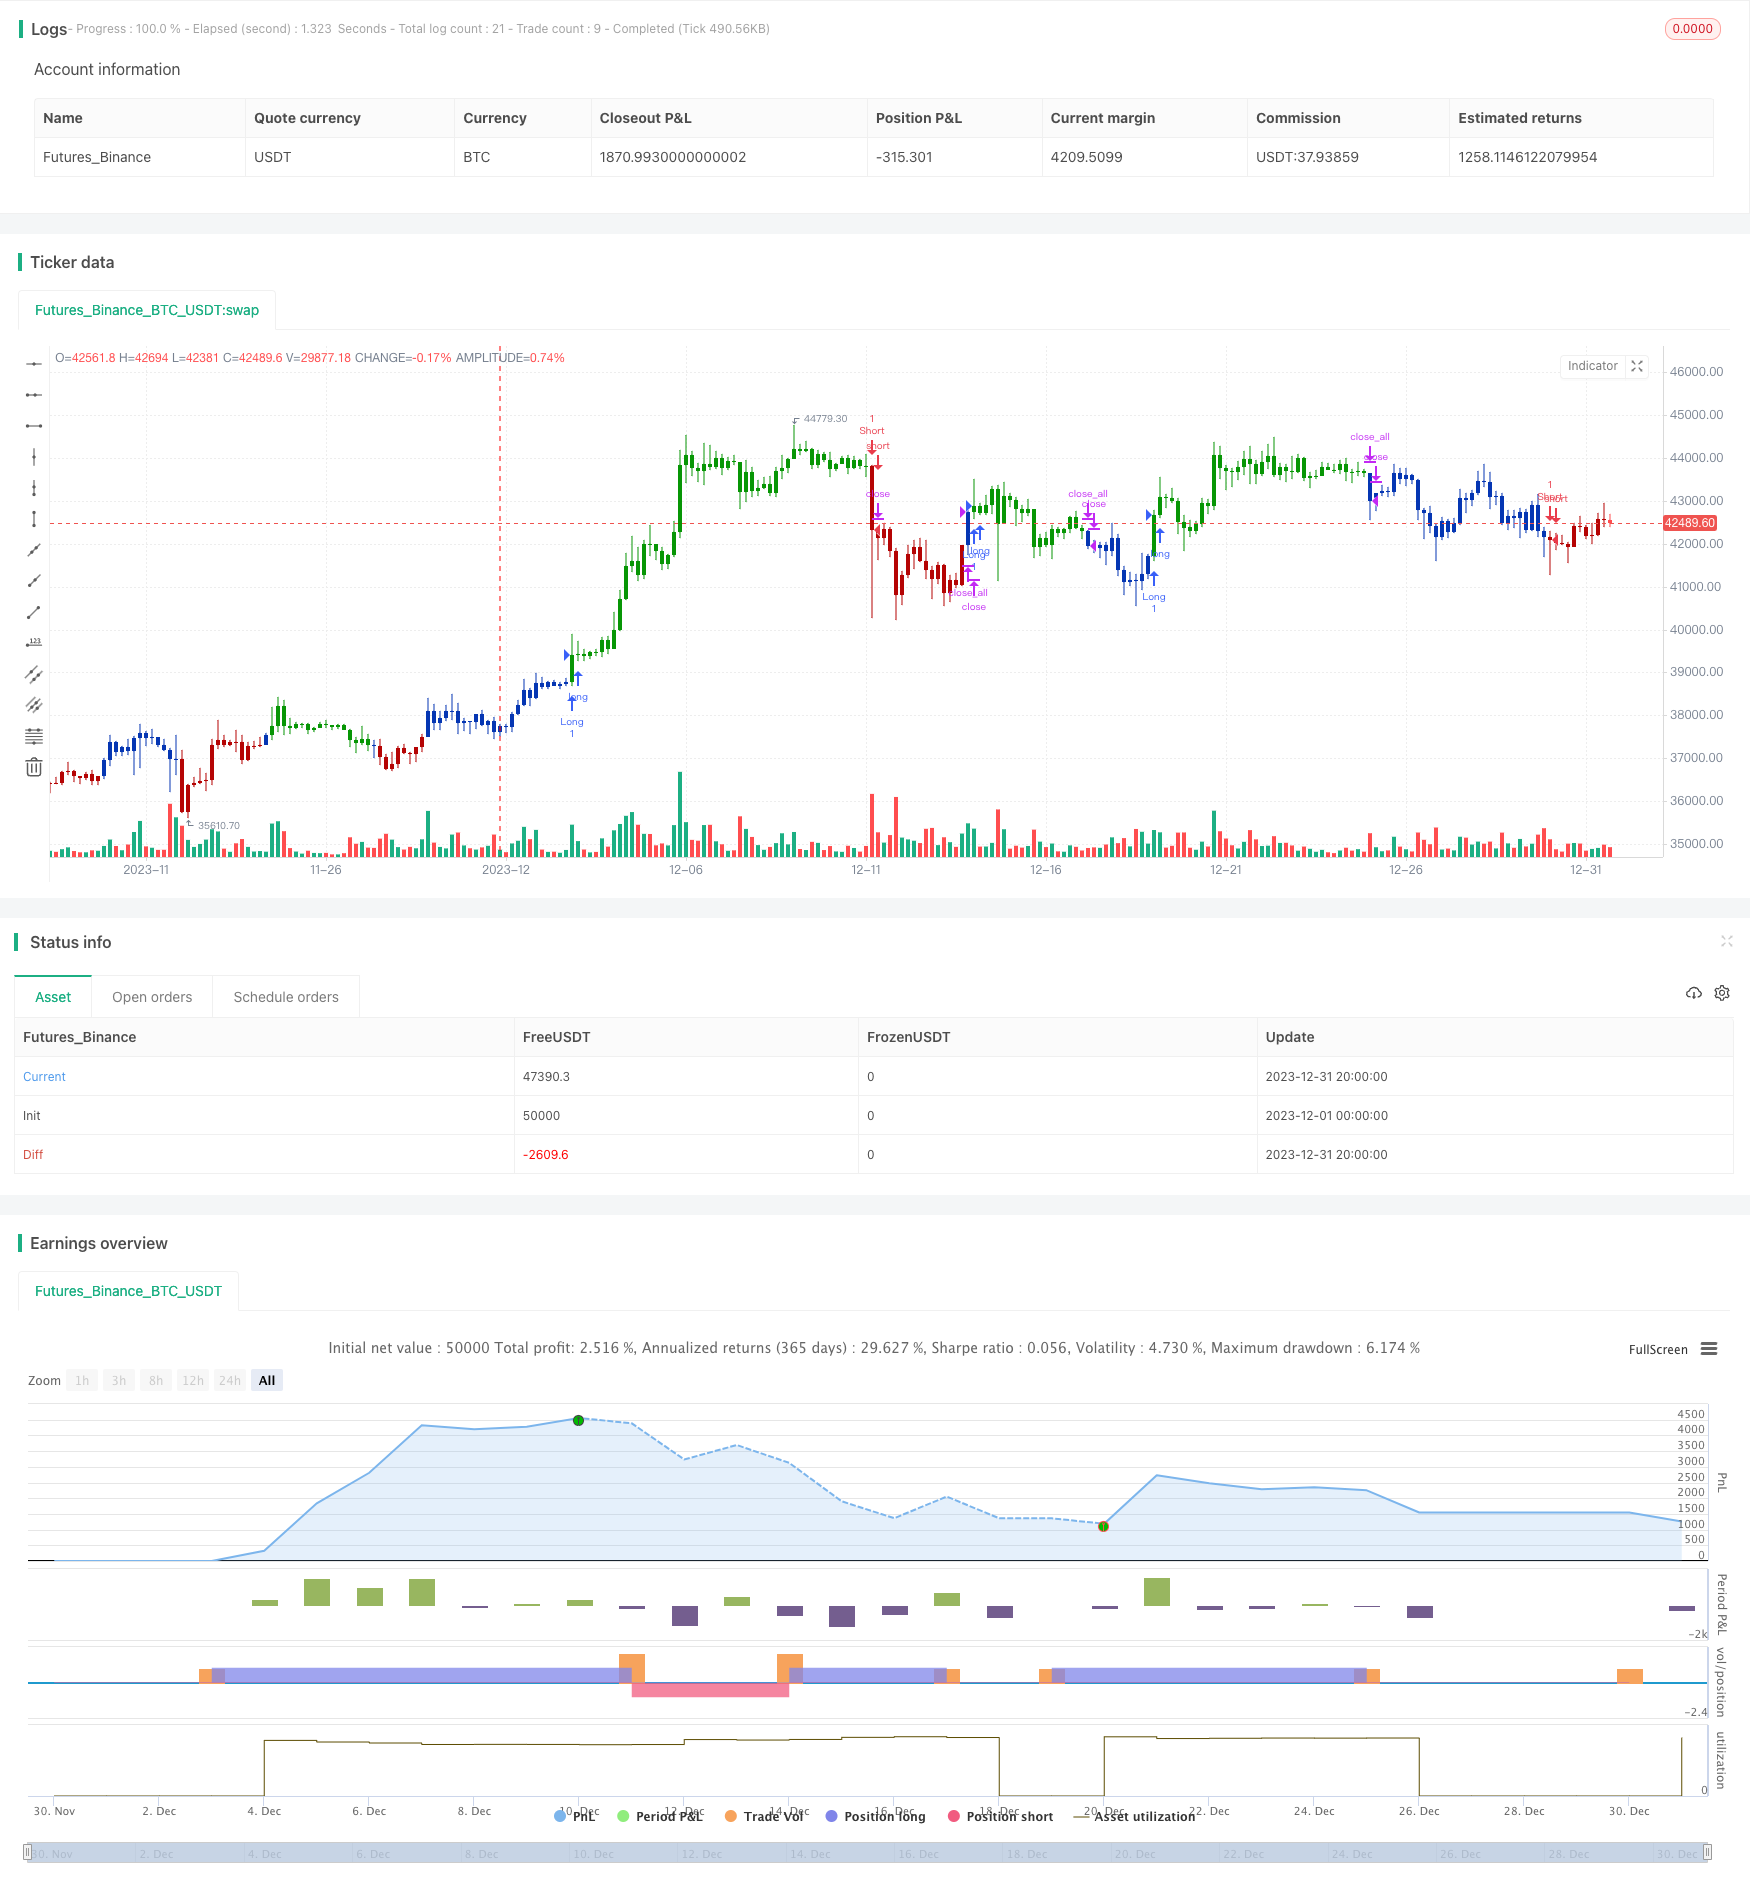
/*backtest
start: 2023-12-01 00:00:00
end: 2023-12-31 23:59:59
period: 4h
basePeriod: 15m
exchanges: [{"eid":"Futures_Binance","currency":"BTC_USDT"}]
*/

//@version=4
////////////////////////////////////////////////////////////
//  Copyright by HPotter v1.0 24/11/2020
// This is combo strategies for get a cumulative signal.
//
// First strategy
// This System was created from the Book "How I Tripled My Money In The
// Futures Market" by Ulf Jensen, Page 183. This is reverse type of strategies.
// The strategy buys at market, if close price is higher than the previous close
// during 2 days and the meaning of 9-days Stochastic Slow Oscillator is lower than 50.
// The strategy sells at market, if close price is lower than the previous close price
// during 2 days and the meaning of 9-days Stochastic Fast Oscillator is higher than 50.
//
// Second strategy
// As the name suggests, High low bands are two bands surrounding the underlying’s
// price. These bands are generated from the triangular moving averages calculated
// from the underlying’s price. The triangular moving average is, in turn, shifted
// up and down by a fixed percentage. The bands, thus formed, are termed as High
// low bands. The main theme and concept of High low bands is based upon the triangular
// moving average.
//
// WARNING:
// - For purpose educate only
// - This script to change bars colors.
////////////////////////////////////////////////////////////
Reversal123(Length, KSmoothing, DLength, Level) =>
    vFast = sma(stoch(close, high, low, Length), KSmoothing)
    vSlow = sma(vFast, DLength)
    pos = 0.0
    pos := iff(close[2] < close[1] and close > close[1] and vFast < vSlow and vFast > Level, 1,
	         iff(close[2] > close[1] and close < close[1] and vFast > vSlow and vFast < Level, -1, nz(pos[1], 0)))
	pos


HLB(Length, PercentShift) =>
    pos = 0.0
    xTMA = sma(sma(close, Length), Length)
    xHighBand = xTMA + (xTMA * PercentShift / 100)
    xLowBand = xTMA - (xTMA * PercentShift / 100)
    pos :=iff(close > xHighBand, 1,
           iff(close <xLowBand, -1, nz(pos[1], 0)))
    pos

strategy(title="Combo Backtest 123 Reversal & High Low Bands", shorttitle="Combo", overlay = true)
Length = input(14, minval=1)
KSmoothing = input(1, minval=1)
DLength = input(3, minval=1)
Level = input(50, minval=1)
//-------------------------
Length_HLB = input(14, minval=1)
PercentShift = input(1, minval = 0.01, step = 0.01)
reverse = input(false, title="Trade reverse")
posReversal123 = Reversal123(Length, KSmoothing, DLength, Level)
posHLB = HLB(Length_HLB, PercentShift)
pos = iff(posReversal123 == 1 and posHLB == 1 , 1,
	   iff(posReversal123 == -1 and posHLB == -1, -1, 0))
possig = iff(reverse and pos == 1, -1,
          iff(reverse and pos == -1 , 1, pos))
if (possig == 1)
    strategy.entry("Long", strategy.long)
if (possig == -1)
    strategy.entry("Short", strategy.short)
if (possig == 0)
    strategy.close_all()
barcolor(possig == -1 ? #b50404: possig == 1 ? #079605 : #0536b3 )
Detail
https://www.fmz.com/strategy/438457
Last Modified
2024-01-12 11:16:52