Name
双波动带截断策略Double-Bollinger-Band-Breakout-Strategy
Author
ChaoZhang
Strategy Description
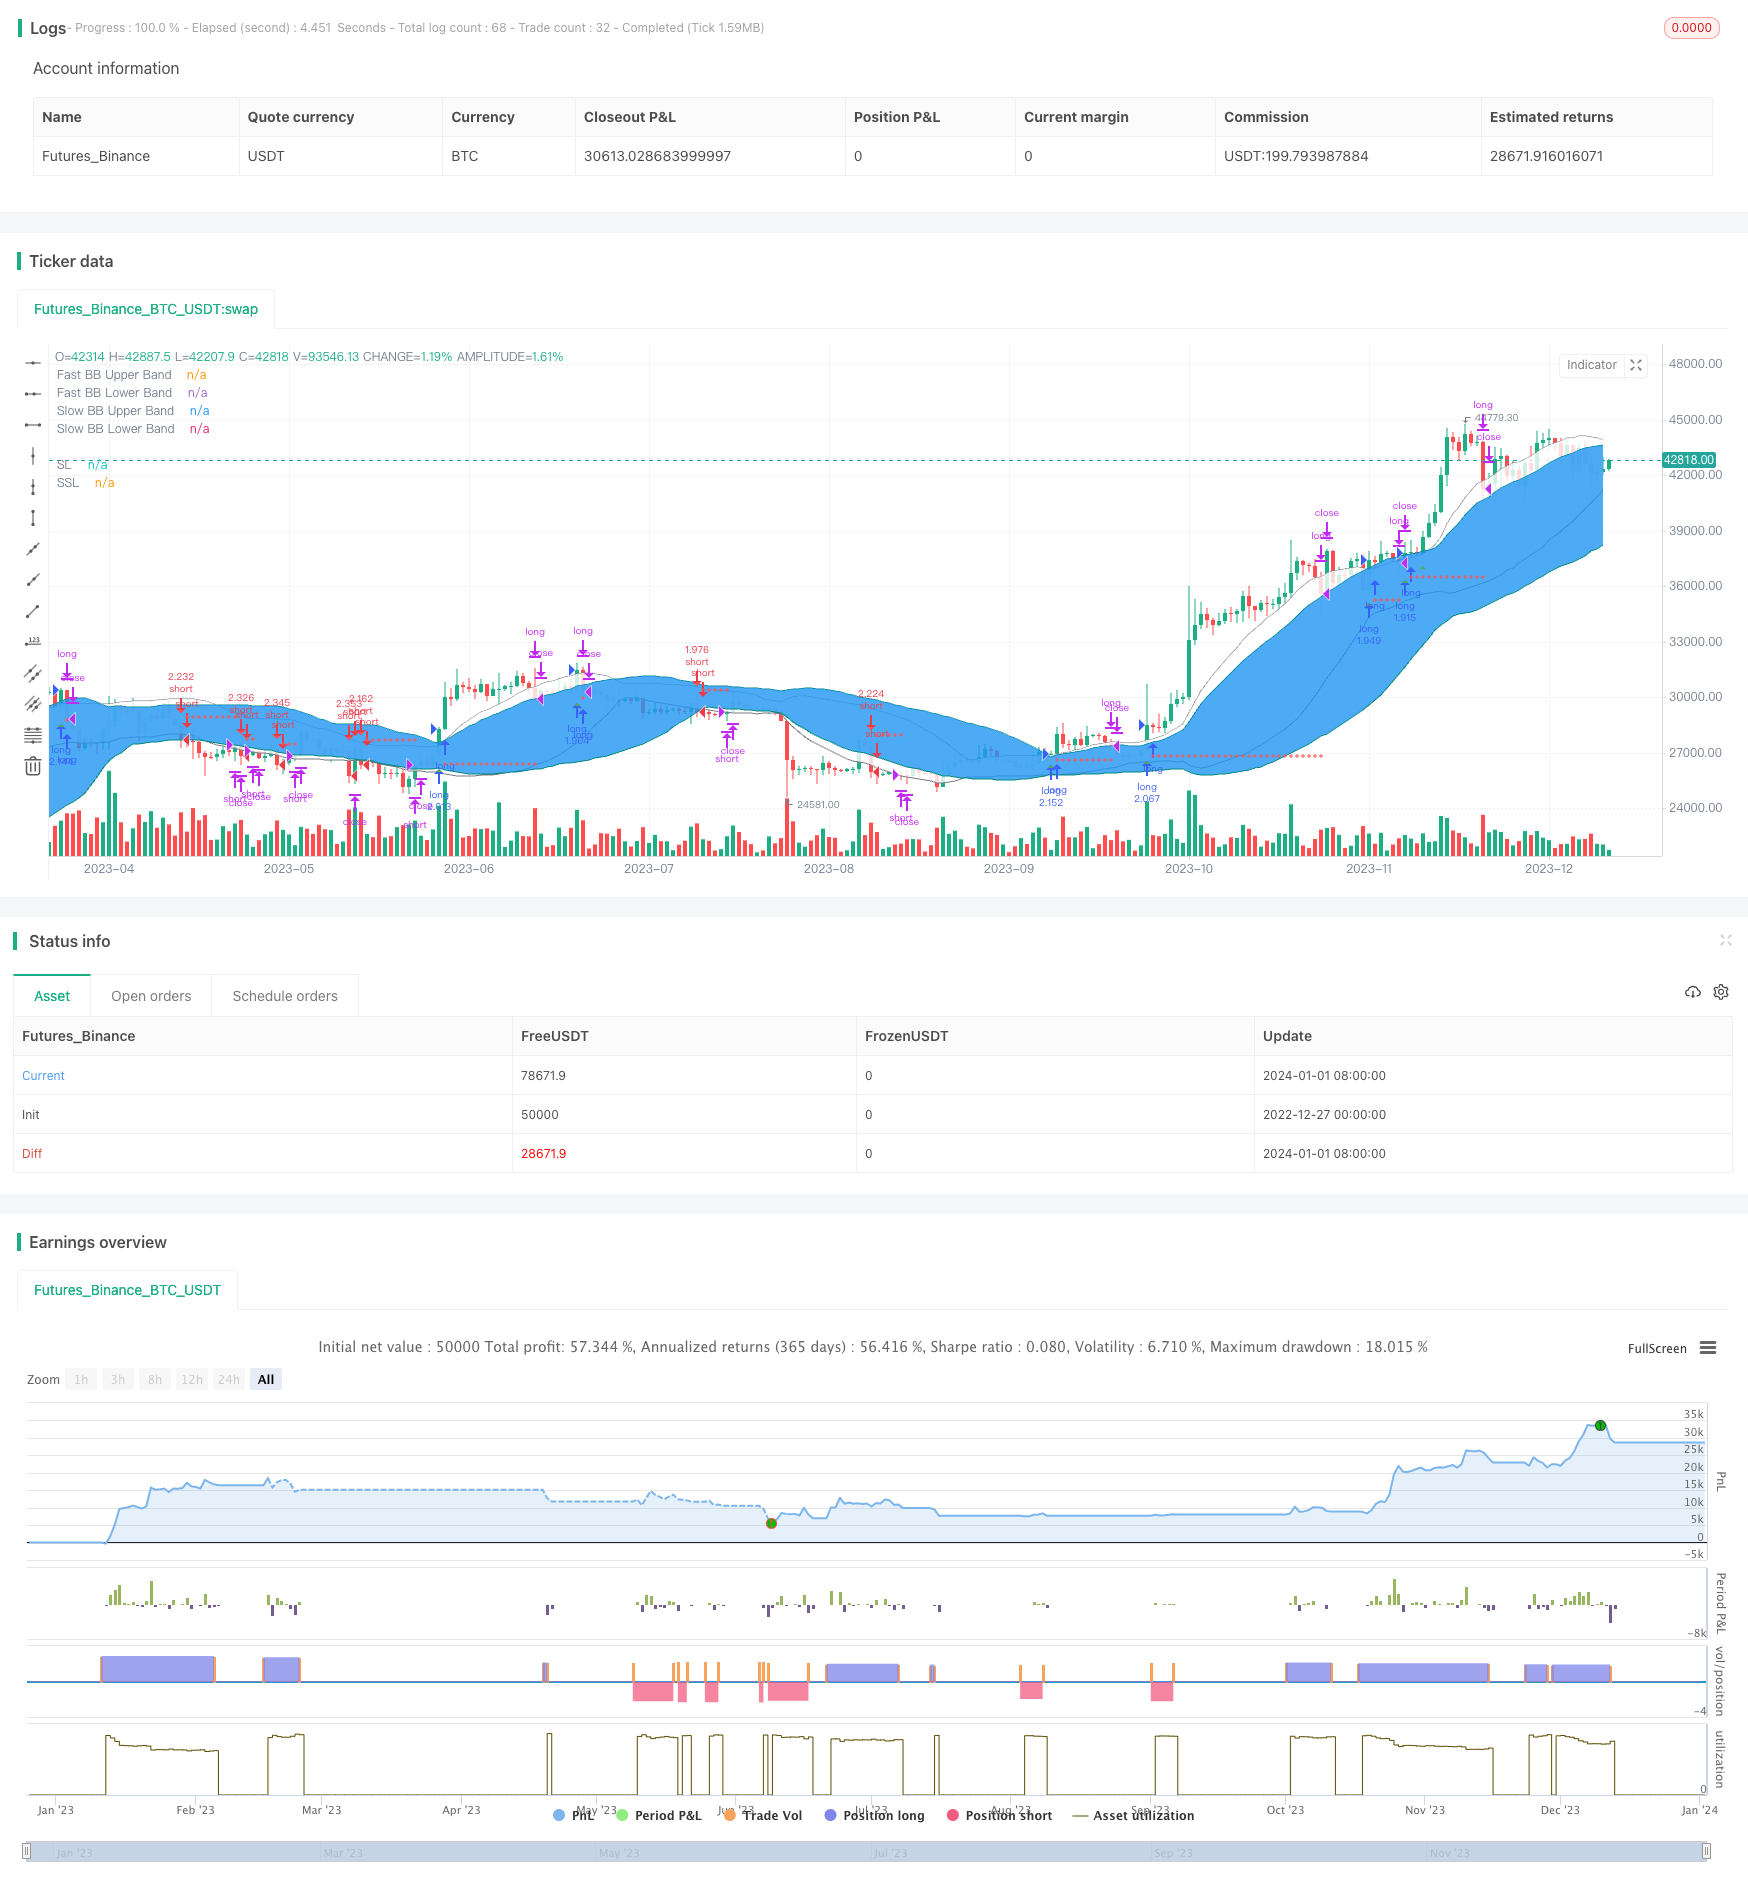
双波动带截断策略是一个利用波动带指标的短线交易策略。它同时使用快速和慢速两个不同参数设置的波动带,在波动带进行向上或向下突破时寻找交易机会。
该策略同时使用长度分别为20和50,标准差为1的快速和慢速波动带。当收盘价突破快速波动带上轨时,以该收盘价进入多头头寸;当收盘价突破快速波动带下轨时,以该收盘价进入空头头寸。
一旦进入头寸后,策略会等待价格继续突破慢速波动带上轨或下轨,作为进一步确认信号。此外,策略还会结合RSI指标判断趋势方向。只有当RSI高于50时,才会考虑突破上轨的买入信号;只有当RSI低于50时,才会考虑突破下轨的卖出信号。
在仓位建立后,如果价格重新突破快速波动带上轨或下轨,则对应的多头或空头头寸会退出。
双波动带截断策略的优势主要体现在 capture small moves的能力上。通过快速波动带捕捉小幅价格突破,慢速波动带再次验证信号,可以过滤假突破的噪音,从中获利。同时,RSI指标的结合也可以避免在震荡趋势中错过大趋势的反转点。
另外,双波动带本身作为动量指标,可以很好地判断市场目前是否处于高动量阶段,这对于一个短线交易策略来说是非常有利的。
该策略的主要风险在于双波动带产生的交易信号可能过于频繁,无法有效过滤市场噪音。这会导致过多的错误交易亏损累积。此外,在低速行情阶段,波动带的幅度收窄,交易机会也会减少。
为降低风险,可以考虑调整波动带参数,使用更长周期的慢速波动带,或人工再次确认信号。也可以结合其他技术指标,如MACD、KDJ等进行组合,改善策略稳定性。
该策略的优化空间主要集中在波动带参数和RSI参数调节上。例如可以测试不同长度周期的快速和慢速波动带参数,找到最佳组合。或者尝试不同长度周期的RSI指标参数,看是否可以改善策略表现。
另一个优化方向是添加或调整止损逻辑。当前策略并没有设置止损,这增加了策略最大回撤的风险。适当设置固定比例止损或追踪止损都可以显著改善风险收益情况。
双波动带截断策略是一个对市场动量敏感的短线交易策略。它可以在高波动的行情中捕捉小幅价格移动,在双波动带指标发出清晰信号时进行交易。但该策略的可靠性还有待进一步验证,通过参数优化和止损逻辑的添加,有望进一步改善策略的稳定性。
||
The Double Bollinger Band Breakout Strategy is a short-term trading strategy that utilizes the Bollinger Band indicator. It employs two Bollinger Bands with different parameter settings, fast and slow, to identify trading opportunities when the bands are broken up or down.
The strategy uses a fast Bollinger Band with length of 20 and standard deviation of 1, and a slow Bollinger Band with length of 50 and standard deviation of 1. When the close price breaks above the upper band of the fast Bollinger, a long position is entered using the closing price. When the close price breaks below the lower band of the fast Bollinger, a short position is entered.
Once in a position, the strategy waits for further confirmation by price breaking the upper or lower band of the slow Bollinger. In addition, the RSI indicator is used to determine the trend direction. Buy signals from upper band breakouts are only considered when RSI is above 50. Sell signals from lower band breakouts are only considered when RSI is below 50.
After positions are established, they will be closed when price breaks back inside the fast Bollinger Bands up or down.
The main advantage of the Double Bollinger Band Breakout Strategy lies in its ability to capture small moves. By using the fast Bollinger Band to catch small breakouts and the slow Bollinger Band to filter false signals, it can profit from low-range fluctuations. The addition of RSI also helps avoid missing major trend reversals during ranging markets.
Moreover, as a momentum indicator itself, the Bollinger Band excels at detecting high volatility stages in the market, which benefits short-term trading strategies.
The major risk comes from the possibly excessive trading signals generated by the double Bollinger setup, which may fail to filter market noise effectively. This could lead to accumulated losses from erroneous trades. Also, when volatility is low, the width of the bands narrows and trading opportunities decrease.
To mitigate risks, parameters of the Bollinger Bands can be adjusted, using longer slow bands or manual confirmation of signals. Combining other indicators like MACD and KDJ may also enhance stability.
The main optimization space lies in adjusting the parameters of the Bollinger Bands and RSI. For example, testing different periods for the fast and slow bands to find the optimal combination. Or try different RSI periods to see if strategy performance can be improved.
Another direction is to add or amend stop loss logic. Currently there is no stop loss mechanism, which increases maximum drawdown risk. Adding fixed percentage or trailing stop loss could significantly improve risk-reward metrics.
The Double Bollinger Band Breakout Strategy is a short-term momentum trading strategy sensitive to market volatility. It captures small price moves within volatile markets when clear signals are given by the double Bollinger setup. However, further proof of reliability is needed. Through parameter tuning and adding stop loss logic, there is good potential to further improve stability.
[/trans]
Strategy Arguments
| Argument | Default | Description |
|---|---|---|
| v_input_1 | false | Strategy Direction |
| v_input_2 | true | -----------------Strategy Inputs------------------- |
| v_input_3 | 14 | RSI Length |
| v_input_4 | 45 | Slow BB Band Length |
| v_input_5 | 31 | Fast BB Band Length |
| v_input_6 | true | -----------------General Inputs------------------- |
| v_input_7 | true | Use Stop Loss and Take Profit |
| v_input_8 | 0 | Type Of Stop: Strategy Stop |
| v_input_9 | 10 | Swing Point Lookback |
| v_input_10 | true | Swing Point SL Perc Increment |
| v_input_11 | 14 | ATR Length |
| v_input_12 | 5 | ATR Multiple |
| v_input_13 | 2 | Take Profit Risk Reward Ratio |
| v_input_14 | false | Trailing Stop |
| v_input_15 | true | Use Strategy Close Logic |
| v_input_16 | true | Allow Direct Position Reverse |
| v_input_17 | false | Reverse Trades |
Source (PineScript)
/*backtest
start: 2022-12-27 00:00:00
end: 2024-01-02 00:00:00
period: 1d
basePeriod: 1h
exchanges: [{"eid":"Futures_Binance","currency":"BTC_USDT"}]
*/

// This source code is subject to the terms of the Mozilla Public License 2.0 at https://mozilla.org/MPL/2.0/

// From "Bitcoin Trading Strategies: Algorithmic Trading Strategies For Bitcoin And Cryptocurrency That Work" by David Hanson.

// "Double Bolinger Band Scalping System
// Recommended Timeframe: 1 minute or 5 minute

// Required Indicators:
// - RSI with a length of 14 (default settings)
// - Bolinger band #1 settings: Length = 50, stDev = 1 Hide the basis/middle line (basis line not needed for this strategy)
// Note: This is the slower bolinger band in the directions
// - Bolinger band #2 settings: Length 20, stDev = 1 Hide the basis/middle line (basis line not needed for this strategy)
// Note: This is the faster bolinger band in the directions

// Enter Long/Buy Trade When:
// - RSI is above the level 50
// - A candle closes above the top of the faster bolinger band
// Enter a long when a candle then closes above the top of the slower bolinger band, and price is above the top of both bands
// Place a stop loss under the low of the entry candle Example of a long trade using this strategy
// Exit Long Trade When: A candle closes below the top band of the fast bolinger band

// Enter Short/Sell Trade When:
// - RSI is below the level 50
// - A candle closes below the bottom of the faster bolinger band
// Enter a short when a candle then closes below the bottom of the slower bolinger band, and price is below both bands
// Place a stop loss above the high of the entry candle Example of a short trade using this strategy
// Exit Short Trade When: Price closes inside the bottom of the faster bolinger band"

// © tweakerID

//@version=4
strategy("Double Bollinger Strategy",
     overlay=true,
     default_qty_type=strategy.percent_of_equity,
     default_qty_value=100,
     initial_capital=10000,
     commission_value=0.04,
     calc_on_every_tick=false,
     slippage=0)

direction = input(0, title = "Strategy Direction", type=input.integer, minval=-1, maxval=1)
strategy.risk.allow_entry_in(direction == 0 ? strategy.direction.all : (direction < 0 ? strategy.direction.short : strategy.direction.long))

/////////////////////// STRATEGY INPUTS ////////////////////////////////////////
title1=input(true, "-----------------Strategy Inputs-------------------")

i_RSI=input(14, title="RSI Length")
lengthS = input(45, minval=1, title="Slow BB Band Length")
lengthF = input(31, minval=1, title="Fast BB Band Length")

/////////////////////// BACKTESTER /////////////////////////////////////////////
title2=input(true, "-----------------General Inputs-------------------")

// Backtester General Inputs
i_SL=input(true, title="Use Stop Loss and Take Profit")
i_SLType=input(defval="Strategy Stop", title="Type Of Stop", options=["Strategy Stop", "Swing Lo/Hi", "ATR Stop"])
i_SPL=input(defval=10, title="Swing Point Lookback")
i_PercIncrement=input(defval=1, step=.1, title="Swing Point SL Perc Increment")*0.01
i_ATR = input(14, title="ATR Length")
i_ATRMult = input(5, step=.1, title="ATR Multiple")
i_TPRRR = input(2, step=.1, title="Take Profit Risk Reward Ratio")
TS=input(false, title="Trailing Stop")

// Bought and Sold Boolean Signal
bought = strategy.position_size > strategy.position_size[1]
 or strategy.position_size < strategy.position_size[1]

// Price Action Stop and Take Profit
LL=(lowest(i_SPL))*(1-i_PercIncrement)
HH=(highest(i_SPL))*(1+i_PercIncrement)
LL_price = valuewhen(bought, LL, 0)
HH_price = valuewhen(bought, HH, 0)
entry_LL_price = strategy.position_size > 0 ? LL_price : na
entry_HH_price = strategy.position_size < 0 ? HH_price : na
tp=strategy.position_avg_price + (strategy.position_avg_price - entry_LL_price)*i_TPRRR
stp=strategy.position_avg_price - (entry_HH_price - strategy.position_avg_price)*i_TPRRR

// ATR Stop
ATR=atr(i_ATR)*i_ATRMult
ATRLong = ohlc4 - ATR
ATRShort = ohlc4 + ATR
ATRLongStop = valuewhen(bought, ATRLong, 0)
ATRShortStop = valuewhen(bought, ATRShort, 0)
LongSL_ATR_price = strategy.position_size > 0 ? ATRLongStop : na
ShortSL_ATR_price = strategy.position_size < 0 ? ATRShortStop : na
ATRtp=strategy.position_avg_price + (strategy.position_avg_price - LongSL_ATR_price)*i_TPRRR
ATRstp=strategy.position_avg_price - (ShortSL_ATR_price - strategy.position_avg_price)*i_TPRRR


// Strategy Stop
float LongStop = valuewhen(bought,low[1],0)*(1-i_PercIncrement)
float ShortStop = valuewhen(bought,high[1],0)*(1+i_PercIncrement)
float StratTP = na
float StratSTP = na

/////////////////////// STRATEGY LOGIC /////////////////////////////////////////

//RSI
RSI=rsi(close, i_RSI)

//BOLL1
[middleS, upperS, lowerS] = bb(close, lengthS, 1)
p1 = plot(upperS, "Slow BB Upper Band", color=color.teal)
p2 = plot(lowerS, "Slow BB Lower Band", color=color.teal)
fill(p1, p2, title = "Slow BB Background", color=color.blue, transp=95)

//BOLL2
[middleF, upperF, lowerF] = bb(close, lengthF, 1)
p1F = plot(upperF, "Fast BB Upper Band", color=color.gray)
p2F = plot(lowerF, "Fast BB Lower Band", color=color.gray)
fill(p1F, p2F, title = "Fast BB Background", color=color.white, transp=95)


BUY = bar_index > 40 and (RSI > 50) and (close > upperF) and crossover(close, upperS)
SELL = bar_index > 40 and (RSI < 50) and (close < lowerF) and crossunder(close, lowerS)

longexit=close < upperF
shortexit=close > lowerF

//Trading Inputs
i_strategyClose=input(true, title="Use Strategy Close Logic")
DPR=input(true, "Allow Direct Position Reverse")
reverse=input(false, "Reverse Trades")

// Entries
if reverse
    if not DPR
        strategy.entry("long", strategy.long, when=SELL and strategy.position_size == 0)
        strategy.entry("short", strategy.short, when=BUY and strategy.position_size == 0)
    else
        strategy.entry("long", strategy.long, when=SELL)
        strategy.entry("short", strategy.short, when=BUY)
else
    if not DPR
        strategy.entry("long", strategy.long, when=BUY and strategy.position_size == 0)
        strategy.entry("short", strategy.short, when=SELL and strategy.position_size == 0)
    else
        strategy.entry("long", strategy.long, when=BUY)
        strategy.entry("short", strategy.short, when=SELL)

if i_strategyClose
    strategy.close("long", when=longexit)
    strategy.close("short", when=shortexit)


SL= i_SLType == "Swing Lo/Hi" ? entry_LL_price : i_SLType == "ATR Stop" ? LongSL_ATR_price : LongStop
SSL= i_SLType == "Swing Lo/Hi" ? entry_HH_price : i_SLType == "ATR Stop" ? ShortSL_ATR_price : ShortStop
TP= i_SLType == "Swing Lo/Hi" ? tp : i_SLType == "ATR Stop" ? ATRtp : StratTP
STP= i_SLType == "Swing Lo/Hi" ? stp : i_SLType == "ATR Stop" ? ATRstp : StratSTP

//TrailingStop
dif=(valuewhen(strategy.position_size>0 and strategy.position_size[1]<=0, high,0))
 -strategy.position_avg_price
trailOffset     = strategy.position_avg_price - SL
var tstop = float(na)
if strategy.position_size > 0
    tstop := high- trailOffset - dif
    if tstop<tstop[1]
        tstop:=tstop[1]
else
    tstop := na
StrailOffset     = SSL - strategy.position_avg_price
var Ststop = float(na)
Sdif=strategy.position_avg_price-(valuewhen(strategy.position_size<0
 and strategy.position_size[1]>=0, low,0))
if strategy.position_size < 0
    Ststop := low+ StrailOffset + Sdif
    if Ststop>Ststop[1]
        Ststop:=Ststop[1]
else
    Ststop := na

strategy.exit("TP & SL", "long", limit=TP, stop=TS? tstop : SL, when=i_SL)
strategy.exit("TP & SL", "short", limit=STP, stop=TS? Ststop : SSL, when=i_SL)

/////////////////////// PLOTS //////////////////////////////////////////////////


plot(i_SL and strategy.position_size > 0 and not TS ? SL : i_SL and strategy.position_size > 0 and TS ? tstop : na , title='SL', style=plot.style_cross, color=color.red)
plot(i_SL and strategy.position_size < 0 and not TS ? SSL : i_SL and strategy.position_size < 0 and TS ? Ststop : na , title='SSL', style=plot.style_cross, color=color.red)
plot(i_SL and strategy.position_size > 0 ? TP : na, title='TP', style=plot.style_cross, color=color.green)
plot(i_SL and strategy.position_size < 0 ? STP : na, title='STP', style=plot.style_cross, color=color.green)
// Draw price action setup arrows
plotshape(BUY ? 1 : na, style=shape.triangleup, location=location.belowbar,
 color=color.green, title="Bullish Setup", size=size.auto)
plotshape(SELL ? 1 : na, style=shape.triangledown, location=location.abovebar,
 color=color.red, title="Bearish Setup", size=size.auto)
Detail
https://www.fmz.com/strategy/437505
Last Modified
2024-01-03 12:06:31