Name
双移动均线追踪止损策略Dual-Moving-Average-Tracking-Stop-Loss-Strategy
Author
ChaoZhang
Strategy Description
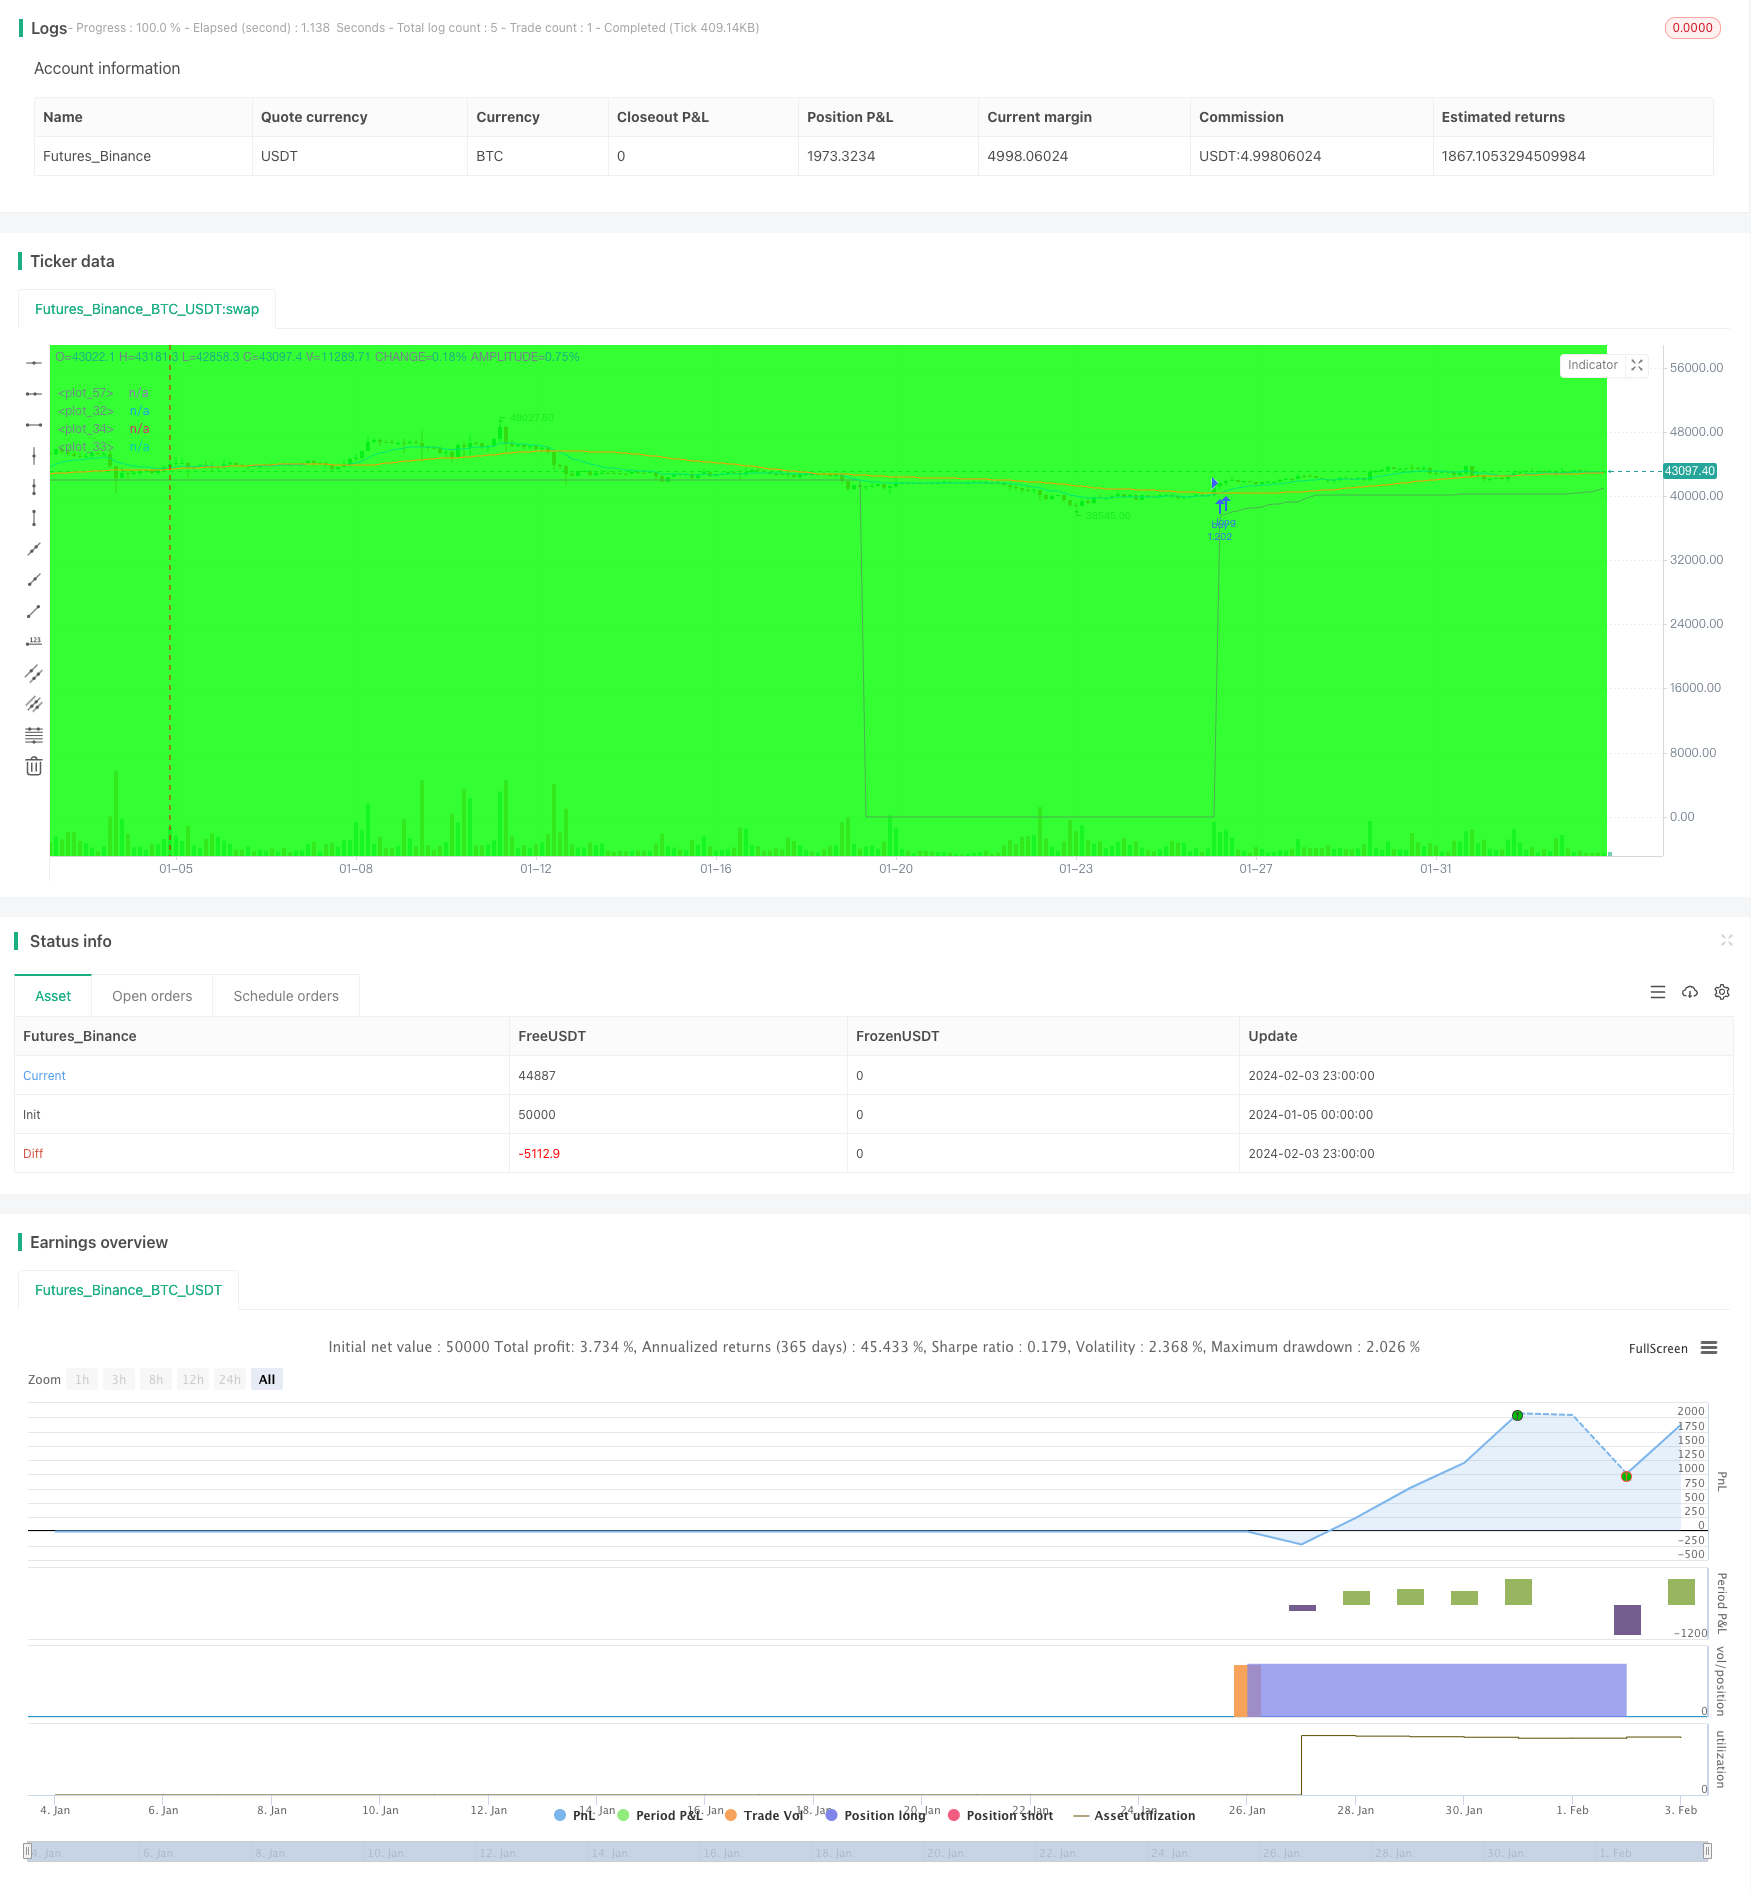
本策略通过计算两条不同参数的移动平均线,当快线上穿慢线时生成买入信号。同时利用平均真实波动范围计算追踪止损价位,当价格跌破该止损价位时产生卖出信号。该策略能够有效跟踪市场趋势,在盈利后及时止损。
- 快速移动平均线(EMA):参数为12日指数移动平均线,能够快速响应价格变化。
- 慢速移动平均线(SMA):参数为45日简单移动平均线,表征中长期趋势。
- 当快速移动平均线上穿慢速移动平均线时,产生买入信号。
- 计算15日平均真实波动幅度(ATR)作为止损基准。
- 根据ATR数值设定追踪止损幅度(如6倍ATR),并实时更新止损价位。
- 当价格低于止损价位时,产生卖出信号。
该策略融合趋势跟踪和止损管理的优点,既可以跟踪中长线方向,又可以通过止损来控制单笔损失。
- 移动平均线组合可以有效识别趋势,增加信号的可靠性。
- 动态追踪止损可以及时止损,避免打击资金实力。
- 结合ATR止损使止损价位合理,防止过于敏感。
- 策略思路清晰易懂,参数调整灵活。
- 移动平均线存在滞后,可能错过短线机会。
- 止损过于宽松会使盈利能力变差。
- 止损过于敏感会增加交易频率和手续费负担。
- 股票波动率变化可能影响ATR参数的稳定性。
可以适当优化移动平均线参数,或调整ATR倍数来平衡止损幅度。也可以结合其他指标作为过滤条件来改善入场时机。
- 测试更多参数组合选择最佳的移动平均线。
- 根据不同股票的特点调整ATR止损的倍数参数。
- 增加量价指标等过滤条件,避免不必要的交易。
- 积累更多历史数据测试,验证参数稳定性。
本策略成功融合移动平均线的趋势跟踪和ATR动态止损,通过参数优化可以适应不同股票特性。该策略形成了清晰的买入定界和止损定界,使交易逻辑简单清楚。总体来说,该双移动均线追踪止损策略稳定、简单、易于优化,适合作为股票交易的基础策略。
||
This strategy generates buy signals when the fast moving average crosses over the slow moving average. At the same time, it calculates the trailing stop loss price based on Average True Range to set sell signals. This strategy can effectively track market trends and cut losses in a timely manner when profit-taking.
- Fast Moving Average (EMA): 12-day Exponential Moving Average that responds quickly to price changes.
- Slow Moving Average (SMA): 45-day Simple Moving Average that depicts medium to long term trends.
- Buy signals are generated when the fast MA crosses over the slow MA.
- The 15-day Average True Range (ATR) is calculated as the benchmark for stop loss.
- Set the trailing stop loss amplitude based on ATR (e.g. 6 x ATR) and update stop price in real time.
- Sell signals are generated when price drops below the stop loss price.
This strategy combines the advantages of trend following and stop loss management. It can track medium to long term trends and control single trade loss through stop loss.
- MA combos effectively identify trends and increase signal reliability.
- Dynamic trailing stop loss timely stops loss to avoid fund damages.
- ATR-based stop loss makes stop price reasonable and prevents oversensitivity.
- The strategy logic is simple and parameters are flexible.
- MAs have lags that may miss short-term chances.
- Excessive loose stop loss undermines profitability.
- Excessive tight stop loss increases trade frequency and commission fees.
- Changing volatility may influence ATR parameter stability.
Parameters can be optimized to balance stop loss amplitude. Other indicators can also be combined to improve entry timing.
- Test more parameter combinations to find the optimal MAs.
- Adjust ATR multiplier according to specific stock characteristics.
- Add filtering conditions like volume indicators to avoid unnecessary trades.
- Accumulate more historical data to test parameter stability.
This strategy successfully combines MA’s trend following ability and ATR’s dynamic trailing stop loss. Parameters can be optimized to adapt to different stocks. It forms clear buy and sell boundaries, making logic simple and clear. In conclusion, this dual MA tracking stop loss strategy features stability, simplicity and ease of optimization. It works well as a fundamental strategy for stock trading.
[/trans]
Strategy Arguments
| Argument | Default | Description |
|---|---|---|
| v_input_1 | 2005 | Start Year |
| v_input_2 | true | Start Month |
| v_input_3 | true | Start Day |
| v_input_4 | 2050 | Stop Year |
| v_input_5 | 12 | Stop Month |
| v_input_6 | 31 | Stop Day |
| v_input_7 | true | Background |
| v_input_8 | 12 | Exponential MA |
| v_input_9 | 45 | Simple MA |
| v_input_10 | 12 | Stop EMA |
| v_input_11 | 6 | Trailing Stop #ATR |
Source (PineScript)
/*backtest
start: 2024-01-05 00:00:00
end: 2024-02-04 00:00:00
period: 3h
basePeriod: 15m
exchanges: [{"eid":"Futures_Binance","currency":"BTC_USDT"}]
*/

//@version=2
//created by XPloRR 24-02-2018

strategy("XPloRR MA-Buy ATR-MA-Trailing-Stop Strategy",overlay=true, initial_capital=1000,default_qty_type=strategy.percent_of_equity,default_qty_value=100)

testStartYear = input(2005, "Start Year")
testStartMonth = input(1, "Start Month")
testStartDay = input(1, "Start Day")
testPeriodStart = timestamp(testStartYear,testStartMonth,testStartDay,0,0)

testStopYear = input(2050, "Stop Year")
testStopMonth = input(12, "Stop Month")
testStopDay = input(31, "Stop Day")
testPeriodStop = timestamp(testStopYear,testStopMonth,testStopDay,0,0)

testPeriodBackground = input(title="Background", type=bool, defval=true)
testPeriodBackgroundColor = testPeriodBackground and (time >= testPeriodStart) and (time <= testPeriodStop) ? #00FF00 : na
bgcolor(testPeriodBackgroundColor, transp=97)

emaPeriod = input(12, "Exponential MA")
smaPeriod = input(45, "Simple MA")
stopPeriod = input(12, "Stop EMA")
delta = input(6, "Trailing Stop #ATR")

testPeriod() => true

emaval=ema(close,emaPeriod)
smaval=sma(close,smaPeriod)
stopval=ema(close,stopPeriod)
atr=sma((high-low),15)

plot(emaval, color=blue,linewidth=1)
plot(smaval, color=orange,linewidth=1)
plot(stopval, color=lime,linewidth=1)

long=crossover(emaval,smaval)
short=crossunder(emaval,smaval)

//buy-sell signal
stop=0
inlong=0
if testPeriod()
    if (long and (not inlong[1]))
        strategy.entry("buy",strategy.long)
        inlong:=1
        stop:=emaval-delta*atr
    else
        stop:=iff((nz(emaval)>(nz(stop[1])+delta*atr))and(inlong[1]),emaval-delta*atr,nz(stop[1]))
        inlong:=nz(inlong[1])
        if ((stopval<stop) and (inlong[1]))
            strategy.close("buy")
            inlong:=0
            stop:=0
else
    inlong:=0
    stop:=0
plot(stop,color=green,linewidth=1)
Detail
https://www.fmz.com/strategy/441073
Last Modified
2024-02-05 13:45:51
