Name
双重指标混合型量化交易策略Dual-Indicator-Hybrid-Quantitative-Trading-Strategy
Author
ChaoZhang
Strategy Description
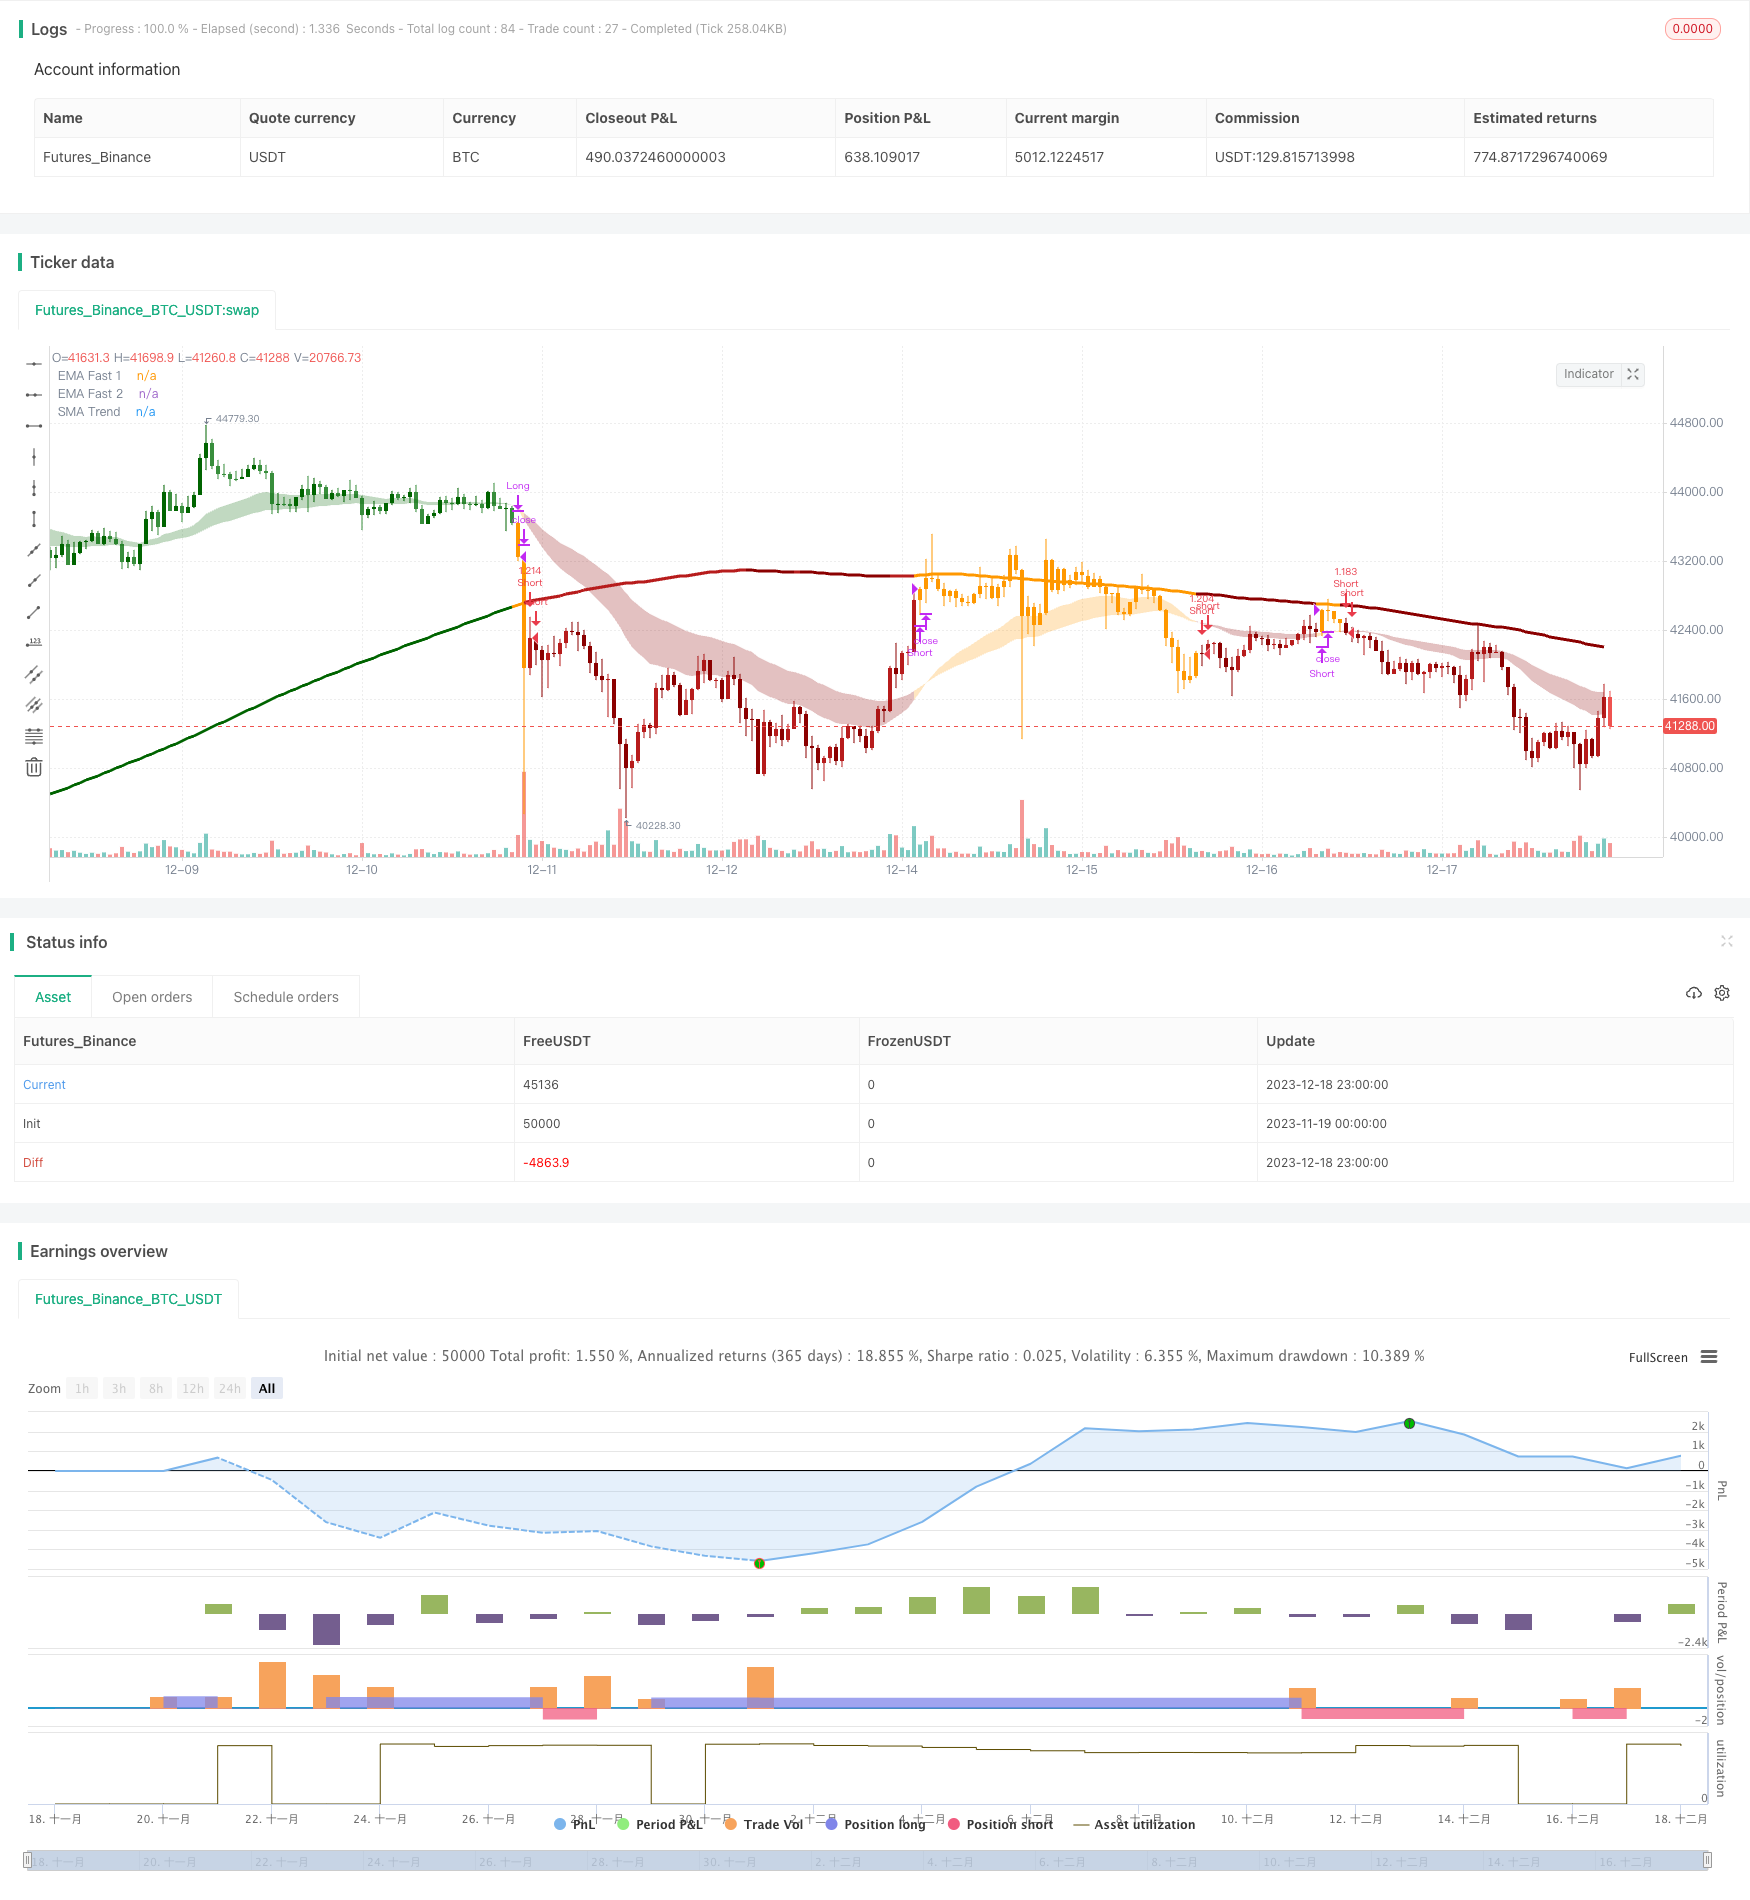
本策略通过结合双重指标来识别趋势方向并进行交易。首先,它使用两个移动平均线(快速线和中速线)的交叉来判断短期趋势;其次,它使用通道范围和长期移动平均线来判断主要趋势方向。只有当两种判断结果一致时,才会产生交易信号。这种混合使用多种指标的策略,可以有效过滤假信号,提高稳定性。
该策略使用三组指标进行判断。首先,快速线EMA(26周期)和中速线EMA(50周期)的金叉死叉来判断短期趋势;其次,计算通道范围,判断价格是否突破该范围来判断中期趋势的多空;最后,计算长期均线SMA(200周期),与价格比较判断主要趋势方向。只有三项判断结果全部一致时,才会发出交易信号。
具体来说,判断逻辑为:
-
快速线和中速线的交叉(金叉看涨,死叉看跌)判断短期趋势方向。
-
价格是否突破通道范围判断中期趋势方向。通道范围基于长期均线加减ATR乘以一个系数。如果价格突破上限,为看涨;如果下破下限,为看跌。
-
比较价格和长期均线大小关系判断主要趋势方向。
最后,只有短、中、长三项判断结果全部一致时才会发出交易信号。这种混合判断可以有效过滤假信号,提高稳定性。
这种双重指标混合策略有几个优势:
-
可以有效过滤假信号,提高稳定性。因为交易信号需要短、中、长多种指标结果的验证,从而避免单一指标造成的错误信号。
-
灵活性高,可以根据市场调整指标参数。快慢均线和通道范围的参数都可以调整,适用于不同市场环境。
-
结合趋势交易和区间交易。中短期指标抓趋势,长期指标确定区间,整体兼具趋势和反转策略的优点。
-
资金使用效率高。只在多种指标结果判断一致时下单,可以有效利用资金,避免不必要的交易。
该策略也存在一些风险:
-
参数设置风险。移动平均线周期和通道范围参数需要合理设置,如果不当可能无法有效发现趋势或造成过多错误信号。
-
双重指标增大交易机会成本。相比单一指标策略,可能错过部分交易机会,无法在最佳点位入场和出场。
-
停损策略需要谨慎。该策略中的突破停损机制可能造成不必要的亏损,需要谨慎设置止损比例。
-
大幅震荡市场中效果可能不佳。该策略更适合趋势明显的市场环境。
该策略可以从以下几个方面进行优化:
-
测试不同的参数组合,寻找最佳参数。可以通过更多历史数据测试,找到最优的参数设置。
-
增加自适应停损机制。可以结合Volatility Indicator动态调整止损幅度。
-
增加量能指标辅助判断。在关键点辅助判断仓位大小,提高资金使用效率。
-
优化入场逻辑。更多考虑分批入场的Cost Average策略,降低单次入场风险。
-
结合机器学习模型判断。引入神经网络等模型判断模型健壮性和拟合优度。
本策略通过快中长三重指标判断和双重验证机制,能有效抑制假信号,提高稳定性。同时兼具趋势交易和区间交易的优势,资金使用效率高。可通过参数优化、停损优化、量能指标结合等多种方式进行改进,是一种值得推荐的混合型量化策略。
||
This strategy combines dual indicators to identify trend direction and make trades. Firstly, it uses the crossover of two moving averages (fast and medium) to judge short-term trend; secondly, it uses channel range and long term moving average to determine the main trend direction. Trading signals are generated only when the two judgments are consistent. The hybrid strategy using multiple indicators can effectively filter false signals and improve stability.
The strategy uses three sets of indicators for judgment. First, the golden cross and death cross of fast EMA (26 periods) and medium EMA (50 periods) to determine short-term trend; secondly, calculate the channel range to judge medium-term trend; finally, calculate long term SMA (200 periods) and compare with price to determine major trend direction. Trading signals are generated only when all three judgments are consistent.
Specifically, the logic is:
-
Crossover of fast and medium moving averages (golden cross for bullish, death cross for bearish) to determine short-term trend.
-
Whether the price breaks through the channel range to determine medium-term trend. The channel range is based on long term MA plus/minus ATR times a coefficient. Breaking upper limit signals bullish, breaking lower limit signals bearish.
-
Comparing price with long term MA to determine major trend.
Finally, trading signals are generated only when all three judgments are consistent. This hybrid mechanism can effectively filter false signals and improve stability.
This dual indicator hybrid strategy has several advantages:
-
Effectively filter false signals and improve stability. Because trading signals need validation from multiple indicators to avoid errors from single metric.
-
High flexibility to adjust parameters for different markets. Parameters of MA and channel range can be adjusted for various environments.
-
Combine trend trading and range trading. Medium and short term indicators catch trends, long term indicator determines range. Overall possesses the merits of both trend and mean-reversion strategies.
-
High capital usage efficiency. Place orders only when multiple indicators agree, capital can be effectively utilized to avoid unnecessary trades.
There are also some risks:
-
Parameter setting risk. MA periods and channel range need proper configuration, improper settings may fail to detect trends or cause excessive false signals.
-
Increased opportunity cost from dual indicators. Compared to single indicator strategies, some trading opportunities may be missed, unable to enter and exit at the optimal points.
-
Stop loss mechanism needs prudence. The breakout stop loss here may cause unnecessary losses. Stop loss percentage needs careful configuration.
-
May underperform in highly volatile markets. This strategy works better in markets with apparent trend.
The strategy can be improved from the following aspects:
-
Test different parameter combinations to find optimum. More backtests with historical data to locate optimal configurations.
-
Add adaptive stop loss mechanism. Dynamically tune stop loss level based on Volatility Indicator.
-
Assist with volume indicators at critical points. Judge position sizing with volume to improve capital efficiency.
-
Optimize entry logic. Consider staged entries with cost averaging to reduce single entry risk.
-
Combine machine learning models. Introduce neural networks to judge model robustness and fitness.
This strategy leverages triple time frame indicators and dual validation to suppress false signals and improve stability. Meanwhile, it possesses the merits of both trend and range trading, with high capital usage efficiency. It can be enhanced via parameter optimization, stop loss tuning, integrating with volume indicators etc. A recommended hybrid quantitative strategy.
[/trans]
Strategy Arguments
| Argument | Default | Description |
|---|---|---|
| v_input_bool_6 | false | ■ Golden Cross On/Off |
| v_input_source_1_close | 0 | (?EMAs)MA Source: close |
| v_input_int_1 | 26 | EMA Fast |
| v_input_int_2 | 50 | EMA Medium |
| v_input_int_3 | 200 | (?Trend Channel)MA Trend |
| v_input_string_1 | 0 | MA Type: SMA |
| v_input_timeframe_1 | Select Higher Timeframe | |
| v_input_float_1 | 0.618 | Channel Range Length |
| v_input_bool_1 | false | (?Stop Loss)■ Stop Loss On/Off |
| v_input_float_2 | 2.618 | SL % |
| v_input_bool_2 | true | (?Period)■ Period On/Off |
| v_input_1 | o_start | Start Time |
| v_input_2 | o_end | End Time |
| v_input_string_2 | 0 | (?Strategy)Position Type: Both |
| v_input_string_3 | 0 | Strategy Type: Strategy 2 |
| v_input_bool_3 | true | (?Display)■ Bar Color On/Off |
| v_input_bool_4 | false | ■ Alert On/Off |
| v_input_bool_5 | false | ■ Channel Range On/Off |
| v_input_string_4 | {{strategy.order.comment}} | Setting alert |
Source (PineScript)
/*backtest
start: 2023-11-19 00:00:00
end: 2023-12-19 00:00:00
period: 1h
basePeriod: 15m
exchanges: [{"eid":"Futures_Binance","currency":"BTC_USDT"}]
*/

//@version=5
// Indicator to combines:
//           Trend Channel[Gu5] (SMA 200) +
//           EMA's cross  (26, 50 ) +
//           Golden Cross (50, 200)
// Author: @gu5tavo71 08/2019
// v2.3.6, 2022.02.18
// Trend Channel [Gu5] // Author: @gu5tavo71 08/2019
//
// This source code is subject to these terms:
// Attribution-NonCommercial 4.0 International (CC BY-NC 4.0)
// https://www.safecreative.org/work/2202190517452-mix1-ema-cross-trend-channel-gu5-
// You are free to:
// Share, copy and redistribute this script
// Adapt, transform and build on this script
// Under the following terms:
// Non-commercial: You cannot sell my indicator. You can't sell my work.
// Attribution: If you post part of my code, you must give me proper credit
//
// I am using part of this code published by @PineCoders and Public Library
// Disclaimer: I am not a financial advisor.
//             For purpose educate only. Use at your own risk.
strategy(title = 'Mix1 : Ema Cross + Trend Channel [Gu5] - Backtest', shorttitle = 'Mix01', overlay = true,
  initial_capital = 100,
  default_qty_value = 100,
  default_qty_type = strategy.percent_of_equity,
  commission_value = 0.075,
  commission_type = strategy.commission.percent,
  format = format.price,
  precision = 2,
  process_orders_on_close = true)


// ---------   Inputs                       "=============================="           |
i_maSrc      = input.source     (close,     'MA Source'                     , group    = 'EMAs')
i_maFast1    = input.int        (26,        'EMA Fast'                      , group    = 'EMAs')
i_maFast2    = input.int        (50,        'EMA Medium'                    , group    = 'EMAs')
i_maLen      = input.int        (200,       'MA Trend'                      , group    = 'Trend Channel')
o_maLen1     =                              'EMA'
o_maLen2     =                              'SMA'
i_maLenSel   = input.string     (o_maLen2,  'MA Type'                       , group    = 'Trend Channel',
               options = [o_maLen1, o_maLen2],
               tooltip = "EMA or SMA")
i_htf        = input.timeframe  ('',        'Select Higher Timeframe'       , tooltip  = 'Only for MA Trend'  , group    = 'Trend Channel')
i_rangeLen   = input.float      (0.618,     'Channel Range Length'          , tooltip  = 'ATR of the MA Trend', group    = 'Trend Channel')
i_slOn       = input.bool       (false,     '■ Stop Loss On/Off'            , group    = 'Stop Loss')
i_sl         = input.float      (2.618,     'SL %'                          , step     = 0.1, group    = 'Stop Loss')
i_periodSw   = input.bool       (true,      '■ Period On/Off'               , group    = 'Period')
o_start      = timestamp        (           '2020-01-01 00:00 GMT-3'        )
o_end        = timestamp        (           '2099-12-31 00:00 GMT-3'        )
i_periodStar = input       (o_start,   'Start Time'                    , group    = 'Period')
i_periodEnd  = input       (o_end,     'End Time'                      , group    = 'Period')
o_posSel1    =                              'Only Long'
o_posSel2    =                              'Only Short'
o_posSel3    =                              'Both'
i_posSel     = input.string     (o_posSel3, 'Position Type'                 , group   = 'Strategy',
               options = [o_posSel1, o_posSel2, o_posSel3],
               tooltip = "Only Long, Only short or Both")
o_typeS1     =                              'Strategy 1'
o_typeS2     =                              'Strategy 2'
i_typeS      = input.string     (o_typeS2,  'Strategy Type'                 , group   = 'Strategy',
               options = [o_typeS1, o_typeS2],
               tooltip = "Strategy 1:\nLong, when the price (close) crosses the ema.\nStrategy 2:\nLong, only when ema goes up")
i_barColOn   = input.bool       (true,      '■ Bar Color On/Off'            , group   = 'Display')
i_alertOn    = input.bool       (false,     '■ Alert On/Off'                , group   = 'Display')
i_channelOn  = input.bool       (false,     '■ Channel Range On/Off'        , tooltip = 'If the price (close) is over than the channel, the trend is bullish. If the price is under, bearish. And if the price is in the channel, it is in range', group   = 'Display')
i_goldenOn   = input.bool       (false,     '■ Golden Cross On/Off'         )
o_alert      =                              '{{strategy.order.comment}}'
i_alert      = input.string     (o_alert,   'Setting alert'                 , tooltip = 'For Alerts, just copy {{strategy.order.comment}} and paste in alert window.', group   = 'Display')

// ---------   Calculations
maFast1      = ta.ema(i_maSrc, i_maFast1)
maFast2      = ta.ema(i_maSrc, i_maFast2)
maDir        = maFast1 > maFast2 ? 1 : -1
maTrend      = request.security(syminfo.tickerid, i_htf,
               i_maLenSel == "SMA" ? ta.sma(close, i_maLen)[1] : ta.ema(close, i_maLen)[1],
               lookahead = barmerge.lookahead_on)  //No repaint
maTrendDir   = i_maSrc >= maTrend ? 1 : -1
rangeAtr     = ta.atr(i_maLen) * i_rangeLen
rangeTop     = maTrend + rangeAtr
rangeBot     = maTrend - rangeAtr
rangeCh      = (open <= rangeTop or close <= rangeTop) and
               (open >= rangeBot or close >= rangeBot)
trendDir     = i_typeS  ==  'Strategy 1'                            ?
               rangeCh                                                ?  0 :
               maTrendDir ==  1 and maDir ==  1 and maTrend > maFast2 ?  0 :
               maTrendDir == -1 and maDir == -1 and maTrend < maFast2 ?  0 :
               maTrendDir ==  1 and maDir ==  1                       ?  1 :
               maTrendDir == -1 and maDir == -1                       ? -1 : 0 :
               rangeCh                                                ?  0 :
               maTrendDir ==  1 and maDir ==  1                       ?  1 :
               maTrendDir == -1 and maDir == -1                       ? -1 : 0
GCross       = i_goldenOn ? ta.crossover (maFast2, maTrend) : na
DCross       = i_goldenOn ? ta.crossunder(maFast2, maTrend) : na

period       = true
// Set initial values
condition    = 0.0
entryLong    = trendDir ==  1 and
               i_posSel != 'Only Short' and
               (i_periodSw ? period : true)
entryShort   = trendDir == -1 and
               i_posSel != 'Only Long' and
               (i_periodSw ? period : true)
exitLong     = (trendDir !=  1 or maDir == -1) and
               condition[1] == 1 and
               i_posSel != 'Only Short' and
               (i_periodSw ? period : true)
exitShort    = (trendDir != -1 or maDir ==  1) and
               condition[1] == -1 and
               i_posSel != 'Only Long' and
               (i_periodSw ? period : true)
closeCond    = exitLong or exitShort
// Stop Loss (sl)
slEntry      = close * i_sl / 100
slTop        = close + slEntry
slBot        = close - slEntry
slTopBuff    = ta.valuewhen(condition[1] !=  1 and entryLong,  slBot, 0)
slBotBuff    = ta.valuewhen(condition[1] != -1 and entryShort, slTop, 0)
slLine       = condition[1] == -1 and entryLong  ? slTopBuff :
               condition[1] ==  1 and entryShort ? slBotBuff :
               condition[1] ==  1  or entryLong  ? slTopBuff :
               condition[1] == -1  or entryShort ? slBotBuff : na
slTopCross   = condition[1] ==  1 and ta.crossunder(close, slLine) or high > slLine and low < slLine
slBotCross   = condition[1] == -1 and ta.crossover (close, slLine) or high > slLine and low < slLine
slExit       = i_slOn ? slTopCross or slBotCross : na
// Conditions
condition   := condition[1] !=  1 and entryLong  ?  1 :
               condition[1] != -1 and entryShort ? -1 :
               condition[1] !=  0 and slExit     ?  0 :
               condition[1] !=  0 and exitLong   ?  0 :
               condition[1] !=  0 and exitShort  ?  0 : nz(condition[1])
long         = condition[1] !=  1 and condition ==  1
short        = condition[1] != -1 and condition == -1
xl           = condition[1] ==  1 and exitLong and not slExit
xs           = condition[1] == -1 and exitShort and not slExit
sl           = condition[1] !=  0 and slExit

// ---------   Colors
c_green      = #006400  //Green
c_greenLight = #388e3c  //Green Light
c_red        = #8B0000  //Red
c_redLight   = #b71c1c  //Red Light
c_emas       = xl                             ? color.new(color.orange, 99) :
               xs                             ? color.new(color.orange, 99) :
               trendDir ==  1 and maDir ==  1 ? color.new(c_green,      99) :
               trendDir == -1 and maDir == -1 ? color.new(c_red,        99) :
               color.new(color.orange, 99)
c_maFill     = xl                             ? color.new(color.orange, 70) :
               xs                             ? color.new(color.orange, 70) :
               trendDir ==  1 and maDir ==  1 ? color.new(c_green,      70) :
               trendDir == -1 and maDir == -1 ? color.new(c_red,        70) :
               color.new(color.orange, 70)
c_maTrend    = trendDir ==  0                           ? color.new(color.orange,  0) :
               trendDir ==  1 and maTrend[1]  < maTrend ? color.new(c_green,       0) :
               trendDir ==  1 and maTrend[1] >= maTrend ? color.new(c_greenLight,  0) :
               trendDir == -1 and maTrend[1]  < maTrend ? color.new(c_redLight,    0) :
               trendDir == -1 and maTrend[1] >= maTrend ? color.new(c_red,         0) : na
c_ch         = trendDir ==  0                           ? color.new(color.orange, 50) :
               trendDir ==  1                           ? color.new(c_green,      50) :
               trendDir == -1                           ? color.new(c_red,        50) : na
c_slLineUp   = ta.rising (slLine, 1)
c_slLineDn   = ta.falling(slLine, 1)
c_slLine     = c_slLineUp ? na :
               c_slLineDn ? na : color.red
c_barCol     = trendDir ==  0                   ? color.new(color.orange,  0) :
               trendDir ==  1 and open <= close ? color.new(c_green,       0) :
               trendDir ==  1 and open  > close ? color.new(c_greenLight,  0) :
               trendDir == -1 and open >= close ? color.new(c_red,         0) :
               trendDir == -1 and open  < close ? color.new(c_redLight,    0) :
               color.new(color.orange, 0)

// ---------   Plots
p_maFast1    = plot(
  maFast1,
  title      = 'EMA Fast 1',
  color      = c_emas,
  linewidth  = 1)
p_maFast2    = plot(
  maFast2,
  title      = 'EMA Fast 2',
  color      = c_emas,
  linewidth  = 2)
fill(
  p_maFast1, p_maFast2,
  title      = 'EMAs Fill',
  color      = c_maFill)
plot(
  maTrend,
  title      = 'SMA Trend',
  color      = c_maTrend,
  linewidth  = 3)
p_chTop      = plot(
  i_channelOn   ? rangeTop : na,
  title      = 'Top Channel',
  color      = c_maTrend,
  linewidth  = 1)
p_chBot      = plot(
  i_channelOn   ? rangeBot : na,
  title      = 'Bottom Channel',
  color      = c_maTrend,
  linewidth  = 1)
fill(
  p_chTop, p_chBot,
  title      = 'Channel',
  color      = c_ch)
plot(
  i_slOn and condition != 0 ? slLine : na,
  title      = 'Stop Loss Line',
  color      = c_slLine,
  linewidth  = 1,
  style      = plot.style_linebr)

// ---------   Alerts
barcolor(i_barColOn ? c_barCol : na)

plotshape(
  i_alertOn and long ? high : na,
  title      = 'Long Label',
  text       = 'Long',
  textcolor  = color.white,
  color      = color.new(c_green, 0),
  style      = shape.labelup,
  size       = size.normal,
  location   = location.belowbar)
plotshape(
  i_alertOn and short ? low : na,
  title      = 'Short Label',
  text       = 'Short',
  textcolor  = color.white,
  color      = color.new(c_red, 0),
  style      = shape.labeldown,
  size       = size.normal,
  location   = location.abovebar)
plotshape(
  i_alertOn and (xl or xs) ? close : na,
  title      = 'Close Label',
  text       = 'Close',
  textcolor  = color.orange,
  color      = color.new(color.orange, 0),
  style      = shape.xcross,
  size       = size.small,
  location   = location.absolute)
plotshape(
  i_alertOn and sl ? slLine : na,
  title      = 'Stop Loss',
  text       = 'Stop\nLoss',
  textcolor  = color.orange,
  color      = color.new(color.orange, 0),
  style      = shape.xcross,
  size       = size.small,
  location   = location.absolute)
plotshape(
  i_alertOn and i_goldenOn and GCross ? maTrend : na,
  title      = 'Golden Cross Label',
  text       = 'Golden\nCross',
  textcolor  = color.white,
  color      = color.new(color.orange, 0),
  style      = shape.labelup,
  size       = size.normal,
  location   = location.absolute)
plotshape(
  i_alertOn and i_goldenOn and DCross ? maTrend : na,
  title      = 'Death Cross Label',
  text       = 'Death\nCross',
  textcolor  = color.white,
  color      = color.new(color.orange, 0),
  style      = shape.labeldown,
  size       = size.normal,
  location   = location.absolute)

bgcolor(
  i_periodSw and not period ? color.new(color.gray, 90) : na,
  title      = 'Session')

// ---------   Backtest
if long  and strategy.position_size == 0 and barstate.isconfirmed
    strategy.entry('Long',  strategy.long,  comment = 'long')
if short and strategy.position_size == 0 and barstate.isconfirmed
    strategy.entry('Short', strategy.short, comment = 'short')
strategy.exit(
  id         = 'XL',
  from_entry = 'Long',
  stop       = i_slOn ? slLine : na)
strategy.exit(
  id         = 'XS',
  from_entry = 'Short',
  stop       = i_slOn ? slLine : na)
strategy.close(
  'Long',
  comment    = 'Close',
  when       = xl)
strategy.close(
  'Short',
  comment    = 'Close',
  when = xs)
Detail
https://www.fmz.com/strategy/435939
Last Modified
2023-12-20 10:31:06