Name
双BB指标RSI量化交易策略Flawless-Victory-Quantitative-Trading-Strategy-Based-on-Double-BB-Indicators-and-RSI
Author
ChaoZhang
Strategy Description
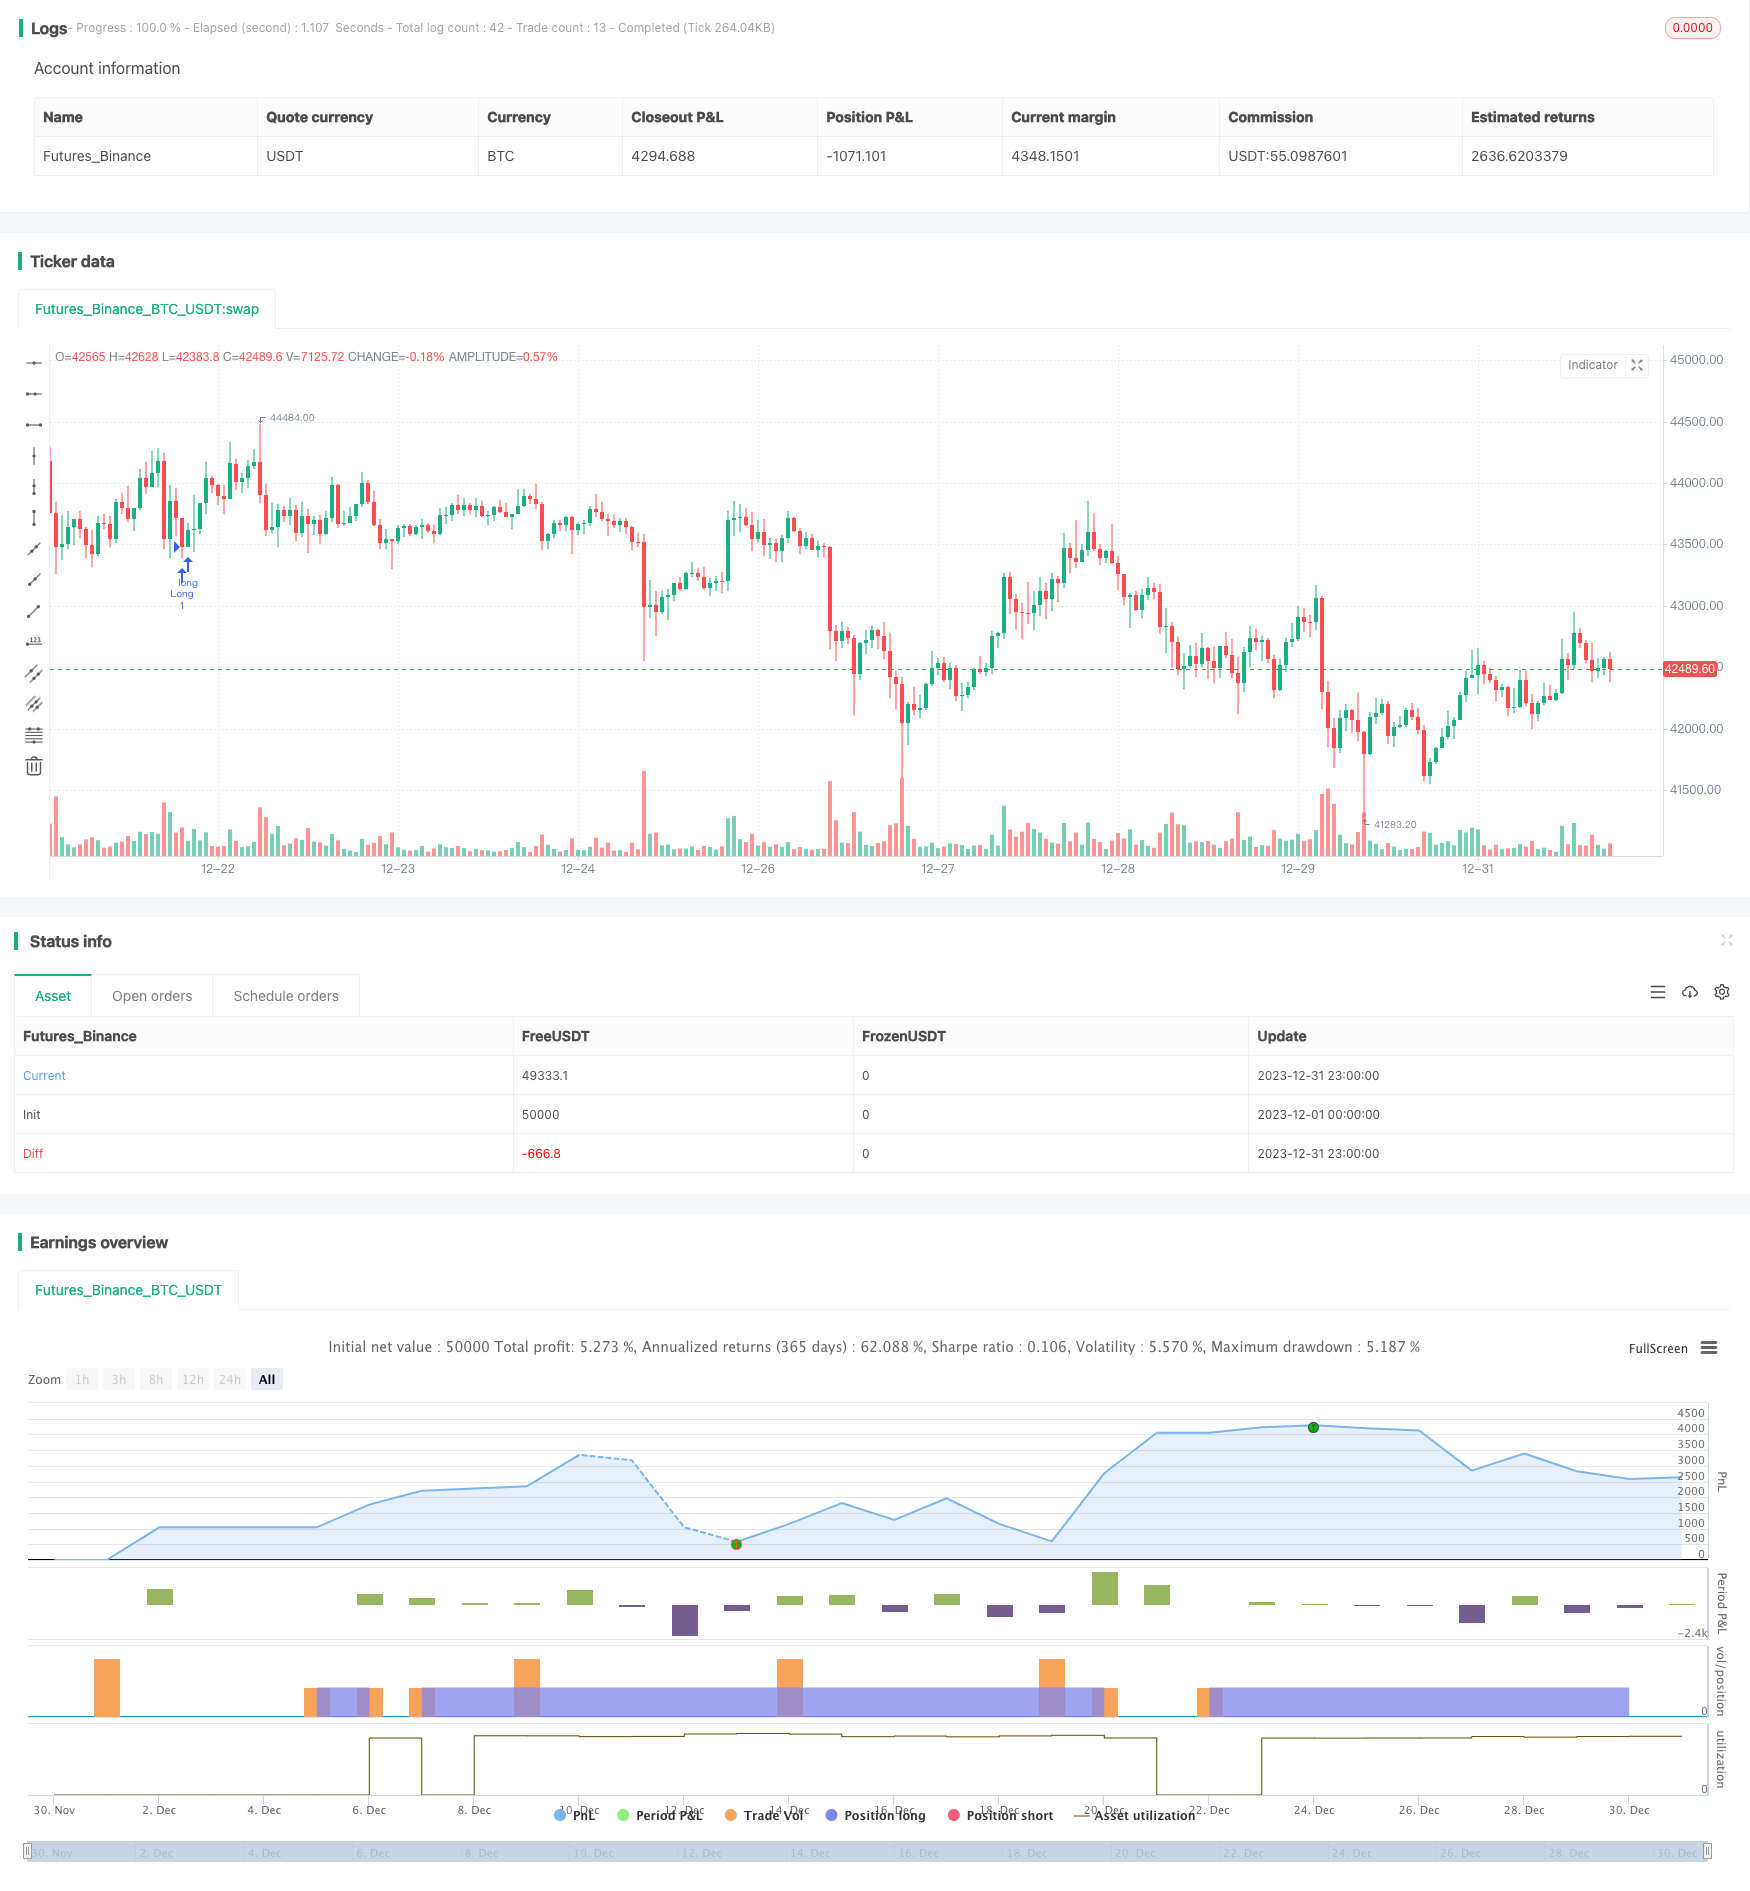
本策略是基于Bollinger Bands指标和相对强弱指数(RSI)指标的量化交易策略。该策略运用机器学习的方法,通过Python语言对近1年的历史数据进行了回测优化,找到了最优的参数组合。
该策略的交易信号来源于双重Bollinger Bands和RSI指标的综合判断。其中,Bollinger Bands指标是根据价格的标准差带计算得到的波动通道。当价格接近或触及波动通道时产生交易信号。而RSI指标则判断价格的超买超卖情况。
具体来说,当收盘价低于1.0标准差下轨,同时RSI大于42时产生买入信号。当收盘价高于1.0标准差上轨,同时RSI大于70时产生卖出信号。此外,该策略还设置了两组BB和RSI的参数,分别用于进场和止损平仓。这些参数都是通过大量回测和机器学习获得的最优值。
这套策略最大的优势在于参数的精确程度。通过机器学习的方法,各个参数都是经过全面回测获得最佳 Sharpe比率的。这样既确保了策略收益率,也控制了风险。此外,双重指标组合也提高了信号的准确性和胜率。
该策略的风险主要来源于止损点的设置。如果止损点设置过大,则无法有效控制损失。此外,如果止损点与手续费、交易滑点等其他交易成本计算不当也会增加风险。为减少风险,建议调整止损幅度参数,降低交易频率,同时计算合理的止损位置。
这套策略还有进一步优化的空间。例如可以尝试改变Bollinger Bands的长度参数,或者调整RSI的超买超卖阈值。此外也可以尝试引入其他指标,构建多指标组合。这可能会提高策略的盈利空间和稳定性。
该策略结合双重BB指标和RSI指标,通过机器学习方法获得了最优参数,实现了高收益率和可控的风险水平。它具有指标组合判断和参数优化两个方面的优势。通过持续改进,这套策略有望成为一个优秀的量化交易策略。
||
This strategy is a quantitative trading strategy based on the Bollinger Bands indicator and the Relative Strength Index (RSI) indicator. This strategy uses machine learning methods to backtest and optimize parameters over nearly 1 year of historical data using Python language, finding the optimal parameter combination.
The trading signals of this strategy come from the combined judgement of double Bollinger Bands and RSI indicators. Among them, the Bollinger Bands indicator is the volatility channel calculated based on the price standard deviation. It generates trading signals when the price approaches or touches the channel. The RSI indicator judges the overbought and oversold situation of the price.
Specifically, a buy signal is generated when the closing price is below the lower rail of 1.0 standard deviations and RSI is greater than 42 at the same time. A sell signal is generated when the closing price is above the upper rail of 1.0 standard deviations and RSI is greater than 70 at the same time. In addition, this strategy also sets two sets of BB and RSI parameters, which are used for entry and stop loss closing positions respectively. These parameters are optimal values obtained through extensive backtesting and machine learning.
The biggest advantage of this strategy is the accuracy of parameters. Through machine learning methods, each parameter is obtained through comprehensive backtesting to achieve the best Sharpe ratio. This ensures both the return rate of the strategy and controls risks. In addition, the combination of double indicators also improves the accuracy and win rate of signals.
The main risk of this strategy comes from the setting of stop loss points. If the stop loss point is set too large, it will not effectively control losses. In addition, if the stop loss point does not properly calculate other trading costs such as commissions and slippage, it will also increase risks. To reduce risks, it is recommended to adjust the stop loss magnitude parameter to reduce trading frequency, while calculating a reasonable stop loss position.
There is still room for further optimization of this strategy. For example, you can try to change the length parameters of Bollinger Bands, or adjust the overbought and oversold thresholds of RSI. You can also try to introduce other indicators to build a multi-indicator combination. This may increase the profit space and stability of the strategy.
This strategy combines double BB indicators and RSI indicators, and obtains optimal parameters through machine learning methods to achieve high returns and controllable risk levels. It has the advantages of combined indicator judgement and parameter optimization. With continuous improvement, this strategy has the potential to become an excellent quantitative trading strategy.
[/trans]
Strategy Arguments
| Argument | Default | Description |
|---|---|---|
| v_input_1 | true | Version 1 - Doesn't Use SL/TP |
| v_input_2 | false | Version 2 - Uses SL/TP |
| v_input_3 | 6.604 | Stop Loss % |
| v_input_4 | 2.328 | Take Profit % |
Source (PineScript)
/*backtest
start: 2023-12-01 00:00:00
end: 2023-12-31 23:59:59
period: 1h
basePeriod: 15m
exchanges: [{"eid":"Futures_Binance","currency":"BTC_USDT"}]
*/

// @version=4
// This source code is subject to the terms of the Mozilla Public License 2.0 at https://mozilla.org/MPL/2.0/
// © Bunghole 2020
strategy(overlay=true, shorttitle="Flawless Victory Strategy" )

// Stoploss and Profits Inputs
v1 = input(true, title="Version 1 - Doesn't Use SL/TP")
v2 = input(false, title="Version 2 - Uses SL/TP")
stoploss_input = input(6.604, title='Stop Loss %', type=input.float, minval=0.01)/100
takeprofit_input = input(2.328, title='Take Profit %', type=input.float, minval=0.01)/100
stoploss_level = strategy.position_avg_price * (1 - stoploss_input)
takeprofit_level = strategy.position_avg_price * (1 + takeprofit_input)

//SL & TP Chart Plots
plot(v2 and stoploss_input and stoploss_level ? stoploss_level: na, color=color.red, style=plot.style_linebr, linewidth=2, title="Stoploss")
plot(v2 and takeprofit_input ? takeprofit_level: na, color=color.green, style=plot.style_linebr, linewidth=2, title="Profit")

// Bollinger Bands 1
length = 20
src1 = close
mult = 1.0
basis = sma(src1, length)
dev = mult * stdev(src1, length)
upper = basis + dev
lower = basis - dev

// Bollinger Bands 2
length2 = 17
src2 = close
mult2 = 1.0
basis2 = sma(src1, length2)
dev2 = mult2 * stdev(src2, length2)
upper2 = basis2 + dev2
lower2 = basis2 - dev2

// RSI
len = 14
src = close
up = rma(max(change(src), 0), len)
down = rma(-min(change(src), 0), len)
rsi = down == 0 ? 100 : up == 0 ? 0 : 100 - 100 / (1 + up / down)

// Strategy Parameters
RSILL= 42
RSIUL= 70
RSILL2= 42
RSIUL2= 76

rsiBuySignal = rsi > RSILL
rsiSellSignal = rsi > RSIUL
rsiBuySignal2 = rsi > RSILL2
rsiSellSignal2 = rsi > RSIUL2

BBBuySignal = src < lower
BBSellSignal = src > upper
BBBuySignal2 = src2 < lower2
BBSellSignal2 = src2 > upper2

// Strategy Long Signals
Buy = rsiBuySignal and BBBuySignal
Sell = rsiSellSignal and BBSellSignal
Buy2 = rsiBuySignal2 and BBBuySignal2
Sell2 = rsiSellSignal2 and BBSellSignal2

if v1 == true
    strategy.entry("Long", strategy.long, when = Buy, alert_message = "v1 - Buy Signal!")
    strategy.close("Long", when = Sell, alert_message = "v1 - Sell Signal!")

if v2 == true
    strategy.entry("Long", strategy.long, when = Buy2, alert_message = "v2 - Buy Signal!")
    strategy.close("Long", when = Sell2, alert_message = "v2 - Sell Signal!")
    strategy.exit("Stoploss/TP", "Long", stop = stoploss_level, limit = takeprofit_level)
Detail
https://www.fmz.com/strategy/440303
Last Modified
2024-01-29 10:33:43