Name
反转布林带RSI-MACD量化策略Reversal-Bollinger-Band-RSI-MACD-Quant-Strategy
Author
ChaoZhang
Strategy Description
该策略是一种典型的跟踪市场趋势的量化策略。它主要利用布林带、RSI指标以及MACD指标判断市场的超买超卖情况,进行反向交易。当出现超买信号时,adoption该策略通过做空获得超额收益;当出现超卖信号时,该策略通过做多获得超额收益。
该策略主要使用三个指标进行判断。
首先,它使用布林带上下轨来判断价格是否进入超买或超卖区域。具体来说,如果价格高于上轨,表示市场可能处于超买状态;如果价格低于下轨,表示市场可能处于超卖状态。
其次,该策略使用RSI指标判断市场的超买超卖情况。RSI低于30时视为超卖信号;RSI高于70时视为超买信号。
最后,该策略还使用MACD指标的零轴交叉作为辅助判断。当MACD线从上向下跨过信号线时生成卖出信号;当MACD线从下向上跨过信号线时生成买入信号。
综合这三个指标的判断,该策略可以有效捕捉市场反转的时机,按照反向进场,随大趋势运行,获得超额收益。
该策略最大的优势在于结合多重指标判断市场趋势,增强了决策的正确性。
首先,布林带本身就具有很强的趋势判断能力。结合布林带通道判断价格是否进入超买超卖区域。
其次,RSI指标是一种很典型的反转指标。RSI指标的超买超卖阈值设定,也增强了判断的准确性。
最后,MACD零轴交叉是非常经典的判断买卖点的指标。结合 MACD的零轴交叉信号,可以非常准确地判断反转点。
总的来说,该策略通过多种指标的有效结合,判断力更加准确,胜率也会比单一指标更高,从而获得稳定的超额收益。
尽管该策略设计合理,结合多重指标判断,但仍然存在一定的风险需要警惕。
首先,如果遇到市场出现长期单边行情而没有明显反转时,该策略会产生较多的亏损交易。此时需要暂时退出,等待反转机会出现。
其次,RSI和MACD的参数设置需要根据不同市场谨慎测试。如果参数设置不当,也会导致错误信号,产生亏损。
最后,布林带本身对异常波动也比较敏感。当市场出现低频率的剧烈波动时,需要审慎对待布林带信号。
总的来说,该策略主要适用于波动较大、反转比较明显的市场环境。在风险管理方面,可以设置止损来控制最大亏损;另外优化参数使其适应不同市场也很关键。
该策略可以从以下几个方面进行进一步优化:
-
优化布林带参数,使布林带更贴近市场波动范围。可以测试不同长度周期以及标准差倍数参数,找到最优参数组合。
-
优化RSI参数,调整超买超卖阈值,降低误报率。可以通过回测找到最佳的参数设置。
-
优化MACD参数,找到最佳的快线慢线和信号线参数组合,提高MACD零轴交叉的判断准确性。
-
增加止损策略,限制单次亏损百分比,有效控制风险。
-
增加仓位管理策略,根据市场波动程度动态调整每次交易的仓位和杠杆。
-
结合其他指标和交易信号,提高决策的准确性。例如结合交易量异常等其他信号。
通过参数优化、风险控制、信号融合等方法,可以进一步提升该策略的稳定性和收益率。
该反转布林带RSI MACD量化策略,通过合理运用布林带、RSI指标和MACD指标的交叉判决,有效判断市场可能出现的反转时机,按照反向交易,跟踪市场大趋势。相比单一指标判断,该组合策略判断更加准确,胜率更高,能获得较为稳定的超额收益。当然在实际运用中,仍需要综合考虑市场环境、参数优化、风险控制等因素,以提高策略的健壮性。
||
This strategy is a typical quant strategy that tracks market trends. It mainly uses Bollinger Bands, RSI indicator and MACD indicator to judge the overbought and oversold situation of the market and make reverse trades. When overbought signals appear, the strategy makes profits by shorting; when oversold signals appear, it makes profits by going long following the trend.
The strategy mainly uses three indicators for judgement.
Firstly, it uses the upper and lower rails of Bollinger Bands to determine if the price has entered the overbought or oversold zone. Specifically, if the price is higher than the upper rail, the market may be overbought; if the price is lower than the lower rail, the market may be oversold.
Secondly, the strategy uses the RSI indicator to determine the overbought and oversold condition of the market. RSI below 30 is considered as oversold signal; RSI above 70 is considered as overbought signal.
Finally, the strategy also uses MACD zero line crossovers as an auxiliary judgement. When MACD line crosses signal line from top to bottom, a sell signal is generated; when MACD line crosses signal line from bottom to top, a buy signal is generated.
By combining the judgements of these three indicators, the strategy can effectively capture the timing of market reversal, make reverse entries accordingly, and profit along the major trend.
The biggest advantage of this strategy lies in combining multiple indicators to determine market trends, which enhances the correctness of decisions.
Firstly, Bollinger Bands itself has very strong trend judging capability. It is combined with Bollinger Bands channel to determine whether the price has entered the overbought or oversold zone.
Secondly, RSI is a very typical reversal indicator. The overbought and oversold threshold settings of RSI indicator also enhance the accuracy of judgement.
Finally, MACD zero line crossover is a very classic indicator for determining buy and sell points. Combined with MACD zero line cross signals, reversal points can be determined very accurately.
In summary, by effectively combining multiple indicators, the judgment of this strategy is more accurate and the win rate is higher than single indicator strategies, thereby obtaining stable excess returns.
Although the strategy is reasonably designed with combined multiple indicators, there are still some risks to be aware of.
Firstly, if the market experiences prolonged one-way moves without obvious reversals, this strategy would generate more losing trades. We need to temporarily exit and wait for reversal opportunities in such case.
Secondly, the parameter settings of RSI and MACD need to be carefully tested according to different markets. If the parameters are improperly set, it may also lead to wrong signals and losses.
Finally, Bollinger Bands itself is also quite sensitive to abnormal fluctuations. When the market experiences low-frequency violent swings, Bollinger Bands signals need to be interpreted cautiously.
In general, this strategy is mainly suitable for markets with high volatility and obvious reversals. In terms of risk management, we can set stop loss to control maximum losses; in addition, optimizing parameters to adapt to different market environments is also very important.
The strategy can be further optimized in the following aspects:
-
Optimize Bollinger Band parameters to make the BB channel closer to the market volatility range. Different period lengths and standard deviation multiples can be tested to find the optimal parameter combination.
-
Optimize RSI parameters and adjust overbought/oversold thresholds to reduce false signals. The best parameter settings can be found through backtesting.
-
Optimize MACD parameters to find the optimal fast line, slow line and signal line combinations to improve the accuracy of MACD zero line crossovers.
-
Add stop loss strategy to limit single loss percentage and effectively control risks.
-
Add position management strategy to dynamically adjust position size, leverage based on market volatility.
-
Combine other indicators and trading signals to improve decision accuracy. For example, combine trading volume abnormals etc.
Through methods like parameter optimization, risk control, signal fusion, the stability and profitability of this strategy can be further improved.
The Reversal Bollinger Band RSI MACD Quant Strategy effectively utilizes the crossover judgements of Bollinger Bands, RSI and MACD to determine potential market reversal timings, and makes reverse trades accordingly along the major trend. Compared to single indicator strategies, the combined strategy has more accurate judgement and higher winning rate, able to obtain relatively stable excess returns. Of course in actual usage, factors like market environment, parameter optimization, risk control etc. need to be considered comprehensively to improve the robustness of the strategy.
[/trans]
Strategy Arguments
| Argument | Default | Description |
|---|---|---|
| v_input_1 | 20 | BB Length |
| v_input_2 | 2 | BB Standard Deviation |
| v_input_3 | 14 | RSI Length |
| v_input_4 | 30 | Oversold Threshold |
| v_input_5 | 70 | Overbought Threshold |
| v_input_6 | 12 | MACD Fast Length |
| v_input_7 | 26 | MACD Slow Length |
| v_input_8 | 9 | MACD Signal Smoothing |
Source (PineScript)
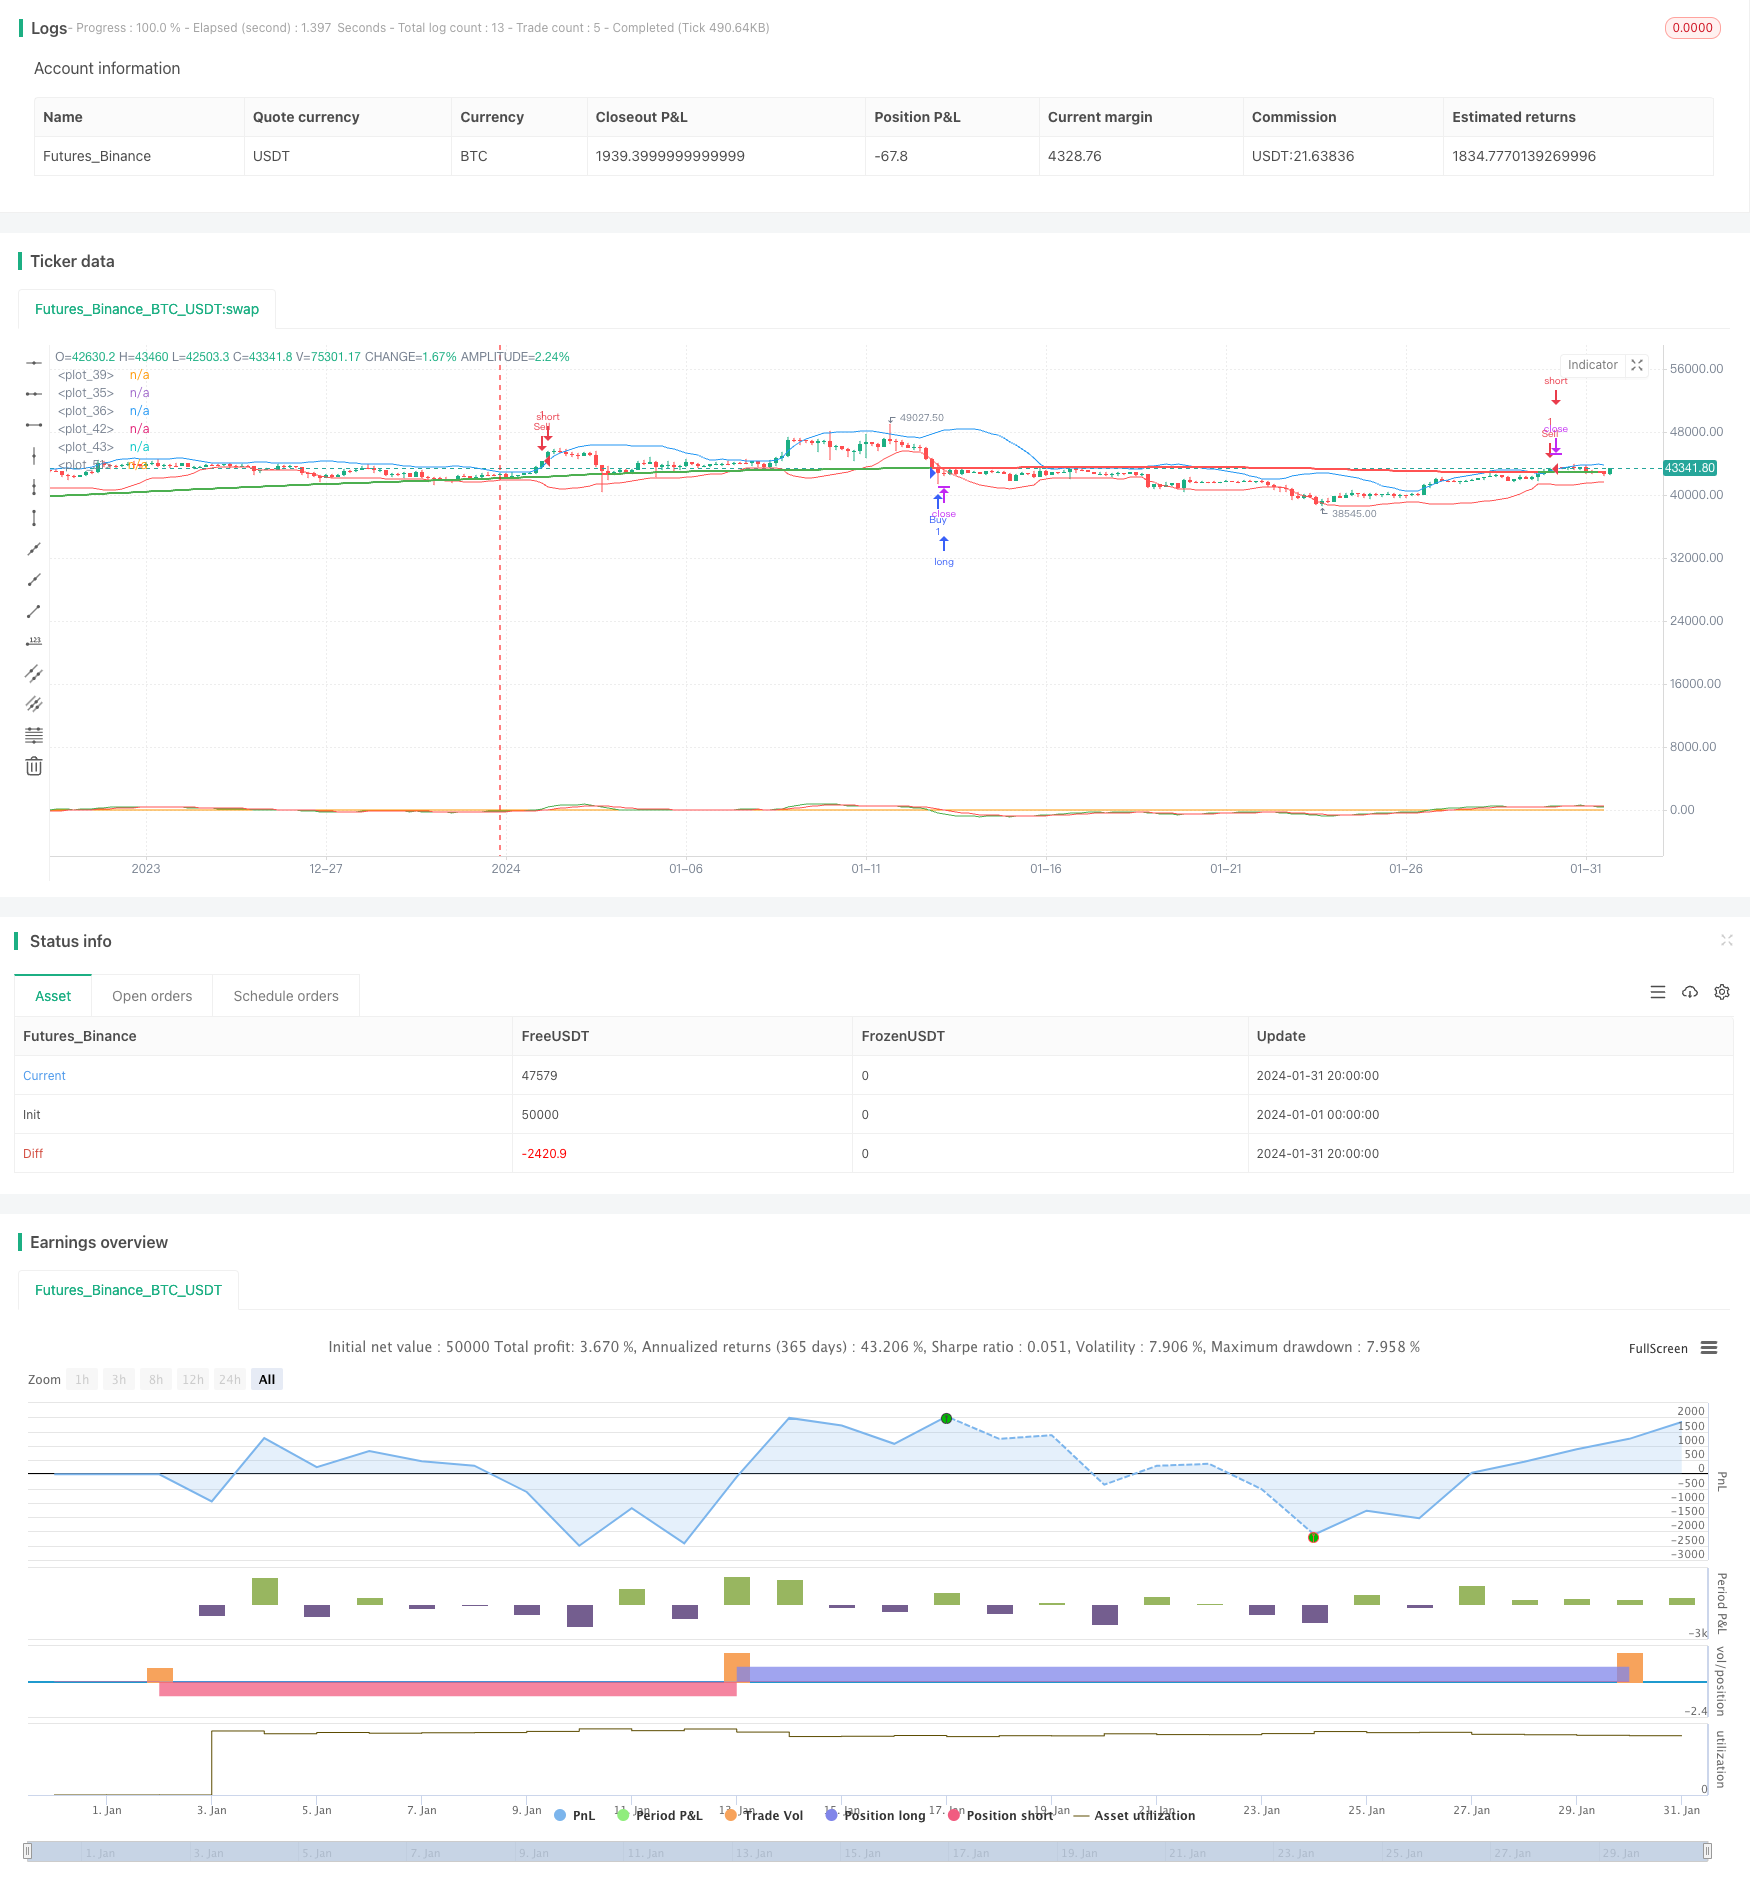
/*backtest
start: 2024-01-01 00:00:00
end: 2024-01-31 23:59:59
period: 4h
basePeriod: 15m
exchanges: [{"eid":"Futures_Binance","currency":"BTC_USDT"}]
*/

//@version=4
strategy("BBands + RSI + MACD Strategy", overlay=true)

// Bollinger Bands
lengthBB = input(20, title="BB Length")
multBB = input(2.0, title="BB Standard Deviation")
basis = sma(close, lengthBB)
dev = multBB * stdev(close, lengthBB)
upperBB = basis + dev
lowerBB = basis - dev

// RSI
lengthRSI = input(14, title="RSI Length")
oversold = input(30, title="Oversold Threshold")
overbought = input(70, title="Overbought Threshold")
rsi = rsi(close, lengthRSI)

// MACD
fastLength = input(12, title="MACD Fast Length")
slowLength = input(26, title="MACD Slow Length")
signalLength = input(9, title="MACD Signal Smoothing")
[macdLine, signalLine, _] = macd(close, fastLength, slowLength, signalLength)

// Conditions
longCondition = close < lowerBB and rsi < oversold and macdLine < signalLine
shortCondition = close > upperBB and rsi > overbought and macdLine > signalLine

// Strategy Entry and Exit
if (longCondition)
    strategy.entry("Buy", strategy.long)
if (shortCondition)
    strategy.entry("Sell", strategy.short)

// Plotting Bollinger Bands
plot(upperBB, color=color.blue)
plot(lowerBB, color=color.red)

// Plotting RSI
plot(rsi, color=color.orange)

// Plotting MACD
plot(macdLine, color=color.green)
plot(signalLine, color=color.red)


// 200-period SMA
sma200 = sma(close, 200)

// Determine Color Change
plot(sma200, color=close > sma200 ? color.green : color.red, linewidth=2)
Detail
https://www.fmz.com/strategy/442639
Last Modified
2024-02-23 14:16:58